
Abstract
Objective
Physical inactivity (PI) is a major contributing factor to obesity, which is an increasing public health concern. This study aimed to examine the relationship between objectively measured physical activity (PA) and body mass index (BMI) among female university students.
Methods
A total of 600 female university students (mean age = 20.93 ± 1.12 years) participated in the study. Anthropometric measurements included weight, height, BMI, waist circumference, fat mass, muscle mass, and body fat percentage. Physical activity was assessed using smartphone-based accelerometers to measure step counts and calories burned.
Results
BMI classifications showed that 8.33% of participants were morbidly obese, 25% overweight, and 19% obese. Significant differences were found between BMI, fat mass, and muscle mass with both step counts and calories expended. Approximately 39.33% of participants were categorized as physically active, while the remaining 60.67% were inactive. Inactive students had higher fat accumulation and significantly fewer daily steps (p ≤ 0.05) compared to active students.
Conclusion
The findings reveal a high prevalence of obesity and PI among Saudi female university students. Active students had significantly lower BMI, waist circumference, fat mass, and body fat percentage than their inactive counterparts. Obese students were less active, had fewer steps, lower muscle mass, and reduced specific muscle strength. These findings underscore the urgent need for preventive health policies targeting overweight and obese female students in Saudi Arabia.
Introduction
Obesity has emerged as a growing global health concern, posing significant risks to public health, particularly among young adults, including university students. It is a primary risk factor for various chronic conditions, such as type 2 diabetes mellitus, cardiovascular diseases, certain types of cancer, and psychological disorders. 1 The etiology of obesity is multifactorial, involving complex interactions between genetic predisposition, physiological mechanisms, environmental influences, and behavioral decisions related to nutrition, physical activity (PA), and lifestyle patterns. 2
In Saudi Arabia, the prevalence of overweight and obesity among female university students has reached alarming levels, with recent studies indicating that ∼47.9% of this population are either overweight or obese.3,4 Physical inactivity (PI) plays a major role in this public health issue, often linked to sedentary behaviors and low levels of structured or unstructured PA.5,6
Research has demonstrated that more than 70% of Saudi youth do not engage in sufficient PA, with a preference for screen-based entertainment such as computer use, video games, and television. Several factors contribute to this inactivity, including academic demands, fatigue, lack of motivation, insufficient recreational facilities, and environmental challenges such as extreme weather conditions.1,7
PA, when performed regularly and at appropriate intensities, has a profound effect on musculoskeletal health, delaying functional decline associated with aging. It encompasses a range of activities, including recreational pursuits, active transportation, structured exercise, and occupational tasks. 8 According to the World Health Organization (WHO), adults aged 18–65 should engage in at least 150 minutes of moderate-intensity aerobic activity or 75 minutes of vigorous-intensity activity per week to obtain significant health benefits, including improved body composition, cardiovascular function, and muscular strength.9,10
Despite these recommendations, accurately measuring PA remains a challenge. Traditional methods such as self-reported questionnaires and activity logs are limited by recall bias and the underreporting of incidental activities, such as brief walking bouts. Furthermore, studies have shown that screen time (e.g. television viewing) independently predicts obesity and metabolic disorders, even when self-reported PA levels are accounted for. 11
The advent of smartphone technology has enabled a more objective assessment of daily PA. Mobile devices equipped with accelerometers provide a reliable and affordable means of tracking PA through step counts, distance covered, caloric expenditure, and activity intensity. Recent studies utilizing smartphone accelerometry have revealed that the majority of university students exhibit low activity levels. For instance, in a study involving 156 university students aged 19–25, 71.8% recorded fewer than 7500 steps/day, indicating low PA levels. In terms of body composition, 24.4% were categorized as overweight or obese, and 31.4% had a high percentage of body fat. 12
Smartphone applications have emerged as a promising and accessible approach to improving adherence to PA guidelines. By 2017, the global number of active mobile phones surpassed the total number of people, with ∼63% of the adult population owning more than one smartphone. 13 This widespread ownership provides a unique opportunity to leverage mobile technologies for health promotion. Numerous studies suggest that smartphone applications can effectively encourage increases in PA levels; however, the observed improvements are generally classified as moderate.
Despite their potential, several limitations must be acknowledged when interpreting these findings. Many of the supporting studies relied heavily on self-reported PA data, which is susceptible to recall bias and social desirability effects. Additionally, most interventions integrated smartphone applications alongside other components, such as in-person consultations, educational podcasts, or counseling sessions, making it difficult to isolate the specific contribution of the app itself to behavior change.14–16 Furthermore, many of these studies were conducted on small or non-representative samples, or within structured intervention settings, which limits the generalizability of their outcomes to broader populations. 17
Accurate evaluation of PA, particularly regarding the frequency, duration, intensity, and type of movement, is essential for designing and monitoring effective public health campaigns and clinical interventions. Objective measurement tools are crucial in this context. Although self-reported questionnaires are widely used in epidemiological studies due to their ease of administration and cost-effectiveness, they often underestimate incidental or low-intensity activities and are considered less reliable than objective methods. Accelerometers, including those embedded in smartphones, have gained considerable popularity for objectively measuring PA in population-based research. These devices can record step counts, movement intensity, energy expenditure, and activity duration, offering more accurate and unbiased data compared to self-report tools.10,18,19
For that, this study aims to investigate the relationship between smartphone-based PA profiles and body mass index (BMI) among female university students. By objectively quantifying PA through smartphone accelerometry, this research seeks to identify the extent to which PA levels correlate with adiposity indicators in this population. The findings may inform the development of targeted interventions and public health strategies to combat obesity and promote healthier lifestyles among Saudi female youth.
Methods
Study design and participants
This longitudinal study was conducted from February to May 2024 at King Faisal University, Al-Ahsa, Saudi Arabia. Female students from diverse faculties, including health, science, engineering, and humanities, were invited to participate. Using the Raosoft online calculator with a 5% margin of error, 95% confidence level, and 50% response distribution, the required sample size was 635 (margin of error = 3.83%). Ultimately, 632 participants were retained after accounting for three losses to follow-up post-intervention. 20
Participants were recruited via campus advertisements, e-mail, SMS, and WhatsApp. The recruitment announcement detailed the study purpose, stated participation was voluntary, and included eligibility criteria. Students who expressed interest contacted the researchers and received additional information before providing written informed consent.
Inclusion criteria were female students aged 18–25 years, non-smokers, not pregnant, had no chronic illness, no history of surgery, not taking medications that affect metabolism, had no physical disabilities, and owned a smartphone. Exclusion criteria included incomplete data or non-compliance. Thirty-five students were excluded due to missing data. Ethical approval was obtained from the King Faisal University Ethics Committee (KFU REC 2024 FEB ETHICS 1992), and the study followed the principles of the Declaration of Helsinki.
Anthropometric and body composition measurements
Body weight and height: Weight was measured to the nearest 0.1 kg using a calibrated Seca 770 digital scale, and height to the nearest 0.1 cm using a Seca measuring rod, with participants barefoot and wearing light clothing. 21
BMI calculation: BMI was calculated as weight (kg) divided by height squared (m²).
22
Participants were classified as follows:
Underweight: < 18.5 kg/m² Normal: 18.5–24.9 kg/m² Overweight: 25–29.9 kg/m² Obese Class I: 30–34.9 kg/m² Obese Class II: 35–39.9 kg/m² Morbidly Obese: ≥ 40 kg/m²
Waist circumference: Measured at the midpoint between the lower rib and iliac crest using a steel measuring tape, with two measurements recorded to the nearest 0.5 cm; the average of the closest two was used, following WHO guidelines. 23
Body composition: Including total fat mass (kg and %) and skeletal muscle mass (kg), was evaluated using bioelectrical impedance analysis (BIA) with the InBody 320 analyzer, a segmental multi-frequency device. This method is validated for use in clinical and research settings due to its reliability and minimal invasiveness. 24 Participants were instructed to fast for at least 8 hours prior to measurement and to refrain from caffeine intake and intense PA for at least 12 hours before testing. During the measurement, participants stood barefoot on the device and held the hand electrodes as directed by the manufacturer. Each measurement was repeated twice. If the results varied by more than 0.5 kg for either fat or muscle mass, a third measurement was obtained. The means of the two closest values were used for analysis. Muscle strength (kg/kg) and power (W/kg) were further derived by normalizing measured strength and power outputs to the participant's skeletal muscle mass.
PA assessment
PA was assessed over 3 continuous weeks using the built-in accelerometer of the Apple iPhone 14. The accelerometer detects movement, speed, and direction changes, enabling step count and motion tracking through a dedicated mobile app. Participants were instructed to carry their phones at all times, except while sleeping or bathing, and maintain their usual activity patterns. 25
The accelerometer collected data within a 24-hour period in the following measures: The total number of steps, calories burned, stairs climbed, and distance covered.
The accelerometer collected data within a 24-hour period in the following measures: the total number of steps; calories burned; stairs climbed; and distance covered. Daily step counts were classified based on the adult PA thresholds defined by Tudor-Locke et al., 26 which provide standardized cut-off points for interpreting levels of ambulatory activity as shown in Figure 1.

Step count indices for adults.
Statistical analysis
Data was analyzed using SPSS (IBM Version 24). Descriptive statistics were used to summarize anthropometric and PA characteristics, presented as mean ± standard deviation (SD) for continuous variables. Independent t-tests were employed to compare the mean values of body composition and PA variables between two independent groups. This statistical test was selected to determine whether the observed differences between groups were statistically significant. Pearson correlation coefficients were used to examine the relationships between participant characteristics and both BMI categories and PA status, as well as the associations between participant characteristics and fat- and muscle-related parameters. One-way analysis of variance (ANOVA) was used to compare continuous variables across BMI categories. Where the ANOVA indicated significant differences, Tukey's honest significant difference (HSD) post-hoc test was applied to identify pairwise differences while controlling for Type I error due to multiple comparisons. Superscript letters (a, b, c, etc.) in the tables denote statistically significant. 27
Results
Table 1 presents the descriptive characteristics, including anthropometric data and PA measures for the student groups. Body weight varied widely among participants. Based on BMI classifications, the prevalence of morbid obesity was 8.33%, obesity was 25%, and overweight was 19%, while 39.33% of students had a normal BMI. The group with high BMI (obese and overweight) accounted for 52.33% of the sample. Their average caloric expenditure ranged from 103.76 to 260.64 kcal/day, which was significantly lower compared to the normal BMI group (average 582.56 kcal/day, p ≤ 0.05). Similarly, the distance covered per day showed significant variation by BMI group, ranging from 142.76 km in the higher BMI group to 463.11 km in the normal BMI group (p ≤ 0.05). Time spent active was also significantly affected by BMI: participants with higher BMI tended to spend more time on low-intensity activities, despite covering shorter distances and burning fewer calories (p ≤ 0.05). Regarding stair climbing, 52.33% of the students averaged 0.23–1.06 climbs/day, while 39.33% recorded an average of 1.33 climbs/day, with frequency decreasing significantly with increasing BMI (p ≤ 0.05). Muscle mass, specific muscle strength, and specific muscle power were all significantly associated with BMI classification. Students with higher BMI demonstrated lower specific muscle strength and power (p ≤ 0.05), suggesting a decline in functional muscle capacity with increased adiposity. Waist circumference had the strongest inverse correlation with daily step count among all PA indicators, showing the most statistically significant association in models analyzing female students’ activity levels (p ≤ 0.05). Furthermore, step counts decreased significantly as BMI increased across all groups, except for the underweight category (p ≤ 0.05). The normal BMI group consistently recorded higher step counts compared to overweight and obese students, with statistically significant differences (p ≤ 0.05).
Anthropometric and physical activity characteristics by BMI category.

Values are mean ± SD. Superscript letters indicate significant differences between groups; ANOVA, p ≤ 0.05. (n = 600).
BMI: body mass index; ANOVA: analysis of variance.
Table 2 summarizes the adiposity indicators, flexibility, and smartphone-measured activity metrics for students categorized by activity status. Among the participants, 47.67% were classified as active, while 52.33% were inactive, with the majority of the inactive group exhibiting higher levels of obesity. Significant differences were observed between active and inactive students across all measured parameters except height (p ≤ 0.05). Specifically, BMI and time spent on PA were significantly lower in the active group compared to the inactive group (p ≤ 0.05). Conversely, calories burned, distance travelled, and stair climbing frequency were significantly higher among active students (p ≤ 0.05), indicating greater energy expenditure and mobility. Smartphone-recorded step counts also varied significantly between groups (p ≤ 0.05), with active students logging more daily steps than their inactive counterparts. Inactive students, particularly those with higher fat accumulation, recorded significantly fewer steps per day (p ≤ 0.05). Additionally, the number of daily steps was inversely correlated with body fat percentage and BMI, indicating that as activity levels increased, both fat percentage and BMI significantly decreased (p < 0.05).
Participants’ adiposity and physical activity characteristics by activity category.

Values are mean ± SD. Superscript letters in the same row indicate statistically significant differences between groups at p ≤ 0.05. (n = 600). BMI: body mass index.
Table 3 presents the correlation coefficients between various participant characteristics based on both BMI categories and activity status. Age showed a strong, positive correlation with BMI and body weight (p ≤ 0.01), and a strong, negative correlation with calories spent (p ≤ 0.01). Additionally, age was positively correlated with height (p ≤ 0.05), but negatively correlated with time spent, distance travelled, number of staircases climbed, and daily step counts (p ≤ 0.01). BMI demonstrated a strong, positive correlation with body weight and time spent (p ≤ 0.01), and a strong, negative correlation with calories burned, distance covered, staircases climbed, and step counts (p ≤ 0.01). Height was only significantly correlated with calories burned (p ≤ 0.05). Body weight had a strong, negative correlation with calories burned, distance, staircases, and step counts (p ≤ 0.01), and a strong, positive correlation with time spent (p ≤ 0.01). Calories burned exhibited a very strong, positive correlation with time spent (p ≤ 0.001), and strong, positive correlations with distance, staircases climbed, and step counts (p ≤ 0.01). Time spent had a strong, negative correlation with distance, staircases, and step counts (p ≤ 0.01). Distance traveled was positively correlated with both staircases climbed and step counts (p ≤ 0.05). Finally, staircases climbed showed a significant positive correlation with step counts (p ≤ 0.05).
The correlation coefficient between participants’ characteristics.

Note: BMI: body mass index. * Significant at p ≤ 0.05; ** Highly significant at p ≤ 0.01; *** Very highly significant at p ≤ 0.001.
Table 4 presents the correlation coefficients between participant characteristics and both fat and muscle-related parameters. Age and BMI showed strong, positive correlations with waist circumference, triceps skinfold thickness, fat mass, and body fat percentage (p ≤ 0.01). In contrast, both variables demonstrated strong, negative correlations with muscle mass, specific muscle strength, and specific muscle power (p ≤ 0.01). Additionally, age and BMI were negatively correlated with time spent, distance travelled, staircases climbed, and step counts (p ≤ 0.01), indicating lower activity levels in individuals with higher age or BMI. Body weight exhibited strong, positive correlations with all fat storage indicators (waist circumference, triceps skinfold, fat mass, and fat percentage), and strong, negative correlations with muscle-related parameters (p ≤ 0.001), highlighting an inverse relationship between fat accumulation and muscle health. Calories burned, time spent, distance travelled, staircases climbed, and step counts all showed strong, positive correlations with muscle mass, specific muscle strength, and specific muscle power (p ≤ 0.001). Conversely, these PA measures were negatively correlated with fat-related indicators (p ≤ 0.001), indicating that greater PA is associated with healthier body composition, higher muscle mass, and lower fat accumulation.
The correlation coefficient between participants’ muscle and fat parameters and participants’ characteristics.
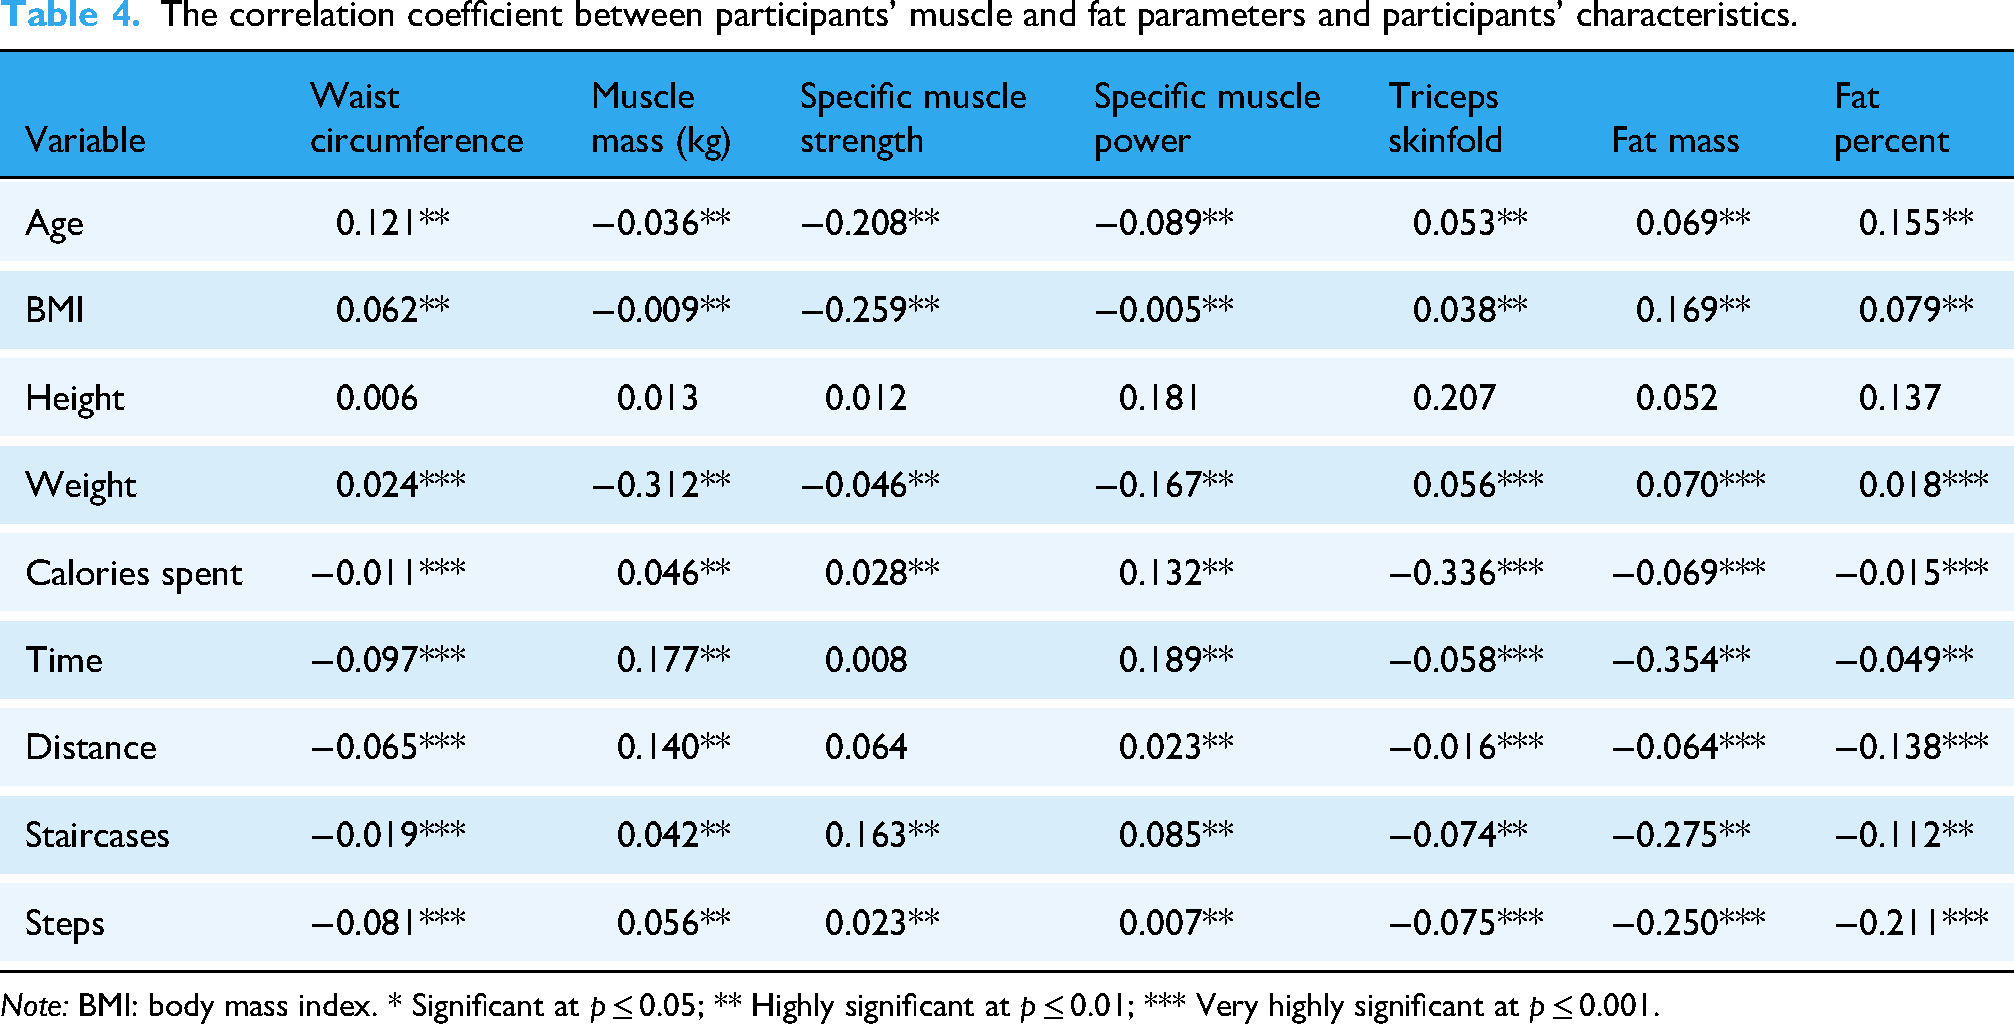
Note: BMI: body mass index. * Significant at p ≤ 0.05; ** Highly significant at p ≤ 0.01; *** Very highly significant at p ≤ 0.001.
Discussion
Obesity is a multifactorial health issue stemming primarily from an imbalance between caloric intake and expenditure. Reduced PA plays a pivotal role in this imbalance, leading to increased energy storage as fat. Adopting sedentary lifestyles and neglecting regular PA can contribute to excessive weight gain and the development of obesity, which is associated with elevated risks of type 2 diabetes, cardiovascular disease, certain cancers, and stroke.28,29
Excess adiposity also impairs endurance, coordination, and mobility. Maintaining a healthy body weight thus requires a balance between energy intake and expenditure. In many developing nations, economic and social transitions have triggered shifts in dietary habits and activity patterns, contributing to rising obesity rates, particularly among youth. 30
The current study supports the use of smartphone accelerometers as valid tools for assessing PA in both research and applied settings. Average daily step counts among participants were consistent with previously reported values for adults (10,000–11,700 steps/day).14,16 In comparison, American youth have reported similar step counts (∼11,589), 31 while higher counts were observed in Swedish (15,673–18,346), 32 British (11,000–16,000), 33 and New Zealand (15,606)34,35 populations. Female students reaching 15,000 + steps/day were categorized as “very active,” 36 aligning with WHO guidelines for PA. 7
However, findings from this study reveal a concerningly high prevalence of PI, with 60.66% of students classified as low or very low activity (3001–6104 steps/day). Only 18% were considered active (exceeding 10,000 steps/day), while 21.33% fell into the moderately active category (∼8741 steps/day). This trend highlights PI as a major public health concern among Saudi youth, particularly female university students. Previous research indicates that many do not meet recommended daily step counts. One study reported that Saudi female university students averaged 6825 steps/day—well below the 10,000-step benchmark. 4 National estimates show PI prevalence ranging between 43.3% and 99.5% among Saudi women, with nearly half not engaging in any exercise, and 29% only performing light activity.37,38
A previous study reported that 42.56% of women achieved a daily step count of at least 10,000 steps, thereby meeting widely recognized PA recommendations. 39
Several factors may contribute to the high prevalence of PI among university students in Saudi Arabia. These include the sedentary nature of academic schedules, extended periods of sitting during lectures and study sessions, and the limited accessibility and affordability of recreational facilities. 40 Furthermore, the country's hot and arid climate may act as a barrier to outdoor PA. 6 When coupled with increased reliance on technology and motorized transportation, these environmental and behavioral factors may discourage individuals from maintaining an active lifestyle. 40
It is also important to acknowledge that step count alone does not provide a comprehensive assessment of PA levels, as it does not account for exercise duration, intensity, or type. Nonetheless, daily step count remains a valuable and practical proxy for estimating overall physical movement and energy expenditure. 10
The high prevalence of obesity (52.33%) and PI (60.66%) observed among students in this study aligns with findings from previous local research,41,42 suggesting that significant lifestyle changes have occurred over recent decades. The increased accessibility and consumption of high-calorie foods and snacks among Saudi students, coupled with a marked decline in habitual PA, have likely contributed to this trend. Additionally, sedentary behaviors, such as prolonged television viewing, video gaming, and computer use, have become increasingly common, 43 supporting the patterns seen in our data.
The high prevalence of obesity and PA observed among students in this study is consistent with previous local research, which suggests that substantial lifestyle changes have occurred over recent decades.
Notably, 53.33% of the participants in this study were classified as both obese and physically inactive. A negative association was found between PA and time spent on video games, with the most sedentary (morbidly obese) group spending an average of 287.5 ± 6.91 minutes daily on such activities, compared to 81.27 ± 4.58 minutes in the overweight group. These findings highlight the urgent need for increased opportunities for PA both within and outside the university and home environments. Strategies to promote active lifestyles may include expanding physical education programs and developing accessible community recreation centers. 44 Furthermore, promoting walking, encouraging participation in sports, and reducing screen time could help increase daily energy expenditure and improve energy balance. 45
The current findings reinforce the importance of reducing sedentary behaviors to combat obesity. Active participants showed significantly lower fat mass (11.14–24.20 kg), fat percentage (17.94%–35.99%), and waist circumference (73.23–118.75 cm) compared to their inactive counterparts, who recorded 29.71 kg, 41.01%, and 132.07 cm, respectively. Furthermore, previous studies corroborate that insufficient vigorous activity is a risk factor for higher BMI. Failing to meet the recommended 60 minutes of moderate to vigorous activity daily is associated with overweight status among youth, particularly in the US. 44
Other research has shown that obese individuals exhibit lower energy expenditure (total, activity, and resting), and engage less in exercise, while spending more time in sedentary and resting states. 46 In the present study, sedentary individuals (52.33%) spent an average of 421.89 minutes in inactivity, compared to a range of 77.89–357.5 minutes among more active groups. There was also a strong inverse relationship between step counts and fat parameters such as BMI and fat mass. 46 Data indicated that individuals with higher BMI categories (morbidly obese, obese, and overweight) had 43%, 69%, and 76% fewer steps, respectively, than those with normal BMI. In female college students, the average step count was 5162, with only 15.9% achieving 10,000 steps/day, and step count was inversely correlated with body fat percentage (r = −0.24, p < 0.01).47–49
The study conducted by Dong et al. 50 found an association between sedentary behaviors, such as television viewing and video gaming, and both overweight status and low PA levels. These patterns were, in turn, inversely associated with muscle-related parameters. Similarly, Rennie et al. 51 reported a significant negative correlation between energy expenditure and indicators of body fat, including fat percentage, fat mass, and waist circumference. These findings are consistent with the present study, which demonstrated that increased PA was linked to reduced fat accumulation among students.
In terms of energy expenditure, the present results showed marked improvements in calorie expenditure, by ∼47%, 68%, and 84%, when comparing groups with increasing levels of activity. Supporting this, another study using accelerometer data from 119 female college students found that over half (57.1%) failed to meet the recommended daily step count of 10,000 steps. Additionally, 19.3% of the participants were classified as overweight or obese based on BMI, while 36.1% exhibited body fat percentages above the normative range for their age and gender. This study also identified a significant inverse correlation between daily step count and body fat percentage (r = –0.24, p < 0.01). 47
It is important to note that, while existing studies suggest a potential association between PA levels, measured via smartphone accelerometers, and body composition, the causal nature of this relationship remains inconclusive. One possibility is that individuals who accumulate higher step counts tend to exhibit more favorable body composition due to increased energy expenditure associated with greater metabolic activity. 52 Conversely, individuals with lower body weight or fat mass may demonstrate higher PA levels owing to improved mobility and other physiological advantages. 53
Furthermore, a range of confounding variables must be considered when interpreting this relationship. These include behavioral patterns, genetic predispositions, hormonal influences, and various lifestyle factors, all of which may mediate or moderate the association between PA and body composition outcomes. 54
When focusing specifically on university students, the relationship between PA levels, monitored through smartphone accelerometers, and body composition may be of particular relevance. This stage of early adulthood is critical for establishing long-term health behaviors, such as regular PA, which can significantly influence overall well-being and future health outcomes. 47
Strengths and limitations
This study presents several important strengths. To the best of our knowledge, it is the first investigation in Saudi Arabia to utilize smartphone technology for objectively measuring PA levels and exploring their association with obesity-related indicators. The use of smartphone-based accelerometers enables continuous, real-time monitoring of PA, thereby minimizing the biases commonly associated with self-reported data. Given the widespread accessibility and user-friendliness of smartphones, particularly among university students who are generally technologically proficient, this method offers a cost-effective and scalable approach to data collection. Additionally, by assessing participants in their natural environments rather than controlled laboratory settings, the study provides a more ecologically valid representation of real-world PA behaviors.
Despite these strengths, the study also has notable limitations. The use of convenience sampling may limit the generalizability of the findings to the broader population. Moreover, reliance on participants to consistently carry their smartphones may lead to incomplete or inaccurate data if the device is not worn or kept nearby during all activities. Certain forms of exercise, such as cycling, resistance training, or non-ambulatory movements, may not be accurately captured by accelerometer data. Variability in accelerometer sensitivity and accuracy across different smartphone models and brands could introduce inconsistencies in measurement. Furthermore, the study focused exclusively on female university students, which restricts the applicability of the results to other demographic groups with different age ranges, genders, or activity levels. Finally, potential confounding variables, such as dietary habits, socioeconomic status, and genetic predispositions, were not accounted for, which may influence both PA levels and body composition outcomes.
Conclusion
This study highlights a concerning prevalence of obesity and PI among Saudi female university students. A clear inverse relationship was observed between daily step counts and various adiposity indicators, particularly BMI, waist circumference, and fat mass. Students classified as physically active demonstrated significantly lower BMI and fat-related measurements, alongside increased caloric expenditure and greater muscle mass, compared to their inactive peers. These findings emphasize the importance of promoting PA as a strategy for improving body composition and reducing obesity-related risks in this population. Future research is warranted to further investigate the determinants of PA patterns and to develop targeted, evidence-based interventions aimed at fostering healthier, more active lifestyles among young adults in Saudi Arabia.
Footnotes
Acknowledgements
The author expresses gratitude to the students who participated in this study.
Human ethics and consent to participate declarations
The students signed the consent form, which provided all required information regarding the study's purpose, all measurements, and laboratory tests. Ethical approval was granted by the Research Ethics Committee of King Faisal University (KFU REC 2024 FEB ETHICS 1992), Saudi Arabia.
Authors’ contributions and materials
The author confirms sole responsibility for the following: study conception and design, data collection, analysis and interpretation of results, and manuscript preparation.
Funding
The author(s) disclosed receipt of the following financial support for the research, authorship, and/or publication of this article: This work was supported by the Deanship of Scientific Research, Vice Presidency for Graduate Studies and Scientific Research, King Faisal University, Saudi Arabia (KFU241686).
Declaration of conflicting interests
The author declared no potential conflicts of interest with respect to the research, authorship, and/or publication of this article.
Data availability statement
The data used to support the findings of this study are available from the corresponding author upon request.