
Abstract
Background
AD is a significant public health challenge, and AI technologies, including deep learning and machine learning, offer the potential to dramatically improve diagnostic and predictive accuracy. These technologies are widely applied in AD research. However, comprehensive literature summaries of this field remain limited. This study uses bibliometric analysis to examine research hotspots, trends, future development potential, and limitations in AI-based AD diagnosis and prediction.
Methods
We conducted a bibliometric analysis of 100 top cited studies on AI-based diagnosis and prediction of AD, using data from the WoSCC. We performed the analysis using CiteSpace 6.3.R2, VOSviewer 1.6.19, Scimago Graphica 1.0.39, Microsoft Excel 2021, and R package Bibliometrix running in RStudio, visualizing the results through graphical representations.
Results
It was found that the top cited 100 articles came from 51 journals and 31 countries. The journal with both the highest number of published articles and the greatest citation frequency was NEUROIMAGE, while PROTEIN ENGINEERING DESIGN & SELECTION boasted the highest average citation rate. The country with the largest volume of published articles was the United States, followed by China and the United Kingdom. In terms of institutions, the University of North Carolina had produced the most publications. The keywords identified fall into 9 categories. The most frequently occurring keywords are “Alzheimers disease”, “mild cognitive impairment”, “classification”, “MRI”, “deep learning”, “diagnosis”, “dementia”, “biomarkers”, “brain atrophy”, “machine learning”, “voxel based morphometry”, “prediction”, and “patterns”.
Conclusion
AI-based technologies for AD diagnosis and prediction are becoming indispensable clinical tools. Future research should leverage AI to identify novel AD biomarkers, enabling precision diagnosis and treatment. However, our bibliometric analysis has limitations: language and citation biases may skew interpretation of emerging AI-AD trends.
Introduction
Alzheimer's disease (AD) is a neurodegenerative condition that is associated with ageing and is characterised by the progressive degeneration of the brain, resulting in cognitive impairment and memory loss. 1 Current estimates posit that approximately 55 million individuals are living with AD globally, and projections indicate that this number will rise to approximately 152 million by the year 2050. 2 It is widely accepted that the two hallmark lesions in the pathogenesis of AD are intracellular neurofibrillary tangles (NFTs) caused by phosphorylated tau (p-tau) proteins and amyloid-β (Aβ) deposition. 3 The etiology of AD is multifaceted and may be related to autophagy damage, 4 epigenetic dysregulation, 5 neuroinflammation, 6 environmental factors, 7 and others. The Food and Drug Administration (FDA) has only approved five drugs for the treatment of AD: tacrine, donepezil, carbalatine, galantamine and memantine, and lecanemab. Tacrine is no longer commonly used among these drugs due to toxicity. Lecanemab is a very recent addition and may not yet be included in all guidelines. None of these drugs can improve the disease. They can only control symptoms and delay the onset of AD. 8 Furthermore, by the time clinical symptoms manifest, the majority of patients have already progressed to moderate to severe AD. At this stage, no treatment options are available to halt disease progression. 9 Focusing on the early diagnosis as well as the prognosis of AD appears to be crucial given the lack of symptoms in the prodromal phase of AD and the lack of effective clinical treatment strategies.
Traditional diagnosis and assessment of AD relies on cognitive function tests, brain imaging techniques, and cerebrospinal fluid (CSF) levels of Aβ42 and hyperphosphorylated tau proteins, 10 which are expensive and relatively invasive strategies for AD assessment, and the sensitivity and specificity of the CSF Aβ42 and p-tau proteins biomarkers have raised concerns about their clinical significance concerns. 11 Artificial Intelligence (AI) is a science that involves a variety of fields and technologies, including aspects of pattern recognition, robotics, and decision support systems, and aims to extend human intelligence through machine simulation. 12 In the context of AD, AI technologies use a wide range of medical data, including clinical baseline information, neuroimaging, and genetics, to provide insights into the diagnosis and prognosis of AD that go beyond human analytical capabilities.13,14
As AI is capable of creating predictive models of AD risk and progression, it is important to note that understanding the overall progress and research trends in this multidimensional approach still remains challenging. Bibliometric analysis is a scientific and statistical methodology that has been used to study research trends and progress in various disciplines, covering the history of development and research boundaries of a discipline, highlighting the contributions of various research institutions, countries and publications. Bibliometric analysis can fill in research gaps in related areas and help break research bottlenecks. 15 There is a gap in bibliometric studies on the application of AI diagnosis and prediction in the context of AD, therefore, after obtaining studies related to diagnosis and prediction using AI techniques such as machine learning and deep learning in the context of AD, we extracted the top cited 100 articles for the bibliometric analysis and proposed future plans and recommendations.
Materials and methods
Data sources and search strategies
The literature included in this study was obtained from the SCI-Expanded database in the Web of Science Core Collection (WoSCC). The database is comprehensive and extensive, and its inclusion of journals in roughly 170 subject categories makes it possible to select WoSCC for bibliometric analyses. 16 On 26 December 2024, we searched using the following search strategy: ts = (“artificial intelligence” OR “deep learning” OR “machine learning” OR “artificial neural network” OR “robotic∗” OR “intelligent∗”) AND TS = (“Alzheimer Disease” OR “Alzheimer's Disease”) AND TS = (“prediction” OR “diagnosis”). Since the indicators change over time, the literature search and data export were done on the same day to avoid bias caused by frequent database updates. By March 20, 2025, all manuscripts, figures, and tables associated with this study had been finalized. The entire process spanned a total of 84 days.
Eligibility criteria for the literature bibliometric analysis
Before researchers included the top cited 100 articles, they first manually screened the raw data according to the eligibility criteria to determine the final studies to be included, which included information such as article titles, abstracts, keywords, and full text, and references if necessary. Content criteria: (1) included literatures should include research topics in AD; (2) included literatures should include research topics in AI. Exclusion criteria were developed during this process: (1) articles that were inconsistent with the study topic; (2) articles with incomplete content, such as missing information in the abstract, author information, keywords, and full text; (3) documents with one of the following document types: early access, meeting abstract, book chapters, letter, correction, retracted publication, editorial material, data paper, meeting, and news item; (4) non-English literature.
Data collection and cleansing
Since this research involves the field of artificial intelligence, the retrieval scope of databases such as Scopus and PubMed is relatively limited. However, the SCI-Expanded database in WoSCC includes more than 10,000 journals, covering multiple broad disciplinary fields such as natural science, social science, art, and humanities. It is widely regarded as one of the most authoritative resources for bibliometric analysis. We exported the parameters and data of the top cited 100 articles retrieved from WoSCC in “Txt” format, and then manually cleaned the documents and data. In doing so, we corrected any inaccuracies in the glossary of included literature and merged duplicate terms. 17 For example, “ad”, “alzheimers disease (ad)”, “alzheimer disease”, and “early alzheimers disease” were consistently replaced with “alzheimers disease”. In addition, we standardised the countries in the selected literature to prevent name changes from affecting the results. For example, “England”, “Scotland”, “Wales”, and “Northern Ireland” were standardised to “United Kingdom”, and “Taiwan” was standardised to “China”. This meticulous approach ensures the accuracy and comprehensiveness of the data and lays a reliable foundation for subsequent analyses and research. The above process was independently completed by two researchers simultaneously. If there were any inconsistencies, it would be referred to the arbitration of a third researcher.
Bibliometric analysis
To highlight the focus and trends of this study, we used the following software tools: CiteSpace 6.3.R2, VOS Viewer 1.6.19, Scimago Graphica 1.0.39, Microsoft Excel 2021, and bibliometric online analytic platform. Specifically, Microsoft Excel 2021 is used for statistical analysis of the number of published articles and citations in the year. The R package Bibliometrix running in RStudio (https://bibliometric.com), 18 VOS Viewer 1.6.19 (https://www.vosviewer.com/getting-started), 19 and Scimago Graphica (https://graphica.app/) were used to conducted a collaborative analysis among countries, institutions, authors, journals and references. 20 CiteSpace (https://citespace.podia.com/) was used to analyze the keywords, designed to identify specific research in the field of hot spots and evolution trend.21–23 In this study, the CiteSpace parameters were set as slice length = 1, g index (k = 25), LRF = 3.0, L/N = 10, LBY = 5, and e = 1.0. After analyzing the data, these tools export the results into tables and images summarizing key bibliometric indicators, including the number of publications by year, total citations, average citations, countries and institutions, authors, journals, keywords, and references.
Results
Basic characteristics of the included literatures
As of November 06, 2024, a total of 4008 studies had been published, of which 680 were not “Articles” and “Review articles”. After excluding irrelevant studies by using the automatic screening function of the WOS database, a total of 3328 studies met the inclusion criteria. Moreover, the top cited 100 articles were extracted by sorting them in descending order according to their citation times (Figure 1).
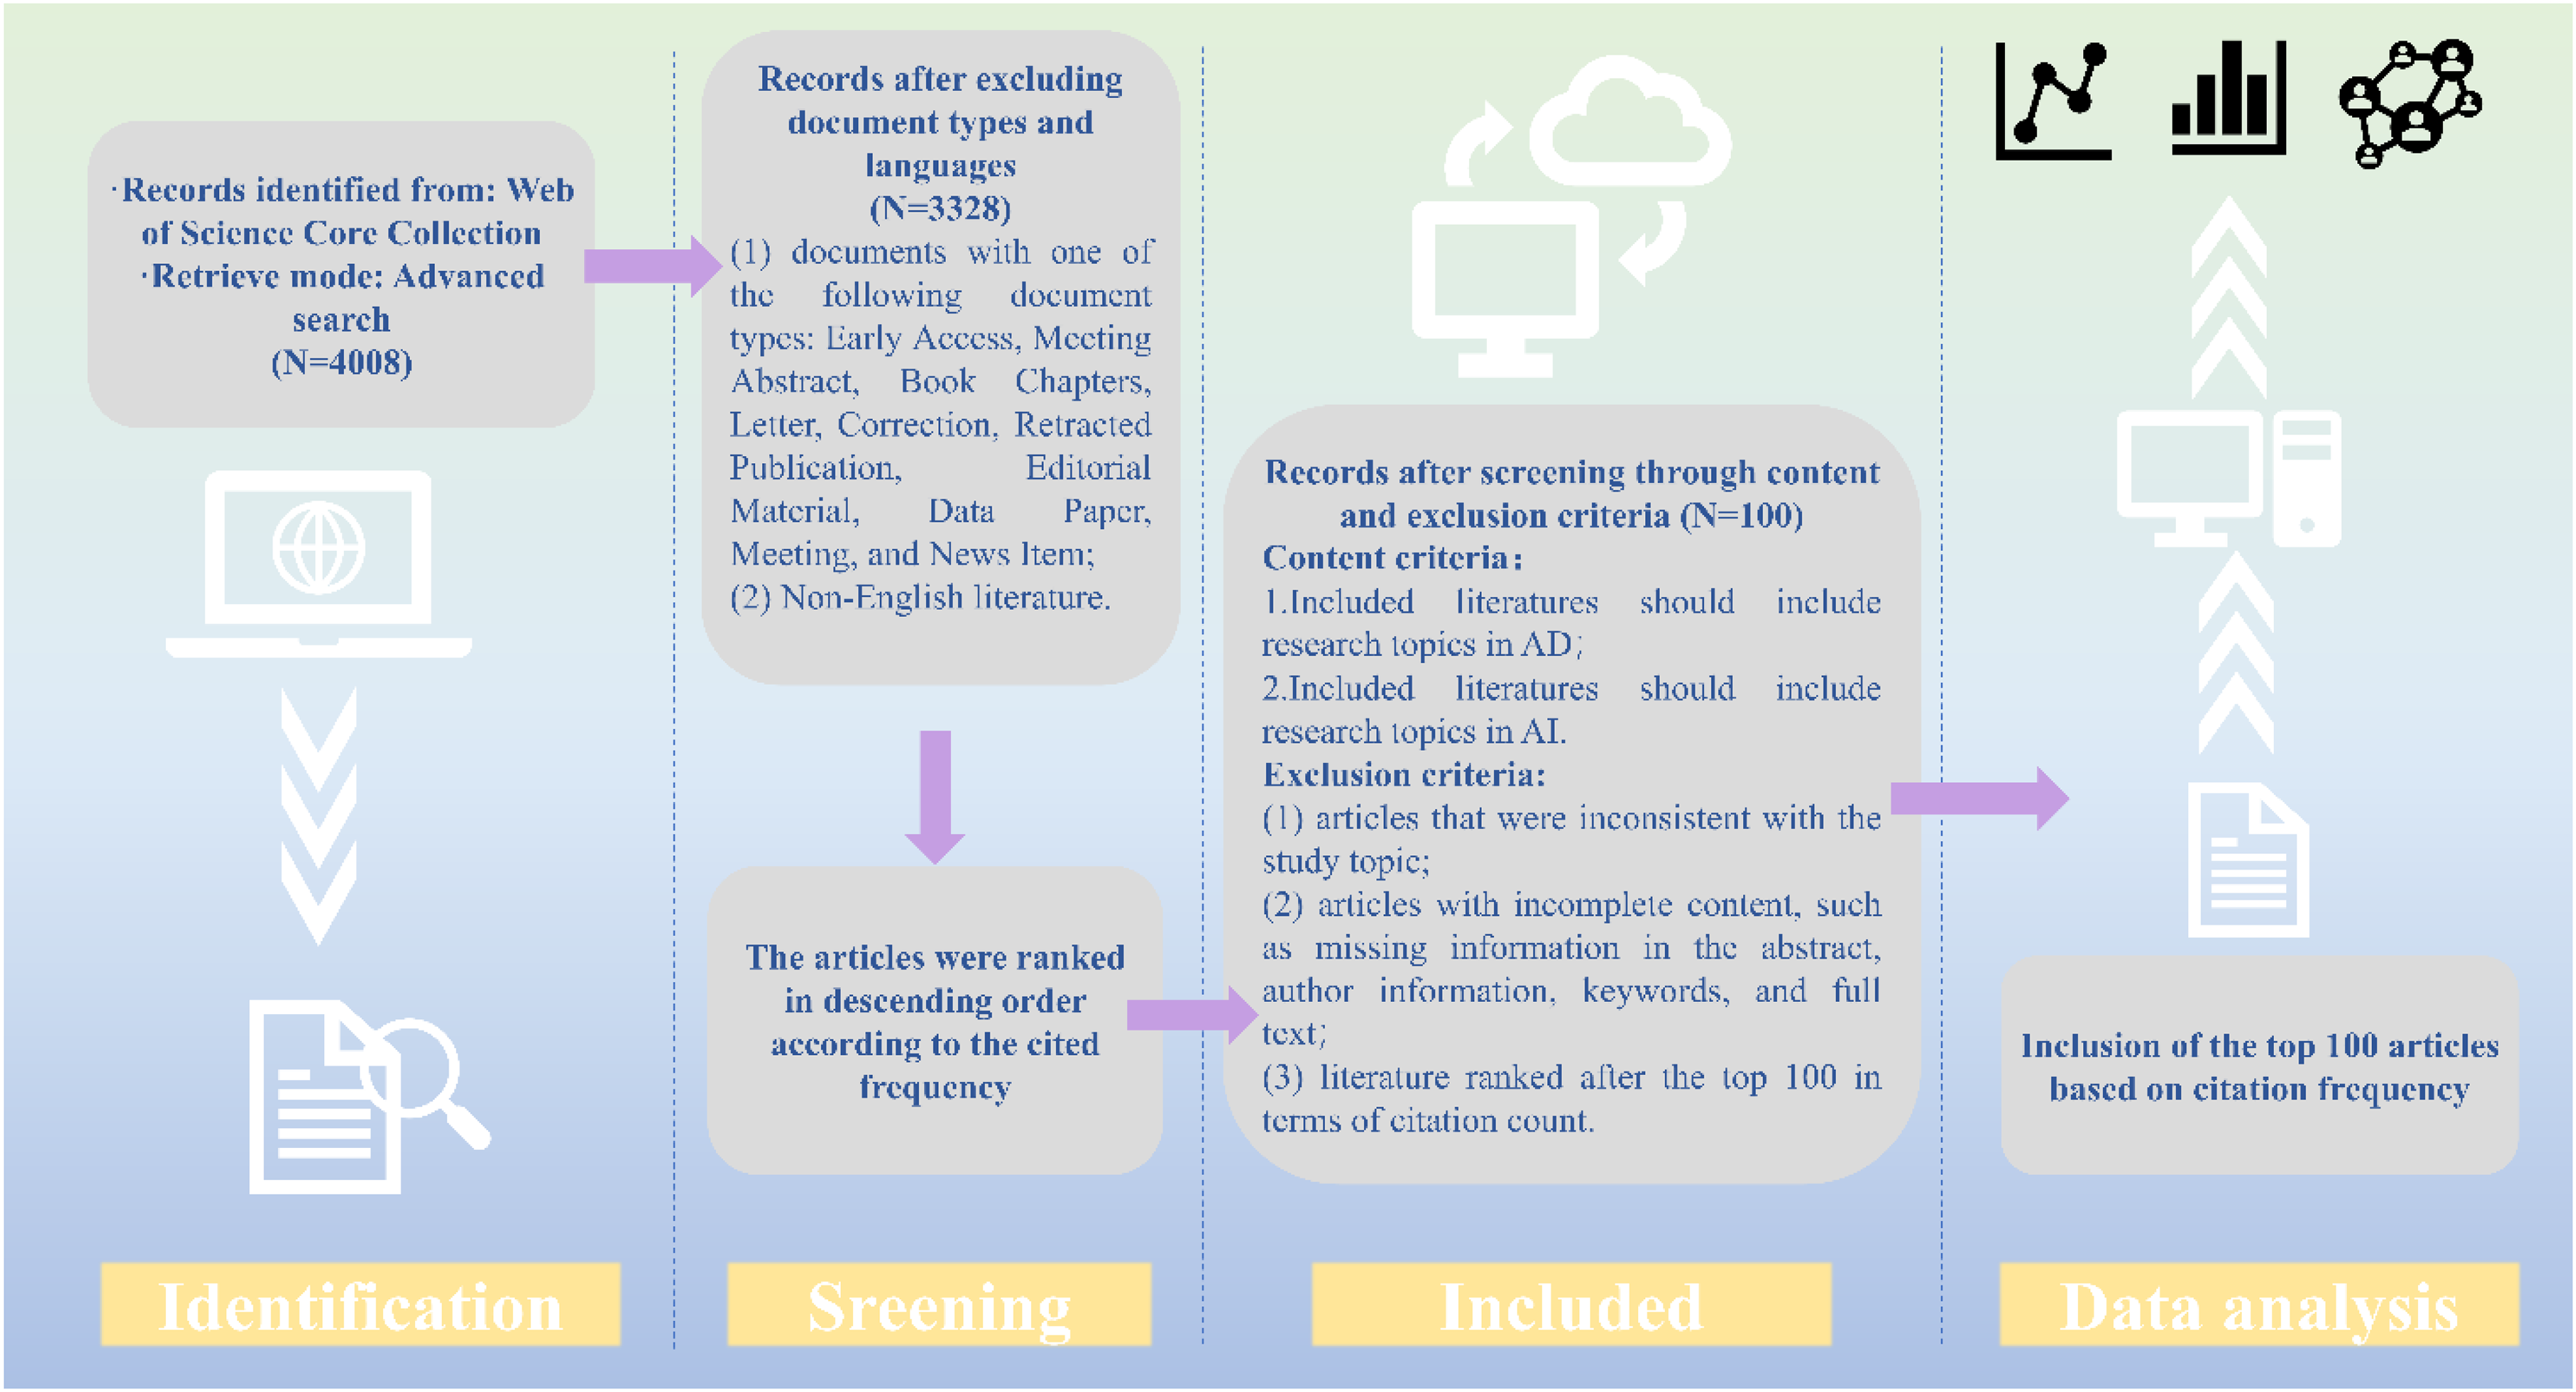
Flow chart of the literature screening process.
Supplemental Table S1 lists the top cited 100 articles from 2004–2022. The total number of citations was 22028, and the average number of citations per article was 220.28. Among them, the highest cited study was “Automatic classification of MR scans in Alzheimer's disease” (858 citations). This study found that support vector machines (SVMs) could be applied to structural MRI to reliably distinguish AD from normal aging on individual scans. 24 This was followed by “Hierarchical Feature Representation and Multimodal Fusion with Deep Learning for AD/MCI Diagnosis” (581 citations) and “Single Subject Prediction of Brain Disorders in Neuroimaging: Promises and Pitfalls” (578 citations), the former found that multimodal information from MRI and Positron emission tomography (PET) could be used to diagnose AD, its precursor stage and MCI. 25 The latter summarized the machine learning techniques used to diagnose AD/mild cognitive impairment (MCI) through literature review, such as SVM, J48 decision tree, Bayesian Gaussian process logistic regression, etc. 26 It is worth noting that from 2004–2022, the highest average number of citations occurred in 2015 (3415 citations), and during 2004–2022, the highest number of publications appeared in 2019 (N = 18). In addition, studies on AI-based AD diagnosis and prediction showed an overall upward trend in terms of citations and publications. Literature from specific years (e.g., 2015) was not only widely referenced upon publication but also maintained sustained scholarly engagement in subsequent years, indicating the enduring impact of its findings. Further exploration of such literature may yield novel insights (Figure 2).

Annual number of publications, citations, and average citations for AD diagnostic and predictive research based on AI.
Journal distribution analysis
The top cited 100 articles were distributed across 51 different journals, with the largest number of articles published in NEUROIMAGE (N = 16). This was followed by BRAIN (N = 5), FRONTIERS IN NEUROSCIENCE (N = 5), and SCIENTIFIC REPORTS (N = 5) (Figure 3(A)). Figure 3(B) presents the number of studies published by journals each year. NEUROCOMPUTING, NATURE COMMUNICATIONS, JOURNAL OF MEDICAL SYSTEMS, FRONTIERS IN NEUROSCIENCE, and SCIENTIFIC REPORTS were emerging journals in the field with relatively high publication volumes in recent years. Figure 3(C) shows leading and exemplary journals in this area of research. Among them, NEUROIMAGE had the highest citation frequency (N = 4777), so the literature in this journal was the most easily cited. Interestingly, PROTEIN ENGINEERING DESIGN & SELECTION had the highest average citations per article (N = 443) of the 51 journals, despite having only one study. (Note: In order not to affect the visualization of the picture, some journal names are not presented in Figure 3, and specific data can be retrieved in Supplemental Table)
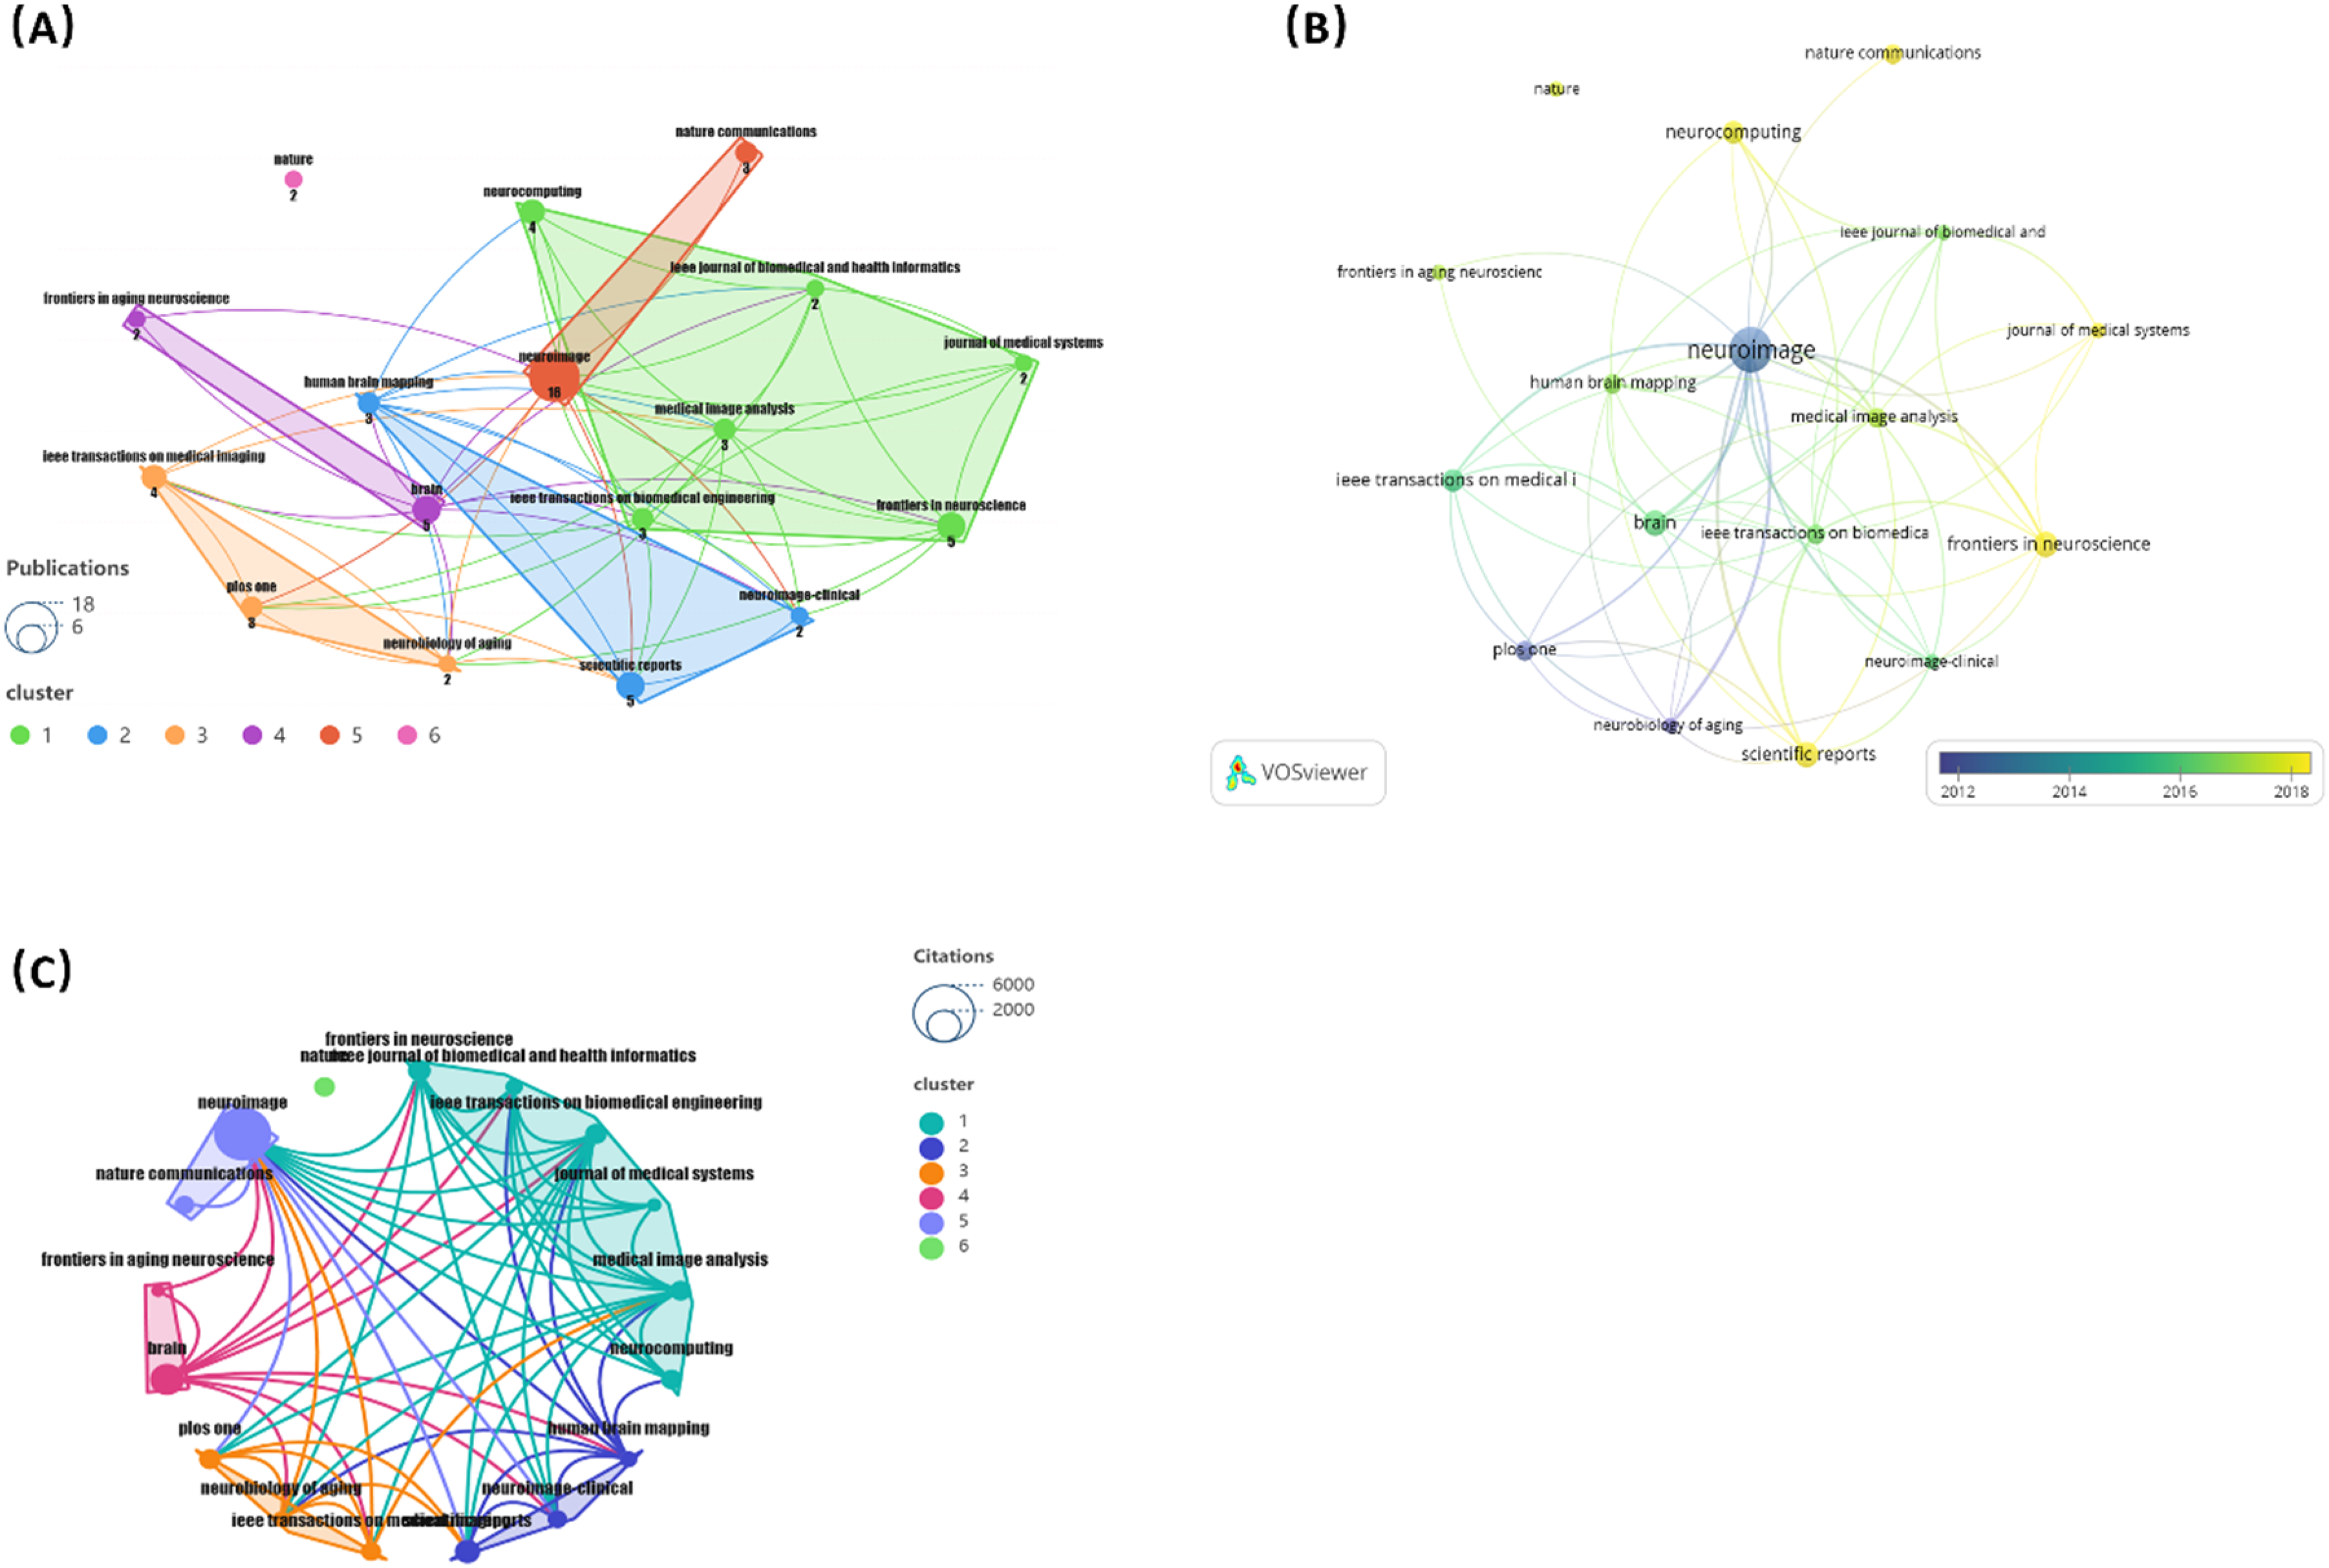
The visual analysis of the journal distribution in the top cited 100 articles. (A) publications number; (B) number of publications changing annually; (C) overall citation frequency.
In addition, in order to analyze the interaction and knowledge transmission mode between different journals, we used the function of Overlay Maps in CiteSpace software to overlay the dual maps of journals together, so as to explore the hidden disciplinary interaction relationship. The results showed four citation pathways, namely MOLECULAR, BIOLOGY, IMMUNOLOGY→MOLECULAR, BIOLOGY, GENETICS (z = 4.519232, f = 286), MOLECULAR, BIOLOGY, IMMUNOLOGY→PSYCHOLOGY, EDUCATION, SOCIAL (z = 2.5462718, f = 174), NEUROLOGY, SPORTS, OPHTHALMOLOGY→MOLECULAR, BIOLOGY, GENETICS (z = 3.3213632, f = 218), NEUROLOGY, SPORTS, OPHTHALMOLOGY→PSYCHOLOGY, EDUCATION, SOCIAL (z = 2.088263, f = 148). It revealed that the MOLECULAR/BIOLOGY/GENETICS citation source mainly was MOLECULAR/BIOLOGY/IMMUNOLOGY, PSYCHOLOGY/ /EDUCATION/SOCIAL citation source mainly was MOLECULAR/BIOLOGY/IMMUNOLOGY, which meant that these disciplines in the study of AD of diagnosis and prediction based on AI had important value. Future researchers should further study of these areas to promote the application of AI technology in AD diagnosis and prediction. This also indicates that diagnostic prediction under the AI-AD model is essentially an interdisciplinary subject that integrates biomedicine, technology, and the humanities and social sciences. However, this also reflects a certain issue of publication bias. It seems that journals related to biology, molecules and immunology are more likely to be cited, which may lead to the relatively marginalized publication of practical social application research (Figure 4).
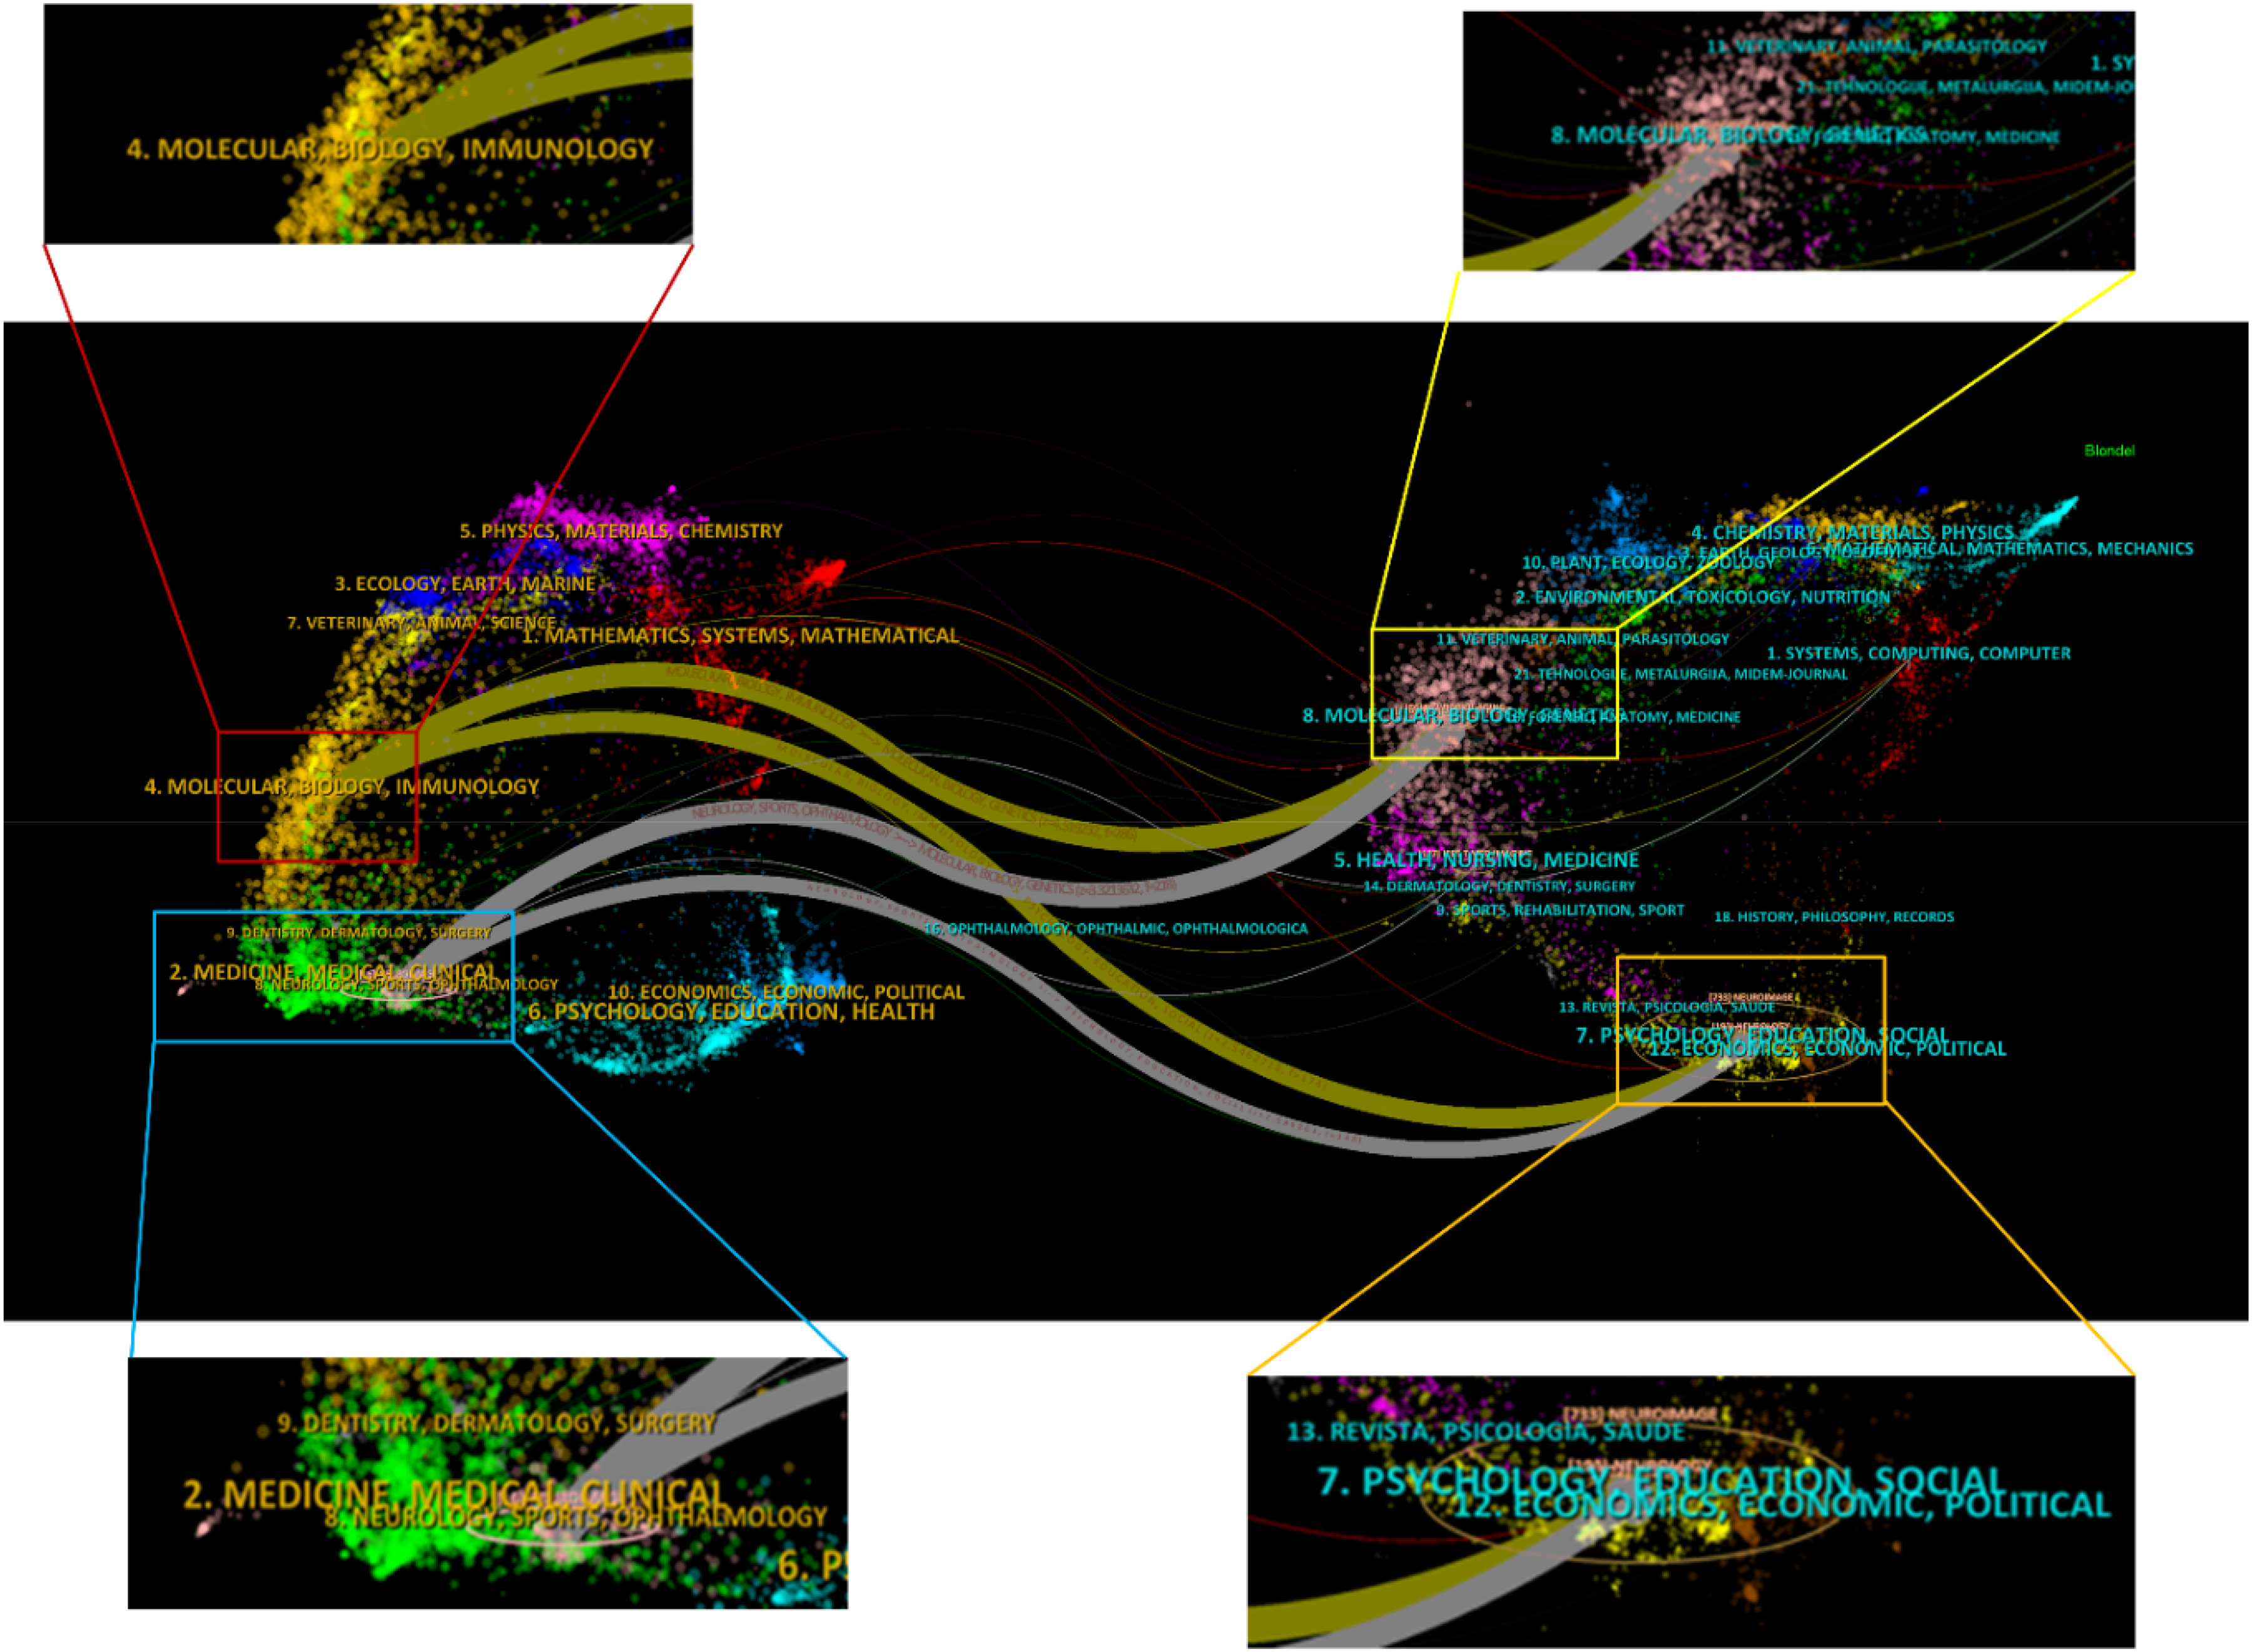
The research fields distribution of the top cited 100 articles.
Analysis of authors and co-authors
To avoid ambiguity caused by author abbreviations, we have adjusted the information of author abbreviations (e.g., modifying “Jack, CR” to “Jack, Clifford R., Jr.”). In the cluster network of authors represented by 4 colors, some people had carried out active research and field collaboration. We found that these 100 studies were written by a total of 613 authors from different institutions. Among them, Tong, Tong and Jack, Clifford R., Jr. had the most publications (N = 4), followed by Toga, Arthur w. and Chu, Carlton (N = 3) (Figure 5(A)). In terms of frequency of citations, the study by Jack, Clifford R., Jr. was cited most frequently (N = 1535), followed by Chu, Carlton (N = 1300), Ashburner, John (N = 1054), Frackowiak, Richard S.J. (N = 1054), Kloeppel, Stefan (N = 1054), and Stonnington, Cynthia M. (N = 1054), and finally Fox, Nick C., and Rohrer, Jonathan D. (N = 1006), and interestingly, these researchers comprised the most cited clustering network (Figure 5(B)). Qinquan Gao and Cristina Legido-quigley are emerging authors in the field (Figure 5(C)). Figure 5(D) presents the intensity of collaboration between the different authors. Although the research of multiple co-authors has been widely cited and there is close connection among different co-authors, it should be noted that the application of AI in the prediction and diagnosis of AD is still in the research stage and requires further verification and clinical application. Furthermore, combining them with other clinical features and examination results for comprehensive analysis can be more accurately used to evaluate the strategies of AI for individualized diagnosis and prediction of AD.

The visual analysis of the authors of the top cited 100 articles. (A) publications number; (B) number of publications changing annually; (C) overall citation frequency; (D) total relevance strength.
Country and institution analysis
Country
We analyzed counting publications and citations per country using VOS Viewer 1.6.19 and Scimago Graphica 1.0.39. The top cited 100 articles were written by authors from 31 countries. Researchers from the United States contributed the most to the field (N = 59), followed by China (N = 30) and the United Kingdom (N = 24) (Figure 6(A)).The cumulative number of articles from different countries and regions over the years was presented in Figure 6(B). Of these 34 countries, the United States had the most cited studies (N = 14230), followed by China (N = 6354) and the United Kingdom (N = 5285) (Figure 6(C)). The above data suggested that the United States has made significant progress in the area of AD prediction and diagnosis based on AI technology. These 31 countries were mainly divided into seven clustered networks, of which the United States had the widest coverage of co-operative networks, with co-operation with 25 other countries, followed by the United Kingdom, with co-operation with 21 other countries. The bibliometrics-based world map could visualise the co-operation between countries, and the thickness of the connecting lines between the countries indicated the intensity of co-operation between different countries (Figure 6(D)). Through countries analysis, it is found that the United States has three-dimensional advantages in the number of papers, citation volume and cooperation network in the field of AI-assisted prediction and diagnosis of AD.

Cocitation network analysis of countries and regions in the top cited 100 articles. (A) publications number; (B) number of publications changing annually; (C) overall citation frequency; (D) total relevance.
Institution
A total of 289 institutions were involved in the literatures of the top cited 100 articles. Among them, we conducted a literature cluster analysis on 22 institutions with more published studies and more citations, involving 6 subgroups. The University of North Carolina had the highest number of published articles (N = 12), followed by Korea University (N = 11) and the University of Pennsylvania (N = 7) (Figure 7(A)). In addition, in recent years, more institutions had studied the use of AI to diagnose and predict AD, such as Shanghai Jiao Tong University, Chinese Academy of Sciences, Xiamen University, Fuzhou University, Johns Hopkins University, and Imperial College London (Figure 7(B)). In terms of citations of institutions, the University of North Carolina had the most citations (N = 3096). This was followed by Korea University (N = 2604) and University College London (N = 1805) (Figure 7(C)). Figure 7(D) shows the total link strength among institutions. The major institutions were mainly from the United Kingdom, which indicated that the United Kingdom may be the research center of AI-based diagnosis and prediction of AD.

Cocitation network analysis of institutions with the top cited 100 articles. (A) publications number; (B) number of publications changing annually; (C) overall citation frequency; (D) total relevance.
Research focus
The study with the top cited 100 articles frequency included 294 keywords, “alzheimers disease” (N = 58) and “mild cognitive impairment” (N = 50) being one of the most common keywords, followed by classification (N = 26). “MRI” (N = 21), “deep learning” (N = 19), “diagnosis” (N = 17), “dementia” (N = 16), “biomarkers” (N = 14), “brain atrophy” (N = 13), “machine learning” (N = 13), “voxel based morphometry” (N = 12), “prediction” (N = 11), and “patterns” (N = 11). The centrality of these high-frequency keywords: “Alzheimers disease” (N = 0.18), “mild cognitive impairment” (N = 0.11), “classification” (N = 0.13), “MRI” (N = 0.08), “deep learning” (N = 0.08), “diagnosis” (N = 0.12), “dementia” (N = 0.21), “biomarkers” (N = 0.19), “brain atrophy” (N = 0.11), “machine learning” (N = 0.13), “voxel based morphometry” (N = 0.14), “prediction” (N = 0.1), and “patterns” (N = 0.06) (Figure 8(A) and Table 1). As a branch of AI technology, deep learning could compare and analyze brain structure MRI and normal brain aging trajectory of patients of different ages, so as to build prediction and diagnosis models for AD and MCI. 27 In addition, these keywords could be analyzed according to different topics. The resulting clustering profiles would be considered meaningful when modularity (Q) > 0.3 and weighted mean silhouette (S) > 0.5. According to the research results (Q = 0.6426, S = 0.8732), it can be seen that the cluster graph drawn based on this study has high reliability. To better illustrate the research hotspots in this field, clustering analysis of keywords was conducted based on keyword co-occurrence using the Log-Likelihood Ratio method. The clusters could be divided into the following groups: #0 mri; #1 deep learning; #2 brain ageing; #3 Alzheimers disease; #4 machine learning; #5 bibliometric analysis; #6 alff; #7 surface modeling; #8 neurons; #9 neurodegeneration. Among them, green, orange and light blue mainly involve the main algorithms in the field of AI, while yellow, purple, light green and blue focus on the lesion process or location related to AD (Figure 8(B)).

Network visualization, cluster analysis, timeline mapping, and burst analysis of keywords in the top cited 100 articles. (A) keywords co-occurrence; (B) keywords clustering; (C) timeline mapping of keywords.; (D) burst analysis of keywords ranked by citation burst intensity.
Top 13 co-occurring keywords found in the top cited 100 articles.
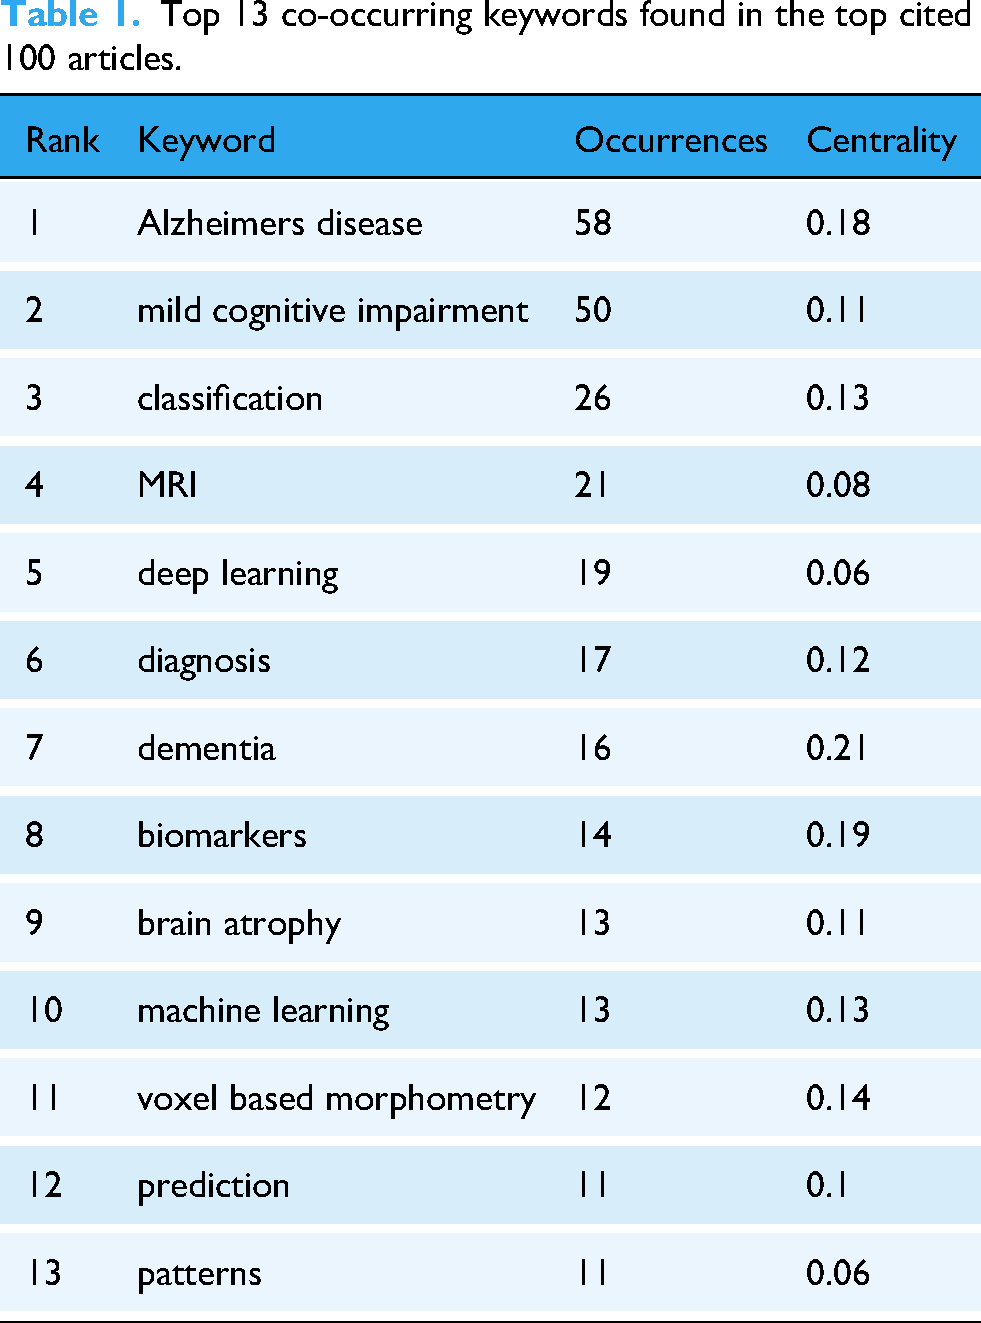
Figure 8(C) and (D) illustrates the change trend of keywords over time. Since 2008, there had been a surge in research on AI-based diagnosis and prediction of AD, and between 2008 and 2020, research on AI-based diagnosis of AD was closely related to “MRI”, “deep learning”, “brain ageing”, “brain ageing”, and “machine learning” were closely related and continuous. Studies on “surface modeling” and “neurons” started late and were relatively small in number, so they may be at an emerging stage. From 2008 to 2015, some key keywords, such as “support vector machine”, “atrophy”, “dimensional pattern classification”, “FDG pet”, “patterns”, “MCI”, and “MRI” reflected the rise of AI technology in the field of diagnosis and prediction of AD, and in 2016–2022, some keywords such as “prediction”, “deep learning”, “conversion”, “association workgroups”, “structural MRI”, “neural network” reflected the gradual exploration of innovation in the field, which may be the integration of multiple modes of AI technology as the main diagnostic and prediction means. For example, a study demonstrated that the integration of three neural network models, ResNet50, RESNET50-DC and MPC-STANet, would greatly improve the accuracy of AD recognition. 28
Co-citation analysis of references
Co-citation analysis of articles refers to a method to reveal the correlation between documents by detecting other articles that cite the same reference, and is an important parameter of document metrology. 20 A literature co-citation analysis of studies on the diagnosis and prediction of AD based on AI technology can help us understand the latest research progress and main research directions in this field. Therefore, we used CiteSpace software for reference co-citation analysis. Figure 9 shows the most frequently cited references in studies related to diagnosis and prediction of AD based on AI technology. Table 2 presents the top 25 most popular references. Through the literature co-citation analysis, we found that the research on diagnosis and prediction of AD based on AI technology could be roughly divided into three stages: Before 2011, some computer algorithms, such as vector machines, were mainly used to identify AD by analyzing clinical data such as MRI and CSF; From 2011 to 2014, machine learning and deep learning algorithms were widely developed by researchers and gradually used in the identification and prediction of AD and MCI; From 2014 to the present, several multi-modal AI prediction models have been emerging, such as convolutional neural networks, which are more accurate in the early diagnosis and prediction of AD.
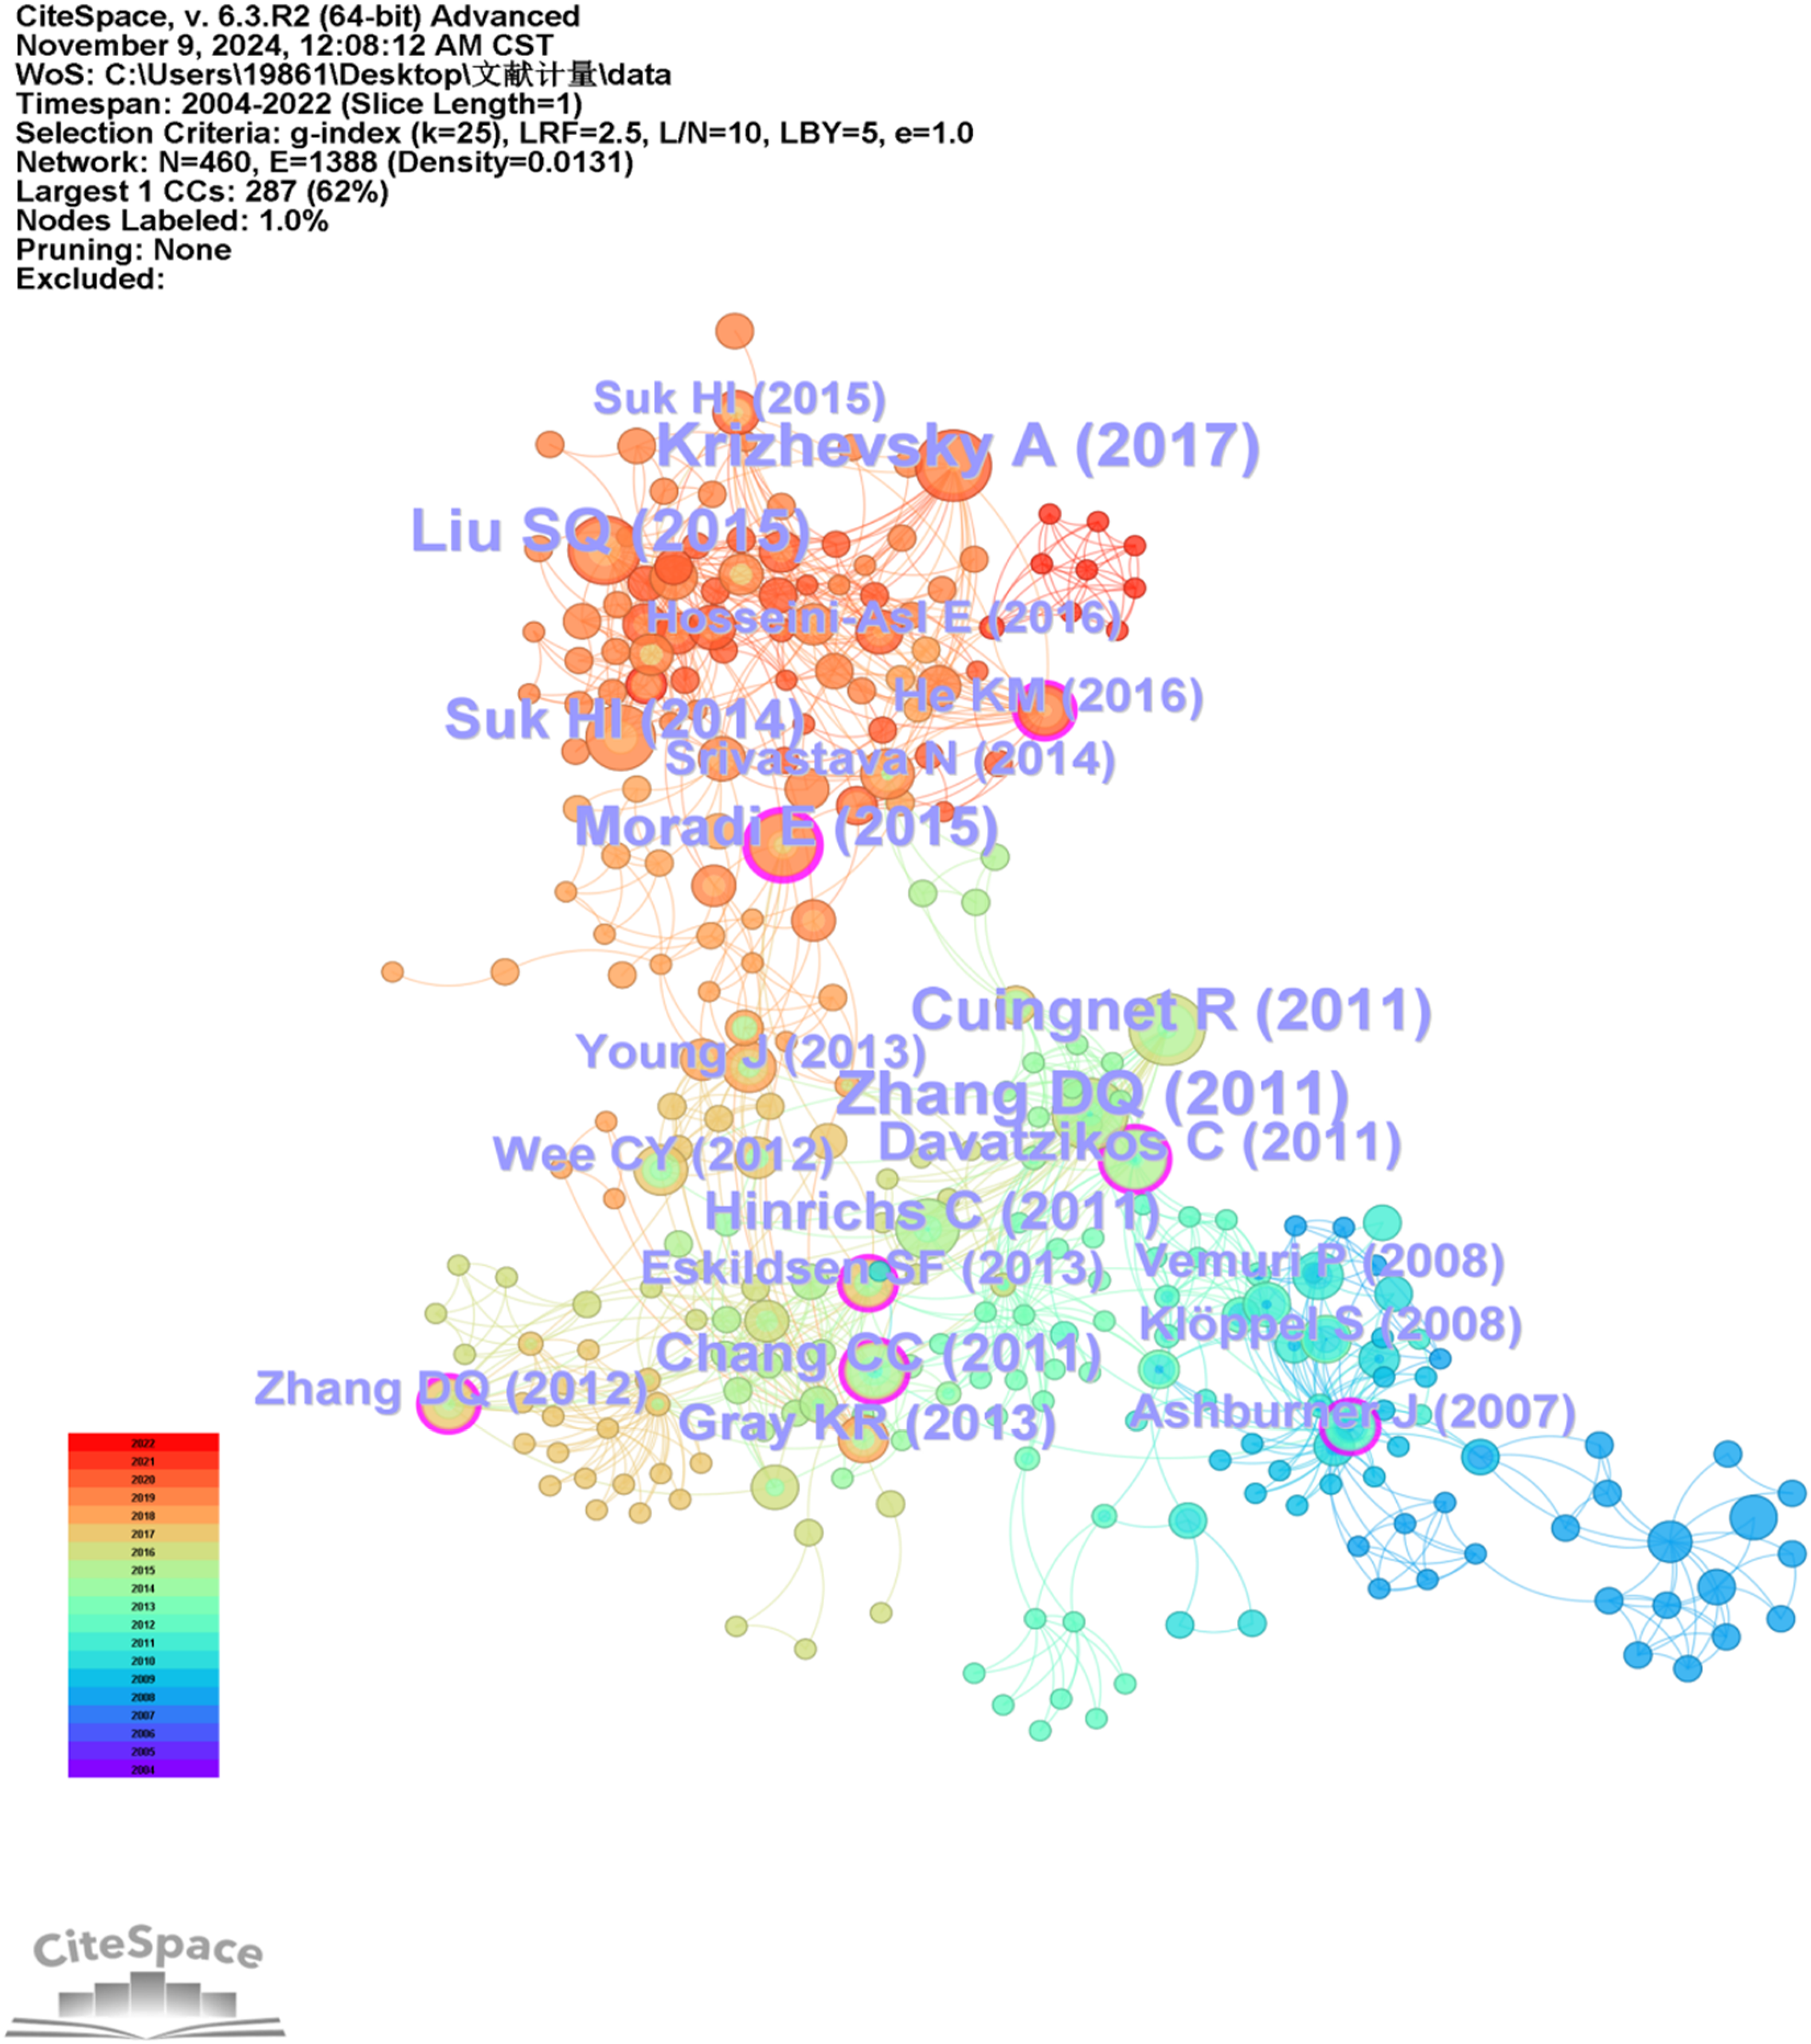
Co-citation visualization analysis of the top cited 100 articles.
The top cited 25 references.

Limitations
This study was the first to conduct a bibliometric analysis of studies on the diagnosis and prediction of AD based on AI technology. It should be noted that this method has certain limitations. Although WoSCC is one of the most commonly used academic search databases, it does not search all publications. In order to ensure the comprehensiveness of the analysis content of this study, we used topic keywords to search, but there were still some limitations. On one hand, the literatures included in this study were all in English, which had a large language selection bias. On the other hand, because this study focused on the top cited 100 articles, it tended to ignore the most recent published studies on AI techniques for diagnosing and predicting AD. In addition, outliers such as a single highly cited article can skew averages. Finally, due to the limitations of data and methodology, this study was unable to assess the specific impact of senior author migration on institutional research output. It is suggested that future research can explore it to obtain a more comprehensive analytical perspective.
Discussion
Bibliometrics reveals the laws of scientific knowledge by quantifying the external characteristics of literature (such as authors, institutions, keywords, citations, etc.) and using mathematical and statistical methods. Its advantage lies in providing objective quantitative evidence, efficiently grasping the development trend, research hotspots and knowledge structure of the discipline from a macro perspective, identifying core authors, journals, literature and institutions, and assisting in predicting emerging fields, far exceeding the efficiency of manual reviews. 29 In addition, the analysis of the most frequently cited literature in the field of evaluation medicine could provide valuable insights for future research development. 30 Thus, this study used bibliometrics and visual analysis tools to survey the top cited 100 articles, with the aim of exploring research hotspots and trends in AI-based AD diagnosis and prediction.
The results showed that between 2004 and 2022, the number of publications on AI diagnosis and prediction of AD is generally on the rise. This trend was not unique to AD and could be observed in almost all AI studies in medical contexts. 31 The author with the highest number of publications was Tong, Tong and Jack, Clifford R., Jr.. The author with the highest number of citations was Jack, Clifford R., Jr.. Their research results seemed to have great influence and had made certain contributions to the field. In addition, we find differences in collaboration between different countries, institutions, and authors, which could lead to the “AI divide” - the gap in access to, use of, and attention to AI technologies worldwide - and which may be widening. 32 The reasons may involve factors such as economics, computer power, and research facility gaps. 31
In addition, we presented the most frequently used keywords in recent years through CiteSpace, VOSviewer co-occurrence analysis: “alzheimers disease”, “mild cognitive impairment”, “classification”, “MRI”, “deep learning”, “diagnosis”, “dementia”, “biomarkers”, “brain atrophy”, “machine learning”, “voxel based morphometry”, “prediction”, and “patterns”. It could be seen that with the deepening of research on diagnosis and prediction of AD based AI, some AI techniques, such as deep learning techniques, can be used to solve complex problems according to the computer algorithms of their neural networks. For example, in functional MRI (fMRI) studies, deep learning models could automatically classify images by detecting patterns in brain scans of subjects. 33 Nevertheless, for MRI deep learning models to be clinically useful, they must be able to combine other AD markers to perform multivariate classification of different stages of AD, thus achieving early prediction and diagnosis of AD. 34 In addition, through keyword cluster analysis, we found that keywords are mainly divided into the following groups: #0, mri; #1 deep learning; #2 brain ageing; #3 alzheimers disease; #4 machine learning; #5 bibliometric analysis; #6 alff; #7 surface modeling; #8 neurons; #9 neurodegeneration. It can be seen that there was now a trend in research to use brain imaging in the context of AI to predict and diagnose AD, however, it had been found that more than a third of healthy individuals over the age of 65 years with moderate to high levels of Aβ degeneration were at a higher risk of developing AD. 35 Therefore, in future studies, imaging of biomarkers of AD pathology (e.g., Aβ-based positron emission tomography (PET)) in combination with imaging of biomarkers of neuronal injury (e.g., MRI and FDG-PET) could compensate for the inadequacy of the diagnostic and prognostic models of AD resulting from the lack of modal data and may have wider clinical availability.
However, this bibliometrics has certain limitations: (1) Only using the WOS database poses a risk of literature omission and only including English literature, resulting in language bias; (2) Focus on highly cited literature and may overlook the latest research; (3) Due to the limitations of data methods, the impact of senior author mobility on institutional output could not be evaluated. It is suggested that future research explore this point to improve the analytical perspective.
Conclusion and outlook
Citation count is one of the core indicators for measuring academic influence, reflecting the extent to which research results are recognized and utilized by peers. Highly cited papers are widely regarded as significant, foundational or cutting-edge research achievements in their fields. After retrieval, it was found that the top 100 citations of the literature all belong to highly cited literature. This bibliometric analysis included the top 100 citations of the literature, aiming to accurately capture the most core and influential progress in this research field. The results showed that in terms of publications, the largest number of relevant studies were published in NEUROIMAGE; in terms of authors, Tong, Tong and Jack, Clifford R., Jr. had the largest number of publications; and in terms of countries and institutions, the largest number of contributions came from researchers in the United States, as well as from China, the United Kingdom, and other large economies, with the most publications coming from the University of North Carolina. With the development of medical AI, the diagnosis and prediction of AD in the context of AI have achieved some valuable results. In recent years, a variety of AI algorithms, such as deep learning and machine learning, have been used to predict and diagnose AD.
While AI-driven approaches have demonstrated promising capabilities in AD prediction and diagnosis—utilizing deep learning, machine learning, and neuroimaging integration (e.g., MRI)—significant challenges remain for clinical translation. Current models face limitations in generalizability due to inconsistent data quality, small cohort sizes, and demographic biases in training datasets. To concretely advance AD research and clinical practice, future work must prioritize: (a) Validating AI biomarkers for early AD pathological detection through multi-center, longitudinal trials; (b) Developing accessible AI tools for primary care settings to enable low-cost and personalized screening. In addition, we specifically call for: Comparative studies of AI versus traditional diagnostic pathways of AD. These actionable steps are critical for translating algorithmic innovations into tangible patient benefits.
Supplemental Material
sj-docx-1-dhj-10.1177_20552076251362098 - Supplemental material for Emerging trends in Alzheimer's disease diagnosis and prediction using artificial intelligence: A bibliometric analysis of the top cited 100 articles
Supplemental material, sj-docx-1-dhj-10.1177_20552076251362098 for Emerging trends in Alzheimer's disease diagnosis and prediction using artificial intelligence: A bibliometric analysis of the top cited 100 articles by Guangheng Zhang, Weijie Zhao, Shimeng Lv, Ziyue Wang, Yunhao Yi, Haoteng Ma, Yitong Lu, Wei Yan and Jing Teng in DIGITAL HEALTH
Supplemental Material
sj-docx-2-dhj-10.1177_20552076251362098 - Supplemental material for Emerging trends in Alzheimer's disease diagnosis and prediction using artificial intelligence: A bibliometric analysis of the top cited 100 articles
Supplemental material, sj-docx-2-dhj-10.1177_20552076251362098 for Emerging trends in Alzheimer's disease diagnosis and prediction using artificial intelligence: A bibliometric analysis of the top cited 100 articles by Guangheng Zhang, Weijie Zhao, Shimeng Lv, Ziyue Wang, Yunhao Yi, Haoteng Ma, Yitong Lu, Wei Yan and Jing Teng in DIGITAL HEALTH
Footnotes
Acknowledgements
This bibliometric study is very grateful for the help of co-author Weijie Zhao, who played a key role in the data analysis of this study.
Ethical approval
Because this study did not involve humans or animals, and the underlying data were obtained from public databases, ethical approvals and informed consent were not required.
Author contributions
GH was responsible for data collection and initial manuscript drafting. WZ, SL, YY, and YL contributed to data analysis and visualization. ZW and HM assisted with the literature review and interpretation of the results. JT and WY contributed to the conception and design of the study and provided critical revisions to the manuscript. All authors reviewed and approved the final manuscript.
Funding
The authors disclosed receipt of the following financial support for the research, authorship, and/or publication of this article: This study was supported by The seventh batch of national Traditional Chinese Medicine experts academic experience inheritance project (approval number: National Traditional Chinese Medicine Education Letter [2022] No.76).
Declaration of conflict of interest
The authors declared no potential conflicts of interest with respect to the research, authorship, and/or publication of this article.
Guarantor
Wei Yan, e-mail addresses: 71002051@sdutcm.edu.cn
Jing Teng, e-mail addresses: 60170099@sdutcm.edu.cn
Supplemental material
Supplemental material for this article is available online.
References
Supplementary Material
Please find the following supplemental material available below.
For Open Access articles published under a Creative Commons License, all supplemental material carries the same license as the article it is associated with.
For non-Open Access articles published, all supplemental material carries a non-exclusive license, and permission requests for re-use of supplemental material or any part of supplemental material shall be sent directly to the copyright owner as specified in the copyright notice associated with the article.