
Abstract
Introduction
The progression of Alzheimer's disease (AD) has been shown to significantly correlate with changes in brain tissue structure and leads to cognitive decline and dementia. Using radiomic features derived from brain magnetic resonance imaging (MRI) scan, we can get the help of deep learning (DL) model for diagnosing AD.
Methods
This study proposes the use of the DL model under the framework of MR radiomics for AD diagnosis. Two cross-racial independent cohorts from the Alzheimer's Disease Neuroimaging Initiative (ADNI) database (141 AD, 166 Mild Cognitive Impairment (MCI), and 231 normal control (NC) subjects) and Huashan hospital (45 AD, 35 MCI, and 31 NC subjects) were enrolled. We first performed preprocessing of MRI using methods such as spatial normalization and denoizing filtering. Next, we conducted Statistical Parametric Mapping analysis based on a two-sample t-test to identify regions of interest and extracted radiomic features using Radiomics tools. Subsequently, feature selection was carried out using the Least Absolute Shrinkage and Selection Operator model. Finally, the selected radiomic features were used to implement the AD diagnosis task with the TabNet model.
Results
The model was quantitatively evaluated using the average values obtained from five-fold cross-validation. In the three-way classification task, the model achieved classification average area under the curve (AUC) of 0.8728 and average accuracy (ACC) of 0.7111 for AD versus MCI versus NC. For the binary classification task, the average AUC values were 0.8778, 0.8864, and 0.9506 for AD versus MCI, MCI versus NC, and AD versus NC, respectively, with average ACC of 0.8667, 0.8556, and 0.9222 for these comparisons.
Conclusions
The proposed model exhibited excellent performance in the AD diagnosis task, accurately distinguishing different stages of AD. This confirms the value of MR DL radiomic model for AD diagnosis.
Introduction
Alzheimer's disease (AD) is a common neurodegenerative disorder characterized by chronic, progressive memory decline and cognitive impairment. It is one of the most serious diseases affecting the elderly population. 1 The progression of AD is gradual, making early-stage diagnosis particularly challenging due to the absence of specific diagnostic markers, which often leads to its symptoms being mistaken for those of natural aging. Early identification and accurate diagnosis of prodromal AD are essential for clinical decision making and the development of future treatments.
Structural magnetic resonance imaging (sMRI), as a noninvasive imaging technique, provides excellent characterization of brain tissue structure and anatomical details.2,3 Three-dimensional T1-weighted imaging (3D T1WI) provides detailed brain morphological features, such as cortical thickness and hippocampal volume, which are essential for detecting early atrophy and other morphological changes associated with AD. 3D T1WI offers advantages such as high image resolution, short scanning time, and high signal-to-noise ratio. Additionally, 3D T1WI is well-suited for extracting tissue structure and performing brain structural analysis based on gray and white matter features. The cortical changes in specific brain regions, as revealed by 3D T1WI data, serve as important references for the conversion from Mild Cognitive Impairment (MCI) to AD. 4 Studies have shown that structural changes in areas such as the entorhinal cortex and hippocampus exhibit high sensitivity and specificity in predicting the progression of AD. 5 Significant atrophy in brain regions such as the parahippocampal gyrus, amygdala, and prefrontal cortex occurs as early as the MCI stage, and 3D T1WI data can be used to assess the extent of cortical changes in these regions, thereby evaluating disease progression.
Radiomics, an image analysis method that extracts more microscopic information from imaging data, has been proposed. By converting intuitive imaging data into analyzable, high-throughput features, these quantitative characteristics can describe the heterogeneity of related diseases. 6 Radiomics technology provides quantitative information including first-order, shape, and texture from images.7–9 First-order features: These features were derived by analyzing the histogram of voxel intensities within the region of interest (ROI). Key statistical metrics included mean, standard deviation, skewness, and kurtosis, which describe the overall distribution of grayscale values. 10 Texture features: Texture features were computed using the gray-level co-occurrence matrix (GLCM) and the gray-level difference matrix (GLDM). The GLCM was constructed by calculating the frequency of voxel pairs with specific intensity values at a given spatial offset. From the GLCM, features such as contrast, homogeneity, energy, and entropy were derived to characterize image properties like roughness and smoothness. Similarly, the GLDM was used to compute features based on the absolute differences in intensity levels between neighboring voxels. Shape features: These features described the geometric properties of brain structures, including volume, surface area, and surface smoothness. 6 These metrics were particularly useful for capturing morphological changes associated with AD. The radiomics technology primarily involves designing automated feature extraction algorithms that extract microscopic information from standardized images for subsequent feature analysis. The radiomics framework typically includes the following steps: (1) data acquisition and preprocessing; (2) segmentation of ROI; (3) feature extraction from specific regions; (4) feature selection; and (5) model validation. By deeply mining MR radiomic information, the traditional interpretation of clinical imaging can shift from subjective evaluation to quantitative analysis, supporting prognosis assessment, multimodal information fusion, and correlation analysis.
In recent years, the development of artificial intelligence, particularly deep learning (DL), has provided new approaches for medical image analysis and the extraction of highly sensitive features to aid in the diagnosis of AD. Convolutional Neural Networks (CNNs) and other DL models have been successfully applied to MRI to identify subtle structural changes associated with AD. 11 These models can automatically learn complex, hierarchical features from raw image data, significantly improving in both efficiency and accuracy compared to traditional manual feature extraction methods. 12 Integrating radiomic features into DL frameworks further enhances the predictive power of these models. Chaddad et al. 13 constructed a CNN model to extract MR radiomic features from brain regions for AD versus normal control (NC) classification, achieving a classification area under the curve (AUC) of 92.58% and an accuracy (ACC) of 84.45%. Feng et al. 14 used the Least Absolute Shrinkage and Selection Operator (LASSO) model to select radiomic features from 3D T1WI images and then built a logistic regression model for the AD versus NC classification task, achieving an AUC of 0.72 and an ACC of 0.68. Chen et al. 15 used logistic regression to extract hippocampal positron emission tomography (PET) and MR radiomic features, demonstrating good diagnostic performance with an AUC of 86.00% and ACC of 80.60% in the MCI versus NC classification task. Leandrou et al. 16 constructed a trained and integrated XGBoost ensemble model using MR radiomic features from the entorhinal cortex and hippocampus for AD classification, achieving an F1 score of 0.95 for AD versus NC.
Radiomic features including various quantitative measures such as texture, shape, and intensity changes extracted from medical images, provide a comprehensive representation of potential pathology. However, radiomic features are often high-dimensional and heterogeneous, posing challenges for traditional machine learning (ML) models in terms of feature selection and interpretability. TabNet, a DL architecture specifically designed for tabular data, leverages an attention mechanism to selectively focus on the most relevant features while ignoring noise or redundant information. This makes it particularly well-suited for handling radiomic features, which typically consist of numerous interrelated variables with varying degrees of importance. By automatically identifying and prioritizing key radiomic features, TabNet not only improves classification performance but also enhances model interpretability, enabling clinicians to better understand the underlying pathological mechanisms of AD. Park et al. 17 utilized the TabNet and XGBoost models in combination with radiomic features extracted from 3D T1WI data, achieving a classification AUC of up to 0.951 for AD vs NC. By combining the strengths of ML and radiomics, researchers have developed powerful models capable of distinguishing between NC, MCI, and diagnosed AD patients. Cheung et al. 18 extracted 107 radiomic features from brain MRI data obtained from two publicly available datasets and employed classical ML models for AD classification, achieving a maximum classification ACC of 76.57%. Yang et al. 19 focused on extracting radiomic features from the hippocampus and parahippocampal gyrus regions of brain MRI. Using ML models for AD versus NC classification, they achieved an AUC of 0.954. Feng et al. 20 extracted radiomic features from the left and right hippocampal regions of brain MRI and applied logistic regression for the classification of amnestic MCI (aMCI), achieving a maximum AUC of 0.79. Du et al. 21 developed and validated radiomic classification models for late-onset AA (LOAD) versus young controls (YC), LOAD versus old controls (OC), and early-onset Alzheimer's disease (EOAD) versus LOAD. The models achieved AUCs of 0.91, 0.78, and 0.86, respectively, in the validation set. Liu et al. 22 selected 80 cases each of AD and NC, extracting radiomic features from whole-brain 3D T1WI, and achieved a maximum classification ACC of 0.962. Zhou et al. 23 employed the U2-Net model for hippocampal segmentation and radiomic feature extraction, achieving a classification AUC of 0.97 using ML models for AD versus NC. Feng et al. 24 extracted 3360 radiomic features from amygdala MRI and combined them with logistic regression, achieving a maximum classification AUC of 0.93 for AD versus NC. Peng et al. 25 selected 341 patients with MCI and divided them into two groups based on whether they progressed to AD within 8 years. Using radiomic features extracted from brain PET images and an Support Vector Machine (SVM) model, they achieved a maximum classification AUC of 0.865. These models not only enhance the accuracy of AD diagnosis but also show potential for detecting changes in imaging features as the disease progresses, which is crucial for timely intervention and management. Using DL models to automate the diagnostic process also enhances the standardization and reproducibility of results, reducing dependence on subjective interpretation and providing clinicians with a more consistent diagnostic tool.
This study aimed to develop a MR-based DL radiomics model for the classification of AD by integrating multiscale radiomic feature extraction with a TabNet architecture. Specifically, 3D-T1WI data were preprocessed to identify brain regions exhibiting significant differences across AD stages. Radiomic features were subsequently extracted, optimized through rigorous feature selection, and fed into the TabNet model, which is renowned for its interpretability and efficiency in handling high-dimensional data. The novelty of our approach lies in the seamless combination of radiomic feature extraction, advanced feature selection techniques, and the utilization of TabNet, which enhances both predictive performance and interpretability in AD diagnosis. Our findings demonstrate that this integrated framework achieves superior performance across various classification tasks, distinguishing between different AD stages with high accuracy. This work is expected to contribute significantly to the early detection of AD, providing clinicians with a robust tool to support timely and informed decision making in clinical practice.
Material and methods
Enrolled participants
A total of 649 subjects were included in this study: 538 subjects sourced from the publicly available Alzheimer's Disease Neuroimaging Initiative (ADNI) database (ADNI-2 and ADNI-GO) 26 (https://adni.loni.usc.edu/) and 111 subjects from the Chinese Preclinical Alzheimer's Disease Study (C-PAS) database. 27 The demographic information of the included participants is provided in Table 1. The study was conducted in accordance with the Declaration of Helsinki. These sample numbers from ADNI were determined through random sampling, aiming to achieve a balanced representation of each group while maintaining a sufficiently large sample size for robust statistical analysis. The process was approved by the Institutional Review Boards (IRBs) at each participating site, and all participants provided written informed consent. The study of C-PAS was approved by the Institutional Ethics Review Board of Huashan Hospital (ethical code number: HS-KY-2017-406) and the clinical trial number was not applicable.
The demographic information of enrolled subjects (mean ± SD).

AD: Alzheimer's disease; ADNI: Alzheimer's Disease Neuroimaging Initiative; C-PAS: Chinese Preclinical Alzheimer's Disease Study; F: female; M: male; MCI: Mild Cognitive Impairment; MMSE: Mini-Mental State Examination; N: number of subjects in each class; NC: normal control.
ADNI subjects were scanned using 3T scanners manufactured by Philips, Siemens, and GE, all acquiring T1WI images of the head. The protocol parameters were listed as follows: 1.2 mm slice thickness; 256 × 256 scanning matrix; repetition time = 2300 ms; echo time = 2.98 ms; field of view = 240 × 240 mm2; flip angle = 90 degree; and 256 × 256 reconstruction matrix.
Subjects from ADNI were selected based on specific inclusion and exclusion criteria established by the ADNI consortium, including age range, cognitive status, and MRI availability, while excluding major neurological or psychiatric disorders and MRI contraindications. 28 The C-PAS database and images were acquired using a 3T uPMR790 TOF scanner (United Imaging, China). C-PAS is an observational longitudinal study conducted in Shanghai, China, commencing in April 2019. Participants were clinically diagnosed by experienced neurologists using the 2011 National Institute on Aging and Alzheimer's Association (NIAAA) diagnostic criteria for suspected AD. In addition, MCI was diagnosed if the participant met one of the following criteria: (1) at least one impaired cognitive domain, which implies impaired scores (>1 standard deviation (SD) below the age-corrected normative mean) on all neuropsychological tests in the same domain; (2) impaired scores (>1 SD) in each of the three cognitive domains. The participants for NC were all recruited from communities in Shanghai. Participants with NC were identified based on our previous study; specifically, those who did not meet the criteria for AD or MCI were identified as individuals with NC. During image acquisition, subjects positioned supine with cotton balls inserted in both ears to reduce noise, and sponge pads placed between the head and the coil to limit head movement. Subjects were instructed to remain quiet and keep their eyes closed during imaging. The imaging parameters were: 1.0 mm slice thickness; 256 × 256 scan matrix; repetition time = 2300 ms; echo time = 3.00 ms; field of view = 230 × 230 mm2; flip angle = 10 degree; and 256 × 256 reconstruction matrix.
Methods
This study applied an MR radiomics-based DL model approach to perform AD diagnosis tasks, with the experimental workflow outlined in Figure 1. (1) Sample distribution: subjects were selected from the ADNI and C-PAS databases to form the experimental group; (2) Image preprocessing: raw 3D T1WI were preprocessed, including steps such as skull stripping and image registration, to standardize all 3D T1WI into uniform specifications; (3) ROI determination and feature extraction: ROI were identified using two-sample t-tests, and radiomic features were extracted with Radiomics tools; (4) Feature selection: specific radiomic features were selected using the LASSO model; and (5) Model performance validation: based on the selected radiomic features, the TabNet model was trained and optimized. Model training parameters were adjusted to achieve optimal classification performance for diagnosing AD.

(a) Sample distribution; (b) image preprocessing; (c) ROI determination and feature extraction; (d) feature selection; and (e) model performance validation. ROI: regions of interest.
Image preprocessing
The purpose of preprocessing is to eliminate image distortions caused by random errors, such as low-frequency background noise. In this study, preprocessing of 3D T1WI were performed using the CAT12 tool based on SPM12 (https://www.nitrc.org/projects/cat/) on the MATLAB R2020b platform. First, the DCM2NII tool in MRIcon was used to convert the original DICOM images of each sample into a single NIfTI file. For each sample, the preprocessing process began with initial steps, including denoising filtering using resampling methods to adapt to low-resolution images and intensity nonuniformity correction to remove brightness and contrast variations. Subsequently, the Adaptive Probability Region-Growing (APRG) method was employed to remove nonbrain tissue and retain intracranial structures. Then, the Diffeomorphic Anatomical Registration Through Exponentiated Lie Algebra (DARTEL) registration method was used to align all images to the MNI152 space. This approach ensures precise alignment of anatomical structures while minimizing distortions and preserving morphological information. 29 Finally, the intensity normalization was applied using a bias field correction approach implemented in CAT12 to standardize voxel intensity distributions and minimize scanner-related variability. The preprocessed images had voxel dimensions of 181 × 217 × 181, with each voxel measuring 1 × 1 × 1 mm3.
Definition of ROI
In this study, we focused on localizing brain regions that are strongly associated with structural morphological changes induced by AD. To characterize the morphological differences in brain tissue between AD, MCI, and NC, a group comparison was performed based on 141 AD, 166 MCI and 231 NC subjects randomly selected from the ADNI cohort. These samples were omitted from the subsequent feature selection and classification analyses and were not utilized in any of the model training, validation, or testing procedures. A two-sample t-test in SPM12 was used for intergroup comparison, with a peak threshold set at p < 0.01 and Family-Wise Error (FWE) correction applied across the entire brain region, with a voxel threshold of 20. The results were localized and visualized using the DPABI tool (http://rfmri.org/DPABI), 30 as shown in Figure 2. The progression of AD is accompanied by significant morphological changes in certain brain regions. Based on the results of the two-sample t-test, we selected brain regions that have been confirmed to undergo morphological changes during the course of AD, including the hippocampus, amygdala, medial temporal lobe, precuneus, posterior cingulate gyrus, parietal lobe, frontal lobe, basal ganglia, and thalamus. These regions will be treated as ROI in subsequent analyses.31–35

Results of the two-sample t-test between AD, MCI, NC, (a) AD versus MCI; (b) MCI versus NC; (c) AD versus NC. The color bars represent t-value, the higher the absolute t-value, indicating a more significant difference. AD: Alzheimer's disease; MCI: Mild Cognitive Impairment; NC: normal control.
Radiomic features extraction and selection
Radiomic features were extracted from the C-PAS dataset based on ROIs identified using the ADNI cohort. In this study, radiomic features from MRI were extracted using the Python-based Radiomics tool (https://github.com/mvallieres/radiomics). 36 A total of 107 MR radiomic features were extracted, including 14 shape features, 18 first-order features, 24 texture features from the GLCM, 14 texture features from the GLDM, 16 texture features from the Gray-Level Run-Length Matrix (GLRLM), 16 texture features from the Gray-Level Size Zone Matrix (GLSZM), and 5 texture features from the Neighborhood Gray-Tone Difference Matrix (NGTDM). The detailed mathematical definitions of the radiomics matrices have been previously reported. 37 In order to select the most relevant features for AD diagnosis from high-dimensional radiomic features, we employed the LASSO regression method which was employed to select the most relevant radiomic features for distinguishing AD patients from non-AD individuals (NC and MCI combined).By introducing the L1 regularization term, LASSO is able to shrink the regression coefficients of less important features to zero, thereby achieving feature selection and dimensionality reduction. Nine non-zero coefficient features were selected in total, including 2 shape features, 3 first-order features, 1 GLDM texture feature, and 3 GLSZM texture features.
Model construction of TabNet
The TabNet model selected in this study is a neural network method proposed by the Google team for processing tabular data. It was originally designed to create interpretable models for tabular data using a DL attention network.
38
The main advantage of TabNet lies in its combination of end-to-end neural network learning and representation learning, along with the interpretability and sparse feature selection characteristics similar to those of tree models. TabNet achieves this by constructing a neural network with a decision manifold similar to that of tree models, thereby incorporating the benefits of decision trees. Each layer of TabNet corresponds to a step in the decision tree: Mask Layer: A sparse attention mechanism that selects a subset of input features at each decision step; the fully connected (FC) layer with Rectified Linear Unit (ReLU) corresponds to threshold judgment; Aggregation Layer: Summed outputs from all decision steps, followed by a Softmax layer for classification. The input to TabNet consists of feature dimensions
The main architecture of TabNet consists of two primary components: the encoder and the decoder. 39 The TabNet encoder (as shown in Figure 3(a)) consists of multiple feature processing modules (Feature Transformer), attention modules (Attentive Transformer), and feature masks. 40 The input to the encoder consists of preprocessed numerical features, and the output includes the encoded features and the data used for the final decision. The STEP in the figure represents a decision step, where each step receives all input features and selects a subset of features for computation. Each STEP receives data features as input and applies weights to these features based on the output from the previous step. The output from each step is accumulated and used for the final decision. The TabNet decoder is responsible for reconstructing the encoded features to the original data table features. Each step in the decoder consists of a Feature Transformer module and a FC layer (as shown in Figure 3(b)). By passing the masked portion of the data through the encoder and then decoding it, the final decoded data is multiplied to obtain the predicted values. The model parameters are adjusted based on the error between the actual values of the masked portion and the predicted values.
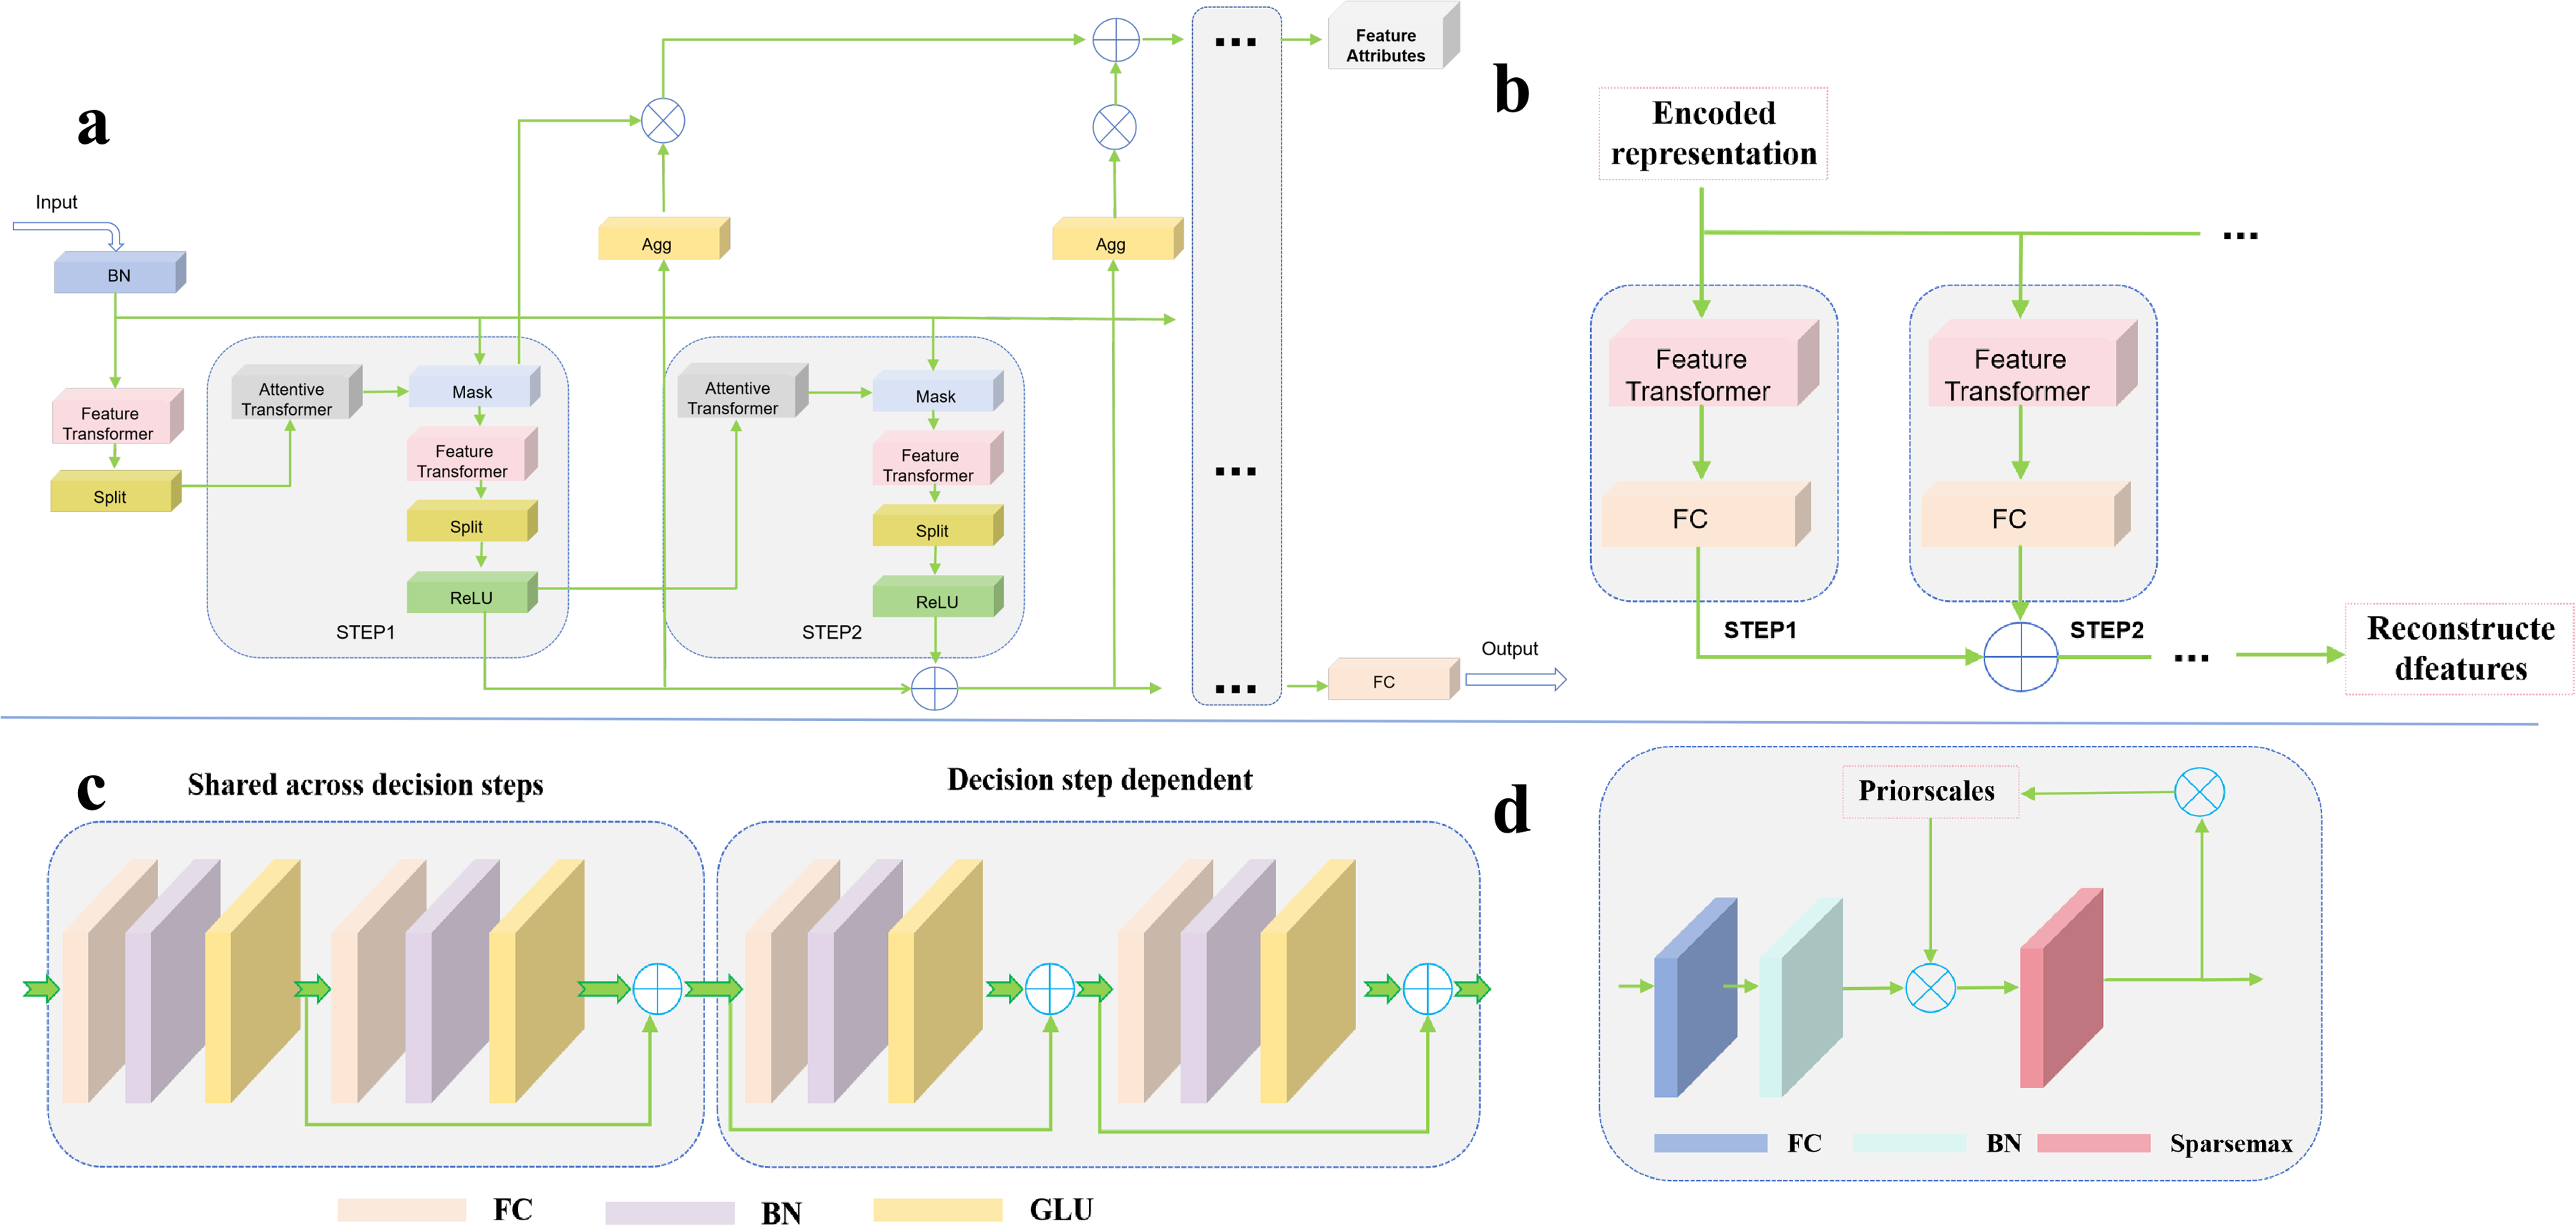
The architecture of TabNet. (a) encoder, (b) decoder, (c) feature transformer, and (d) attentive transformer. BN: batch normalization; FC: fully connected; GLU: gated linear unit.
The structure of the Feature Transformer module is shown in Figure 3(c). It consists of FC layer, batch normalization (BN) layer, and a gated linear unit (GLU) layer. The module employs skip connections to enhance the effectiveness of training and scales the gradients during backpropagation to prevent excessively large gradients, which could increase the variance of the weights and compromise training stability.41,42 The Feature Transformer module can be divided into shared and independent GLUs. The shared GLUs maintain parameter sharing during training, while the independent GLUs are trained separately. This structure allows the model to use the same layers to process common features in the early stages of training, and then choose different layers to capture independent features. The Attentive Transformer module (as shown in Figure 3(d)) consists of an FC layer, BN layer and a function. 43 Its purpose is to determine which features should be prioritized at each decision step by encoding features, generating attention weights, performing feature selection, and making recursive decisions. This dynamic adjustment of feature selection enhances the model's interpretability.
Experimental
Experimental setup
The parameter settings for the model training process were detailed as follows: Model training was performed using the selected MR radiomic features. In 3-way classification: Epochs: 150, Batch Size: 32, Optimizer: Adam, 44 Loss Function: Cross-Entropy Loss, Learning Rate Schedule: 2e-2; In binary classification : Epochs: 250, Batch Size: 32, Optimizer: Adam, Loss Function: Cross-Entropy Loss, Learning Rate Schedule: 2e-2.
The experiments were conducted on a Windows 11 operating system, using Python 3.9, PyTorch 2.0, and CUDA 11.8 environments. The hardware configuration was as follows: CPU: Intel(R) Core(TM) i7-14700KF; GPU: NVIDIA GeForce RTX 4070 Ti.
Results
This study extracts radiomic features from 3D T1WI and performs AD diagnosis using the TabNet model. The evaluation metrics selected for this study include AUC and ACC, the AUC value using the One-vs-Rest (OvR) strategy. In addition to the classification AUC, the ACC is also known to be beneficial to diagnosis. All results were averaged over five-fold cross-validation. Additionally, we conducted two distinct sets of experiments to evaluate both the performance of the proposed model and the sensitivity of different radiological features in diagnosing AD. Specifically, we compared the performance of various ML models and examined the impact of different combinations of radiomic features. Both comparative and main experimental (TabNet) groups maintained consistent training environments, samples, and model configurations and using the average results from the five-fold cross-validation.
To further verify the sensitivity of different radiomic features for AD diagnosis, we combined various radiomic features and designed control groups under different feature combinations. The results of 3-way classification (AD vs. MCI vs. NC), as shown in Tables 2 and 3 and Figure 4, indicate that the combined radiomic feature set (first-order, shape, and texture) achieved the highest average AUC (0.8728) and average ACC (0.7111). Moreover, to effectively address the potential impact of dataset imbalance on result evaluation, we have introduced the F1-score as an additional evaluation metric. In the 3-way classification (AD vs. MCI vs. NC), the TabNet model obtained a mean F1 score of 0.7111 under the same five-fold cross-validation setting. Among the individual radiomic feature control groups, the first-order features demonstrated the highest average AUC (0.7918) and average ACC (0.5778). The classification performance of the two combined radiomic feature pairs was superior to that of individual features. Given the interpretability of the TabNet model, the feature weights of different radiomic features were derived from the model, as illustrated in Figure 5. Among all radiomic features, the first-order features were assigned the highest weights.
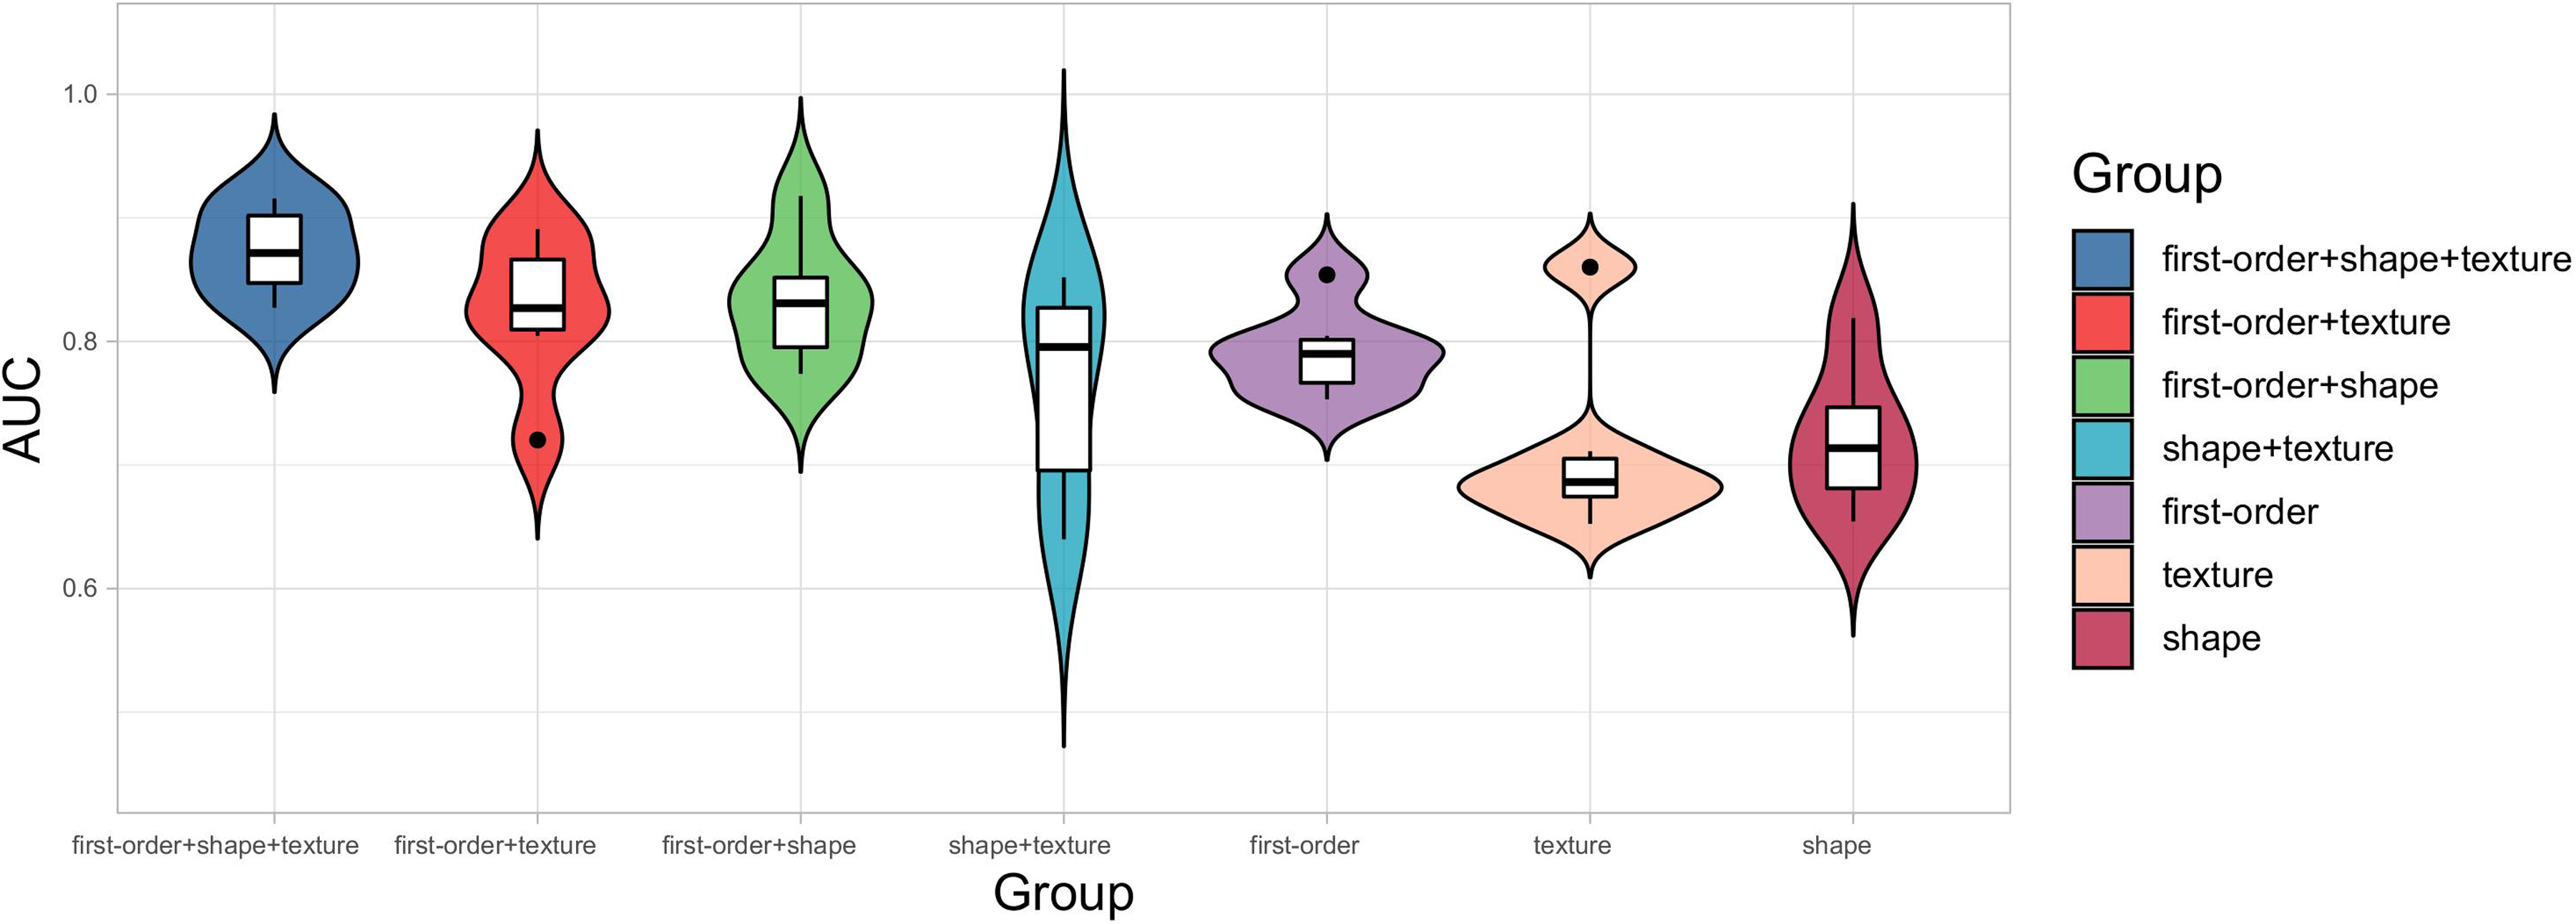
Violin plot of the metrics from the three-way classification experiments showing model performance.

Feature importance ranking from TabNet.
Diagnosis results of AUC under five-fold cross-validation of three-way classification.
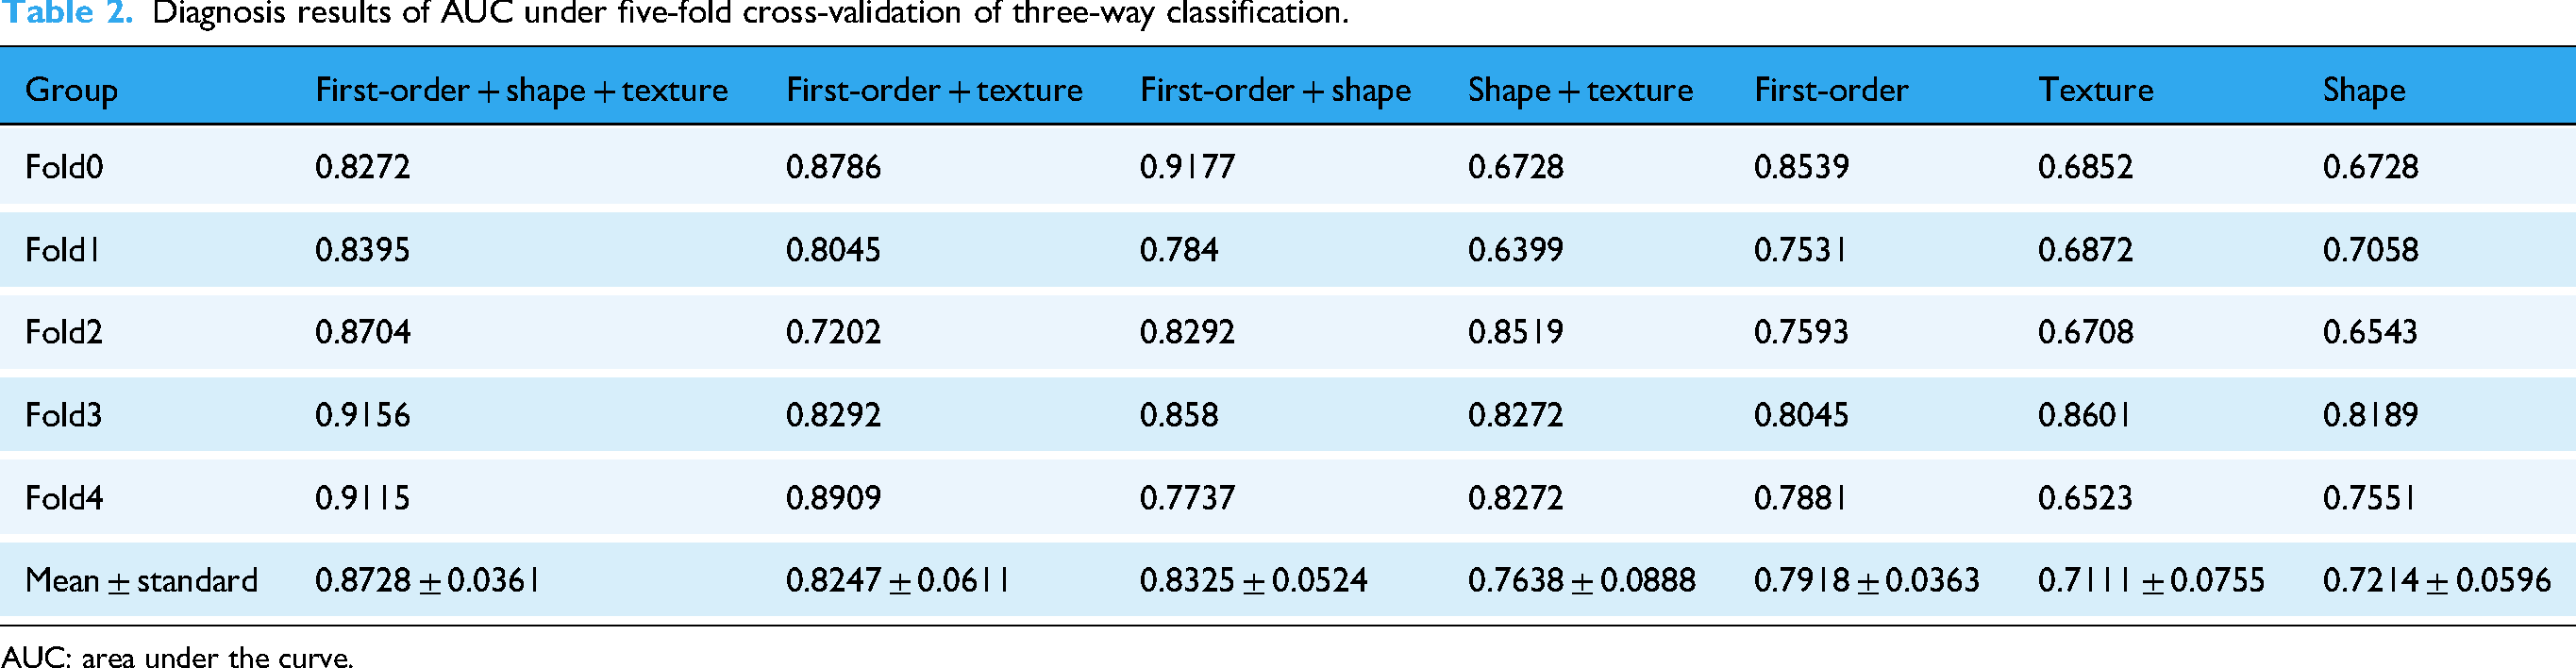
AUC: area under the curve.
Diagnosis results of ACC under five-fold cross-validation in different groups.

ACC: average accuracy curve; AD: Alzheimer's disease; MCI: Mild Cognitive Impairment; NC: normal control.
To select the baseline models, we referred to previous studies that have examined the efficacy of these models in the context of AD diagnosis, and selected classical ML models (SVM, Logistic Regression (LR), K-Nearest Neighbors (KNN), Naive Bayes (NB), and Random Forest (RF)) as the control groups.45–47 To ensure a fair comparison, the baseline methods were trained and evaluated using the exact same preprocessed data as the proposed model. Both the proposed model and the baseline methods were trained under identical conditions, including the same training data and computational resources. The performance of all models was assessed using five-fold cross-validation, and the reported results represent the average performance across all folds. This approach ensures a robust and unbiased comparison between the proposed model and the baseline methods. As shown in Table 4, our findings demonstrated that the proposed model base on combined radiomic feature set (first-order, shape, and texture) significantly outperforms the control groups, achieving a maximum improvement in average AUC of 0.1576 and average ACC of 0.1926. In addition, under five-fold cross-validation, the TabNet model achieved mean F1 scores of 0.8647 for AD vs. MCI, 0.8480 for MCI vs. NC, and 0.9178 for AD vs. NC.
Performance comparison in different models of three-way classification.

ACC: average accuracy curve; AUC: area under the curve; KNN: K-Nearest Neighbors; LR: Logistic Regression; NB: Naive Bayes; RF: Random Forest; SVM: Support Vector Machine.
Binary classification experiments (AD vs. MCI, MCI vs. NC, and AD vs. NC) were also conducted, with results detailed in Tables 3 and 5 to 7 and Figure 6. For the AD versus MCI group, the proposed model achieved an average AUC of 0.8778 and an average ACC of 0.8667. For the MCI versus NC group, the model achieved an average AUC of 0.8864 and an average ACC of 0.8556. For the AD versus NC group, the model achieved an average AUC of 0.9506 and an average ACC of 0.9222. Among these tasks, the combined radiomic features (first-order, shape, and texture) yielded the better average AUC and ACC values. When individual radiomic features were utilized, the first-order features consistently demonstrated the highest average AUC, consistent with the 3-way classification results.

Violin plot of the metrics from the binary classification experiments showing model performance: (a) AD versus MCI; (b) MCI versus NC; (c) AD versus NC. AD: Alzheimer's disease; MCI: Mild Cognitive Impairment; NC: normal control.
The results of AUC of the binary classification (AD vs. MCI).
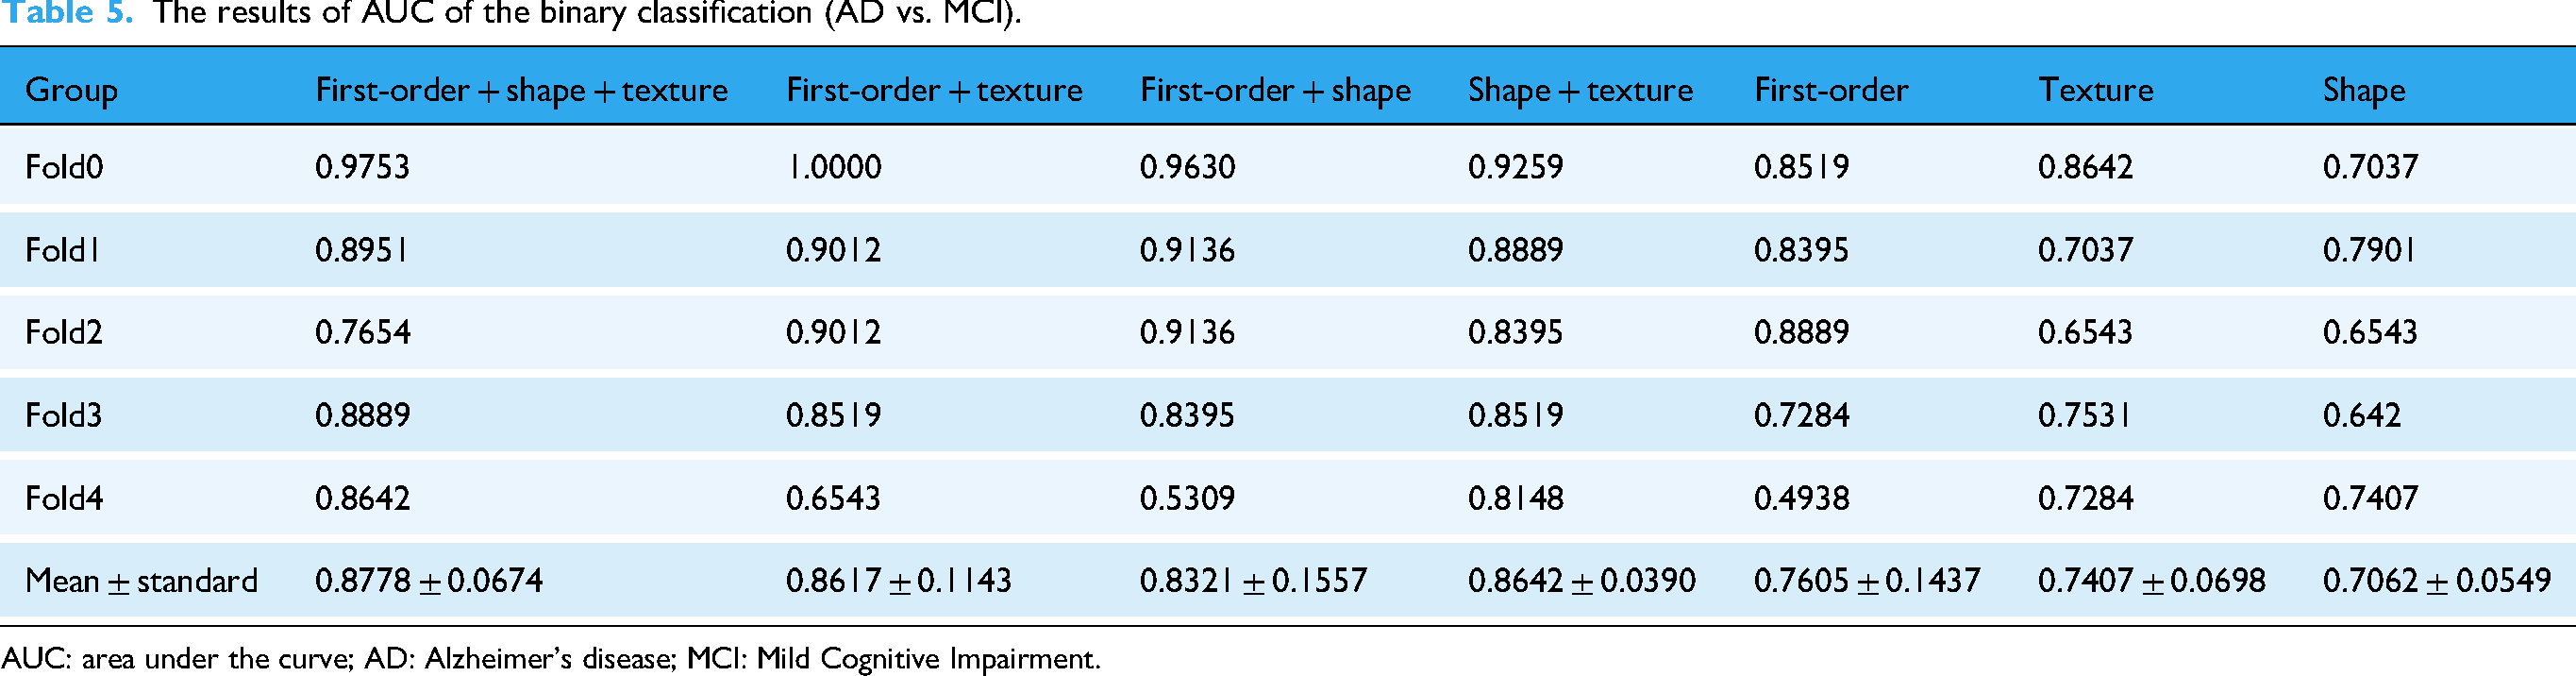
AUC: area under the curve; AD: Alzheimer's disease; MCI: Mild Cognitive Impairment.
The results of AUC of the binary classification (MCI vs. NC).

AUC: area under the curve; MCI: Mild Cognitive Impairment; NC: normal control.
The results of AUC of the binary classification (AD vs. NC).

AUC: area under the curve; AD: Alzheimer's disease; NC: normal control.
Additionally, binary classification for different AD subgroups using ML models, and the results shown in Table 8 showed that TabNet outperformed other control methods. Specifically, in the AD versus MCI comparison, the maximum increases in average AUC and average ACC over the control groups were 0.1247 and 0.1889, respectively. For the MCI versus NC comparison, these increases were 0.2271 and 0.2889, respectively. Finally, in the AD versus NC comparison, the maximum increases in average AUC and average ACC were 0.0802 and 0.1444, respectively.
Performance comparison of different models of binary classification.

ACC: average accuracy curve; AUC: area under the curve; KNN: K-Nearest Neighbors; LR: Logistic Regression; NB: Naive Bayes; RF: Random Forest; SVM: Support Vector Machine.
Moreover, we conducted ablation experiments without the LASSO-based feature selection step. The results show that the inclusion of LASSO significantly improves model performance, confirming its role in reducing noise and enhancing interpretability. These findings have been added to Table 9.
Ablation experimental results of LASSO.
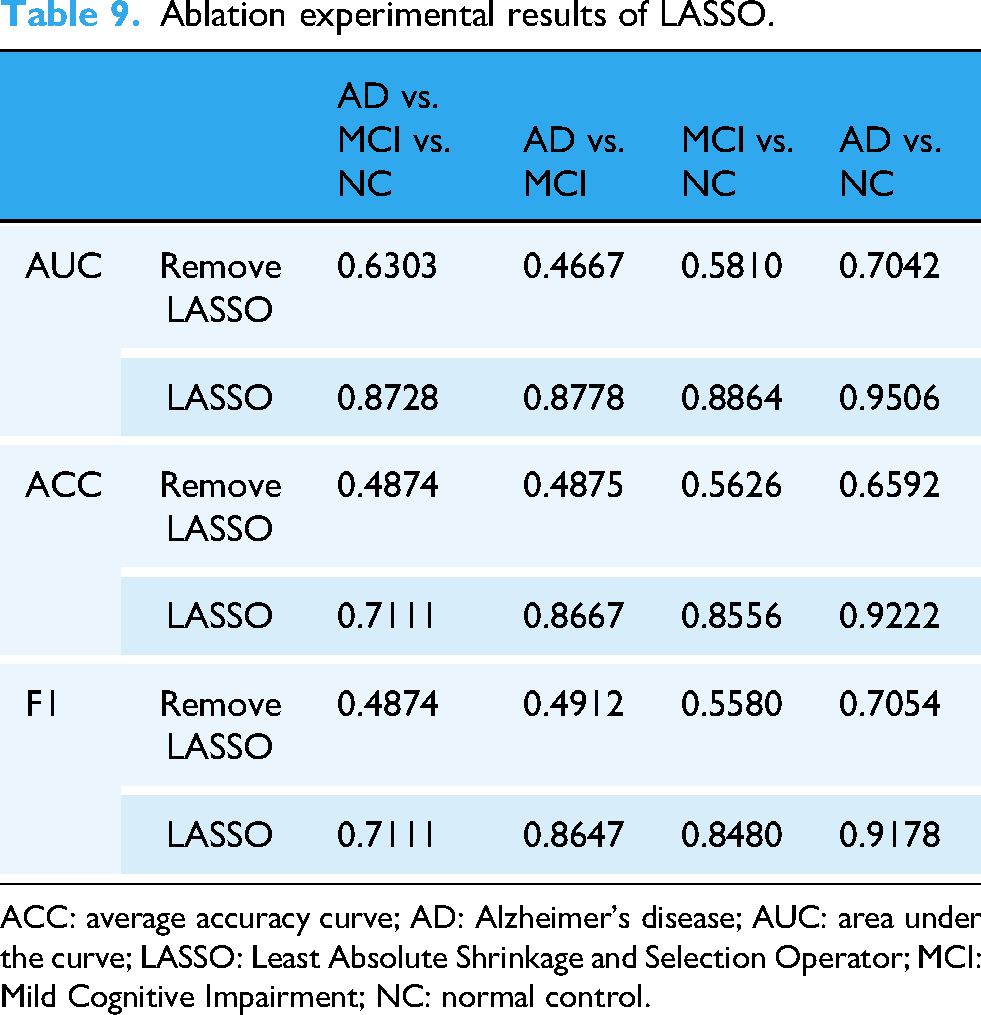
ACC: average accuracy curve; AD: Alzheimer's disease; AUC: area under the curve; LASSO: Least Absolute Shrinkage and Selection Operator; MCI: Mild Cognitive Impairment; NC: normal control.
Discussion
In this study, we selected 3D T1WI data to extract MR radiomic features and constructed an MR radiomics-based DL model for AD diagnosis. Our proposed model had the highest overall classification AUC across diagnostic tasks compared with other models.
Currently, MRI is widely used for tasks such as the diagnosis of different stages of AD and the prediction of the conversion from MCI to AD. 48 Compared to commonly used imaging techniques such as PET, MR provides reliable diagnostic information without the risk of radiation exposure, 49 making it more suitable for long-term follow up and monitoring. DL models can automatically extract core features from radiomics, and this end-to-end learning framework offers higher efficiency and superior performance when processing large-scale datasets. 1 Unlike traditional ML methods, DL models are particularly well-suited for handling high-dimensional data, enabling them to capture subtle structures and patterns in images. This capability is especially important for diagnosing complex neurological diseases such as AD. 50
This study highlights the differential performance of first-order, shape, and texture radiomic features under the TabNet model for the diagnosis of AD, MCI, and NC. Our findings indicate that while first-order features achieved the best performance when applied independently, combining first-order, shape, and texture features resulted in the highest classification accuracy for the AD classification. These results are consistent with prior studies51,52 showing that first-order features, which describe the intensity distribution of voxel values, are particularly effective for detecting global brain tissue alterations associated with AD, such as atrophy and cortical thinning. 53 The synergistic performance observed when combining the three feature types can be attributed to the complementary information they provide. Shape features capture macroscopic structural changes such as hippocampal atrophy, which are hallmark indicators of AD. 54 Meanwhile, texture features quantify microstructural heterogeneity, reflecting subtle changes in gray matter integrity and connectivity that are often early indicators of neurodegeneration. The combination of these features enables a more holistic representation of the underlying pathophysiology, allowing the TabNet model to achieve superior classification performance.
During the training process, we compared the selected TabNet model with four classic ML models. The results showed that the TabNet model significantly outperformed the control group in both binary classification (AD vs. MCI, AD vs. NC, MCI vs. NC) and 3-way classification (AD vs. MCI vs. NC). TabNet employs a “sequential attention” mechanism, enabling the model to dynamically focus on different features (e.g. first-order, shape, and texture) at each decision step. This dynamic feature selection process enhances learning efficiency by prioritizing the most relevant features for AD diagnosis. For instance, our findings reveal that first-order features significantly contribute to the model's performance, likely due to their ability to capture intensity-based variations in MRI data. Furthermore, TabNet quantifies the importance of specific features across the entire training set, thereby facilitating global interpretability. This capability not only improves the transparency of the model's decision-making process but also offers valuable insights into the biological relevance of radiomic features. As illustrated in Figure 5, the distribution of feature weights underscores the dominance of first-order features in distinguishing AD from MCI and NC. The selective attention mechanism ensures the efficient utilization of high-dimensional radiomic data, capturing subtle patterns that traditional ML methods may overlook. This attribute is particularly critical for addressing the complex and heterogeneous nature of AD-related imaging data, further enhancing the model's diagnostic accuracy and robustness.
This study has several limitations and directions for future improvement. First, the success of radiomics depends on multicenter and multimodal datasets. However, existing MR-based radiomics studies for AD primarily rely on the ADNI dataset. Future research could consider including additional databases such as AlzData and OASIS for cross-validation and increasing the sample size of independent validation datasets to improve the generalization ability of DL models.55,56 Second, the ability of MR radiomics to explain underlying neurobiological mechanisms is limited, particularly in terms of the lack of interpretation of potential biological and molecular mechanisms. Further research is needed to enhance the interpretability of results and correlate them with the pathophysiological mechanisms and clinical manifestations of AD. Finally, the progression of AD is almost irreversible, and the ultimate goal of most AD research is to identify the disease progression as early as possible and intervene in a timely manner to prevent deterioration in high-risk populations. Therefore, obtaining longitudinal follow-up data will be crucial in future studies.
Overall, our study demonstrates that DL can accurately diagnose AD using MR radiomic features. The used DL model was validated on an independent dataset, and the results indicate that the model can serve as a valuable decision support tool for radiology researchers and clinicians in the early diagnosis of AD using MR radiomic features.
Conclusion
This study proposes a DL-based diagnostic model for AD using MR radiomics features. This model effectively extracts high-sensitivity AD-related features from MR radiomic data. Compared to existing methods, the model demonstrates significant advantages in AD diagnosis, achieving higher AUC in comprehensive classification tasks across different stages of AD. The method validates the value of MR radiomics features. In the future, the radiomics-based DL model has the potential to become a practical tool for computer-assisted diagnosis of AD.
Footnotes
Guarantor
JZ.
Abbreviations
Ethics approval and consent to participate
ADNI studies were conducted according to, among others, Good Clinical Practice guidelines, and pursuant to US state and federal regulations. Approval was obtained from the ADNI Data and Publications Committee (DPC) prior to publication. The study was conducted in accordance with the Declaration of Helsinki and approved by the Institutional Ethics Review Board of Huashan Hospital (ethical code number: HS-KY-2017-406). All patients have signed the informed consent forms.
Author contributions/CRediT
ZY, NQ, XC and JZ were involved in the acquisition of data. YL, ZZ, JW, and JW were involved in analysis of the data. ZY was involved in the drafting of the manuscript. All authors were involved in the study conception and design and with critical revisions of the manuscript.
Funding
The author(s) disclosed receipt of the following financial support for the research, authorship, and/or publication of this article: This work was supported by the National Key Research and Development Program of China, Key Discipline Construction Project of Shanghai Pudong New Area Health Commission (grant number No.2022YFC2406900, Grant No.PWZxk2022-12).
Conflicting interests
The author(s) declared no potential conflicts of interest with respect to the research, authorship, and/or publication of this article.
Data availability
The datasets generated or analyzed during this study are available from the corresponding author on reasonable request.