
Abstract
Objective
The System Usability Scale (SUS) demonstrates good psychometric properties for a range of technologies; however, its reliability and factor structure in the context of a childrearing application (app) and variation across cultures remains largely unexplored. This study investigates the reliability and factor structure of the SUS in the context of a childrearing app that was co-designed for and implemented in diverse low- and middle-income countries (LMICs).
Methods
Parents and caregivers of children aged 0–5 years in five LMICs completed the SUS after having access to the app for a minimum of 2 and maximum of 24 weeks. Survey data from participants (n = 668) was analysed using exploratory and confirmatory factor analysis methods.
Results
The bi-factor model shows the best fit to data (comparative fit index = 0.998; Tucker Lewis Index = 0.996; standardised root mean square residual = 0.033). Further analysis suggests that usability and learnability subscales provide additional information not contained in the total SUS score. A two-sample t-test shows that younger caregivers, employed full- or part-time, and with fewer children reported significantly better app usability.
Conclusion
The SUS has good psychometric properties, and it is a valid and reliable tool for assessing the usability of mobile apps when used by parents and other caregivers for children's socioemotional and cognitive development. However, it is not essentially unidimensional and appears to have a multidimensional structure that could be specific to our context owing to variations in users’ experience, culture, and language. The findings have implications for other mobile health interventions implemented in contexts with cultural and linguistic differences.
Keywords
Introduction
The value of mobile health
The mobile health (mHealth) market has experienced remarkable growth reaching 325,000 applications (apps) worldwide 1 and is now a popular resource for caregivers to support children's feeding and nutrition, 2 prenatal care, 3 and mental health.3,4 With the rise in digital technologies, more parents seek access to information to support their child's developmental progress in a meaningful way. However, finding relevant information and translating that into parenting practices has often been challenging owing to variations in socioeconomic conditions, cultures, and parental preferences for the type of information sought about child development. Indeed, parenting practices are dynamically influenced by cultural beliefs about caregiving and child development, such as the desired skills and behaviours for young children, expectations for when children should meet specific developmental milestones, and how, when, and by whom care should be provided to children.5,6 Most parenting apps provide generic information and advice such as screening and tracking of developmental milestones and tracking of health promotion behaviours for children (e.g. nutrition, sleep). 7 There are very few apps that support socioemotional development. The literature also highlights that the absence of cultural considerations in most mobile apps adversely affects the adoption and retention of technology and contributes to health disparities. 8 Recently, some researchers have endeavoured to use cultural frameworks and translations of content in the design of culturally responsive mobile apps. 9 However, in relation to the latter, the findings suggest that translations, if not culturally relevant, do not support technology uptake and adoption.
In this article, we empirically evaluate the usability of a new childrearing app – Thrive by Five– that had been co-designed and implemented in nine countries in Africa (Cameroon, the Democratic Republic of the Congo, Kenya, Namibia), Central Asia (Afghanistan, Kyrgyzstan, Uzbekistan), and Southeast Asia (Indonesia, Malaysia) to support caregivers and families with evidence-based and culturally appropriate information about early childhood development (ECD). The objective of Minderoo Foundation's Thrive by Five International Program was to empower parents and other caregivers globally with the knowledge they need to support healthy development of children during the first 5 years of life. The Youth Mental Health and Technology Team from the University of Sydney's Brain and Mind Centre (including this paper's authors) led the co-design and development of the content for Thrive by Five.10,11 The content is underpinned by a scientific framework that highlights key neurobiological systems that can be targeted behaviourally to promote healthy ECD. 10 Local parents, other caregivers (e.g. grandparents), and subject matter experts (e.g. clinical psychologists, early childhood educators, medical specialists, anthropologists, linguists) were key stakeholders throughout the research and development processes, providing invaluable insights to inform the program's design and iterative refinement across diverse contexts. Specifically, all content for each country was developed, refined, and ultimately finalised in consultation with child caregivers and subject matter experts through an extensive and iterative co-design process conducted in partnership with in-country partners and local champions. As shown in Figure 1, the content, referred to as ‘Collective Actions’, is comprised of scientific information about ECD (i.e. “The Why”) coupled with suggested activities that parents, extended family, and trusted members of the community can engage in with the child to promote various aspects of their socioemotional and cognitive development. The Thrive by Five app is the flagship product of this program; however, the content is also disseminated via other digital (e.g. Whatsapp chatbot) and non-digital (e.g. print media) methods based on the needs of the users in each country where the program is implemented.

Example of a collective action: ‘the why’ and associated childrearing activities.
System Usability Scale
The System Usability Scale (SUS) is a widely used, freely available, standardised tool to assess the perceived usability of a wide range of products and systems. Usability is the perceived ease of use of a product, system, or interface to achieve a defined goal efficiently and satisfactorily. 12 Efficiency is how effortlessly a user can use a product and satisfaction is the level of comfort of using a product.13,14 Developed by Brook, 15 the SUS tool was initially presented as ‘quick and dirty’ but over time it has proven itself to be a popular and effective measure of perceived usability. 16 Indeed, the SUS has been instrumental in assessing thousands of computer- and web-based applications and is considered an industry standard.17,18 Indeed, a recent rapid review found the SUS was a commonly used method for evaluating the quality of mobile health apps in high-, low- and middle-income countries (LMICs). 19 This includes mobile health apps specific to early childhood as exemplified by NeoTree, a clinical management and education mobile app designed to improve newborn care in resource-poor settings in Malawi. 20 Several factors make the SUS relatively more popular compared to other measures of perceived usability, such as its short length (10 items), reliability and validity, ease of administration, and low cost as well as the fact that it is technology agnostic.21,22
The SUS is comprised of 10 statements relating to different aspects of usability (e.g. ease of use, need for support, confidence, consistency of features and functions) on a 5-point Likert scale ranging from strong disagreement to strong agreement (i.e. scale of 1–5) in relation to a product, application or system (Table 1). In addition, it has a mix of positively and negatively framed items, with the odd-numbered items having a positive tone and the even-numbered items having a negative tone. There is another structure of Learnability, consisting of statements 4 and 10, that was recently explored in the factor structure of SUS. 17 The SUS score is computed by converting the scale from 0 (poorest rating) to 4 (best rating) with adjustment for odd-numbered (subtract 1 from the raw score) and even-numbered (subtract the raw score from 5) questions. The adjusted score is summed and multiplied by 2.5 to get the standard SUS score. The final SUS score ranges from 0 to 100, with 0 being extremely poor usability and 100 being excellent usability.16,21
Description of individual statements in the System Usability Scale (SUS).

Adapted from Brooke. 15
While the SUS is the most widely used tool for measuring app usability, various other scales have been documented in the literature concerning user experience, satisfaction, and the suitability of mobile and web-based applications. One such scale is the User Experience Questionnaire (UEQ) which provides a comprehensive assessment across six dimensions: attractiveness, perspicuity, efficiency, dependability, functionality, and information quality. 23 However, the UEQ was not relevant to our study due to the length of its questions and our focus on conducting a rapid and simple evaluation of the app's basic usability.
The Usability Metric for User Experience (UMUX) serves as an alternative to SUS, concentrating on just two questions regarding usability and satisfaction. 24 The user experience behind UMUX aligns closely with the Technology Acceptance Model (TAM), which assumes that a user's experience with new technology is based on its perceived ease of use and usefulness.25,26 However, TAM is mainly used to evaluate a product's acceptability rather than its overall usability, which is what we aimed to assess using SUS.
Furthermore, the Technology Fit Model (TFM) evaluates the fit between technology and user needs. 27 TFM is often applied in the early stages of technology development and selection, while SUS is typically utilised after users have gained experience with a product, as was the case in our study. Recent research emphasises the importance of integrating various frameworks to devise the most reliable and effective solutions for designing and implementing mobile and web-based applications. 28 However, integrating these frameworks was not appropriate in our study context given the specific scope of the program and the goal of assessing usability after the app's implementation.
Psychometric properties of SUS
A range of research has been conducted on the psychometric properties of the SUS. The various features of the SUS that have been explored include its acceptable level of reliability,4,13 validity and sensitivity to different types of interfaces and changes to a product. 21 From its original version in English, the SUS has been translated into and validated in many other languages such as Persian, 13 Arabic, 29 Bahasa Indonesian, 30 Malay, 31 Italian, 22 Polish, 32 Slovene, 33 Portuguese, 34 and Danish 35 with reported reliabilities between 0.79 and 0.87.
Studies have shown both the average score and percentile ranking of the SUS score as acceptable standards to rate the usability of a product or application. Acceptable usability corresponds to a SUS score roughly above 68, with unacceptable usability indicated by scores below 50.18,21 Using a 7-point adjective rating scale (from worst imaginable to best imaginable) as an added eleventh question in the SUS questionnaire, Bangor et al. 36 provided grades (A to F) and incorporated acceptability ranges to the SUS score. SUS score >=70 is considered ‘acceptable’ and rated ‘good’. Sauro and Lewis 18 suggest reporting the SUS score as a percentile rank with the average score of 68 as the 50th percentile. That means a raw score above 68 is above average and below 68 is below average.
The recent trend in research shows a high inclination towards the dimensionality of the SUS – whether it provides a single score of usability and is unidimensional (one-factor) or is multidimensional. As the SUS has been used for various products and in various contexts, the findings on its dimensionality and factor structure are mixed.17,37,38 However, a large body of literature argues that the SUS assesses the single construct of usability, and findings suggest it is unidimensional. Most of this literature comes from straightforward contexts such as assessing the usability of hardware platforms and computer interfaces. 36
While the SUS has been widely applied to measure usability in mobile and web-based applications, its reliability and factor structure in the context of a childrearing app remains largely unexplored. This study aims to investigate the reliability and dimensionality of the SUS in the context of the Thrive by Five app in culturally diverse LMICs. It also explores potential factors to explain ‘usability’ and ‘learnability’ to inform future work in similar contexts.
Methods
Study design
In addition to co-designing and developing the app, the Brain and Mind Centre's Youth Mental Health and Technology team was also responsible for conducting impact and process evaluations of the Thrive by Five International Program. As such, the evaluation study of the usability of the Thrive by Five app using the SUS reported in this paper was embedded within a larger multi-site mixed methods evaluation study of the program detailed in LaMonica et al. 39 The Thrive by Five Program had been implemented in nine LMICs at the time of writing; however, the evaluation had not been completed in Kenya or the Democratic Republic of the Congo. Additionally, limited app uptake and inconsistencies in the data collected from participants in Namibia and Cameroon raised notable concerns about the reliability and validity of responses to the SUS. As such, only data collected in Afghanistan, Indonesia, Kyrgyzstan, Malaysia, and Uzbekistan were included in this study.
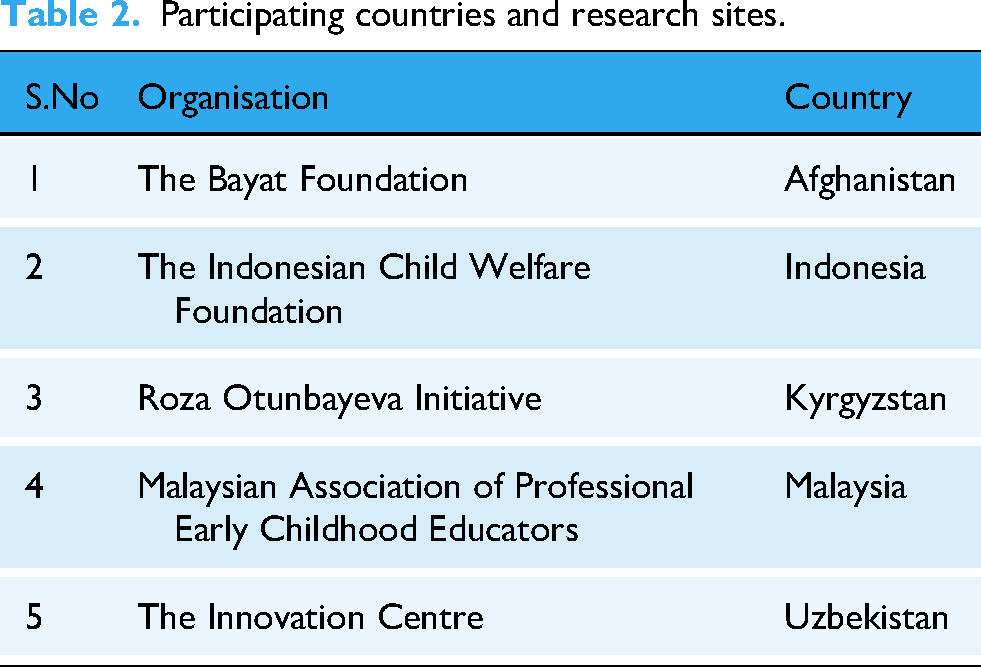
Importantly, for each participating site (Table 2), the original SUS questionnaire was translated using international guidelines for cross-cultural adaptation to ensure consistency of meaning to the original version. 40 Specifically, the survey was translated from English into up to three local languages to enable participants to provide their responses in their preferred language. The survey translation process involved multiple steps: 1) translation by a professional translator; 2) translation reviewed and edited by a second translator; 3) any discrepancies or concerns discussed with original translator. For all languages that have NAATI accreditation, the translations were NAATI accredited. NAATI is the national standards and certifying authority for translators and interpreters in Australia (https://www.naati.com.au/).
Participating countries and research sites.
Participants
Participants were parents and caregivers (e.g. grandparent, aunt, uncle, nanny) who were 18 years of age or older, self-identified as a caregiver for at least one child aged 5 years or younger, and had used the Thrive by Five app in a manner of their own choosing, either on their own smartphone or on a device shared with other family members or close friends. There were no specifications set as to the frequency of app use, time spent on the app, level of app engagement, or the number of Collective Actions completed. Participants were recruited through established networks and advertising mechanisms of the respective research sites in each country in which Thrive by Five was implemented. 11 The sites used the recruitment methods best suited to their community and context (e.g. emails, poster displays, paper-based and online internal news articles, handouts, digital advertisements on social media). All participants provided written informed consent for this study. Incentives to compensate participants for their time were offered based on each site's national paid participation rates and methods of reimbursement as recommended by the local ethics practices and committee's advice.
Data collection
Participants were invited to complete the SUS questionnaire as part of a larger evaluation survey between 2 and 24 weeks after they began using the app in each respective country. The site provided participants with a web link providing them access to the impact evaluation survey via REDCap,41,42 a secure electronic data collection and management tool hosted at the University of Sydney. Paper-based surveys were also available and distributed by the Site Principal Investigator via post or in-person on an as needed basis for those participants who did not have reliable access to the internet or a personal smartphone. Basic demographic information (e.g. relationship to the child, sex, country of birth, language spoken at home, age, marital status) was collected for descriptive purposes. Participants were asked to complete the survey within one week of receiving it, with those completing it on paper returning the survey directly to the site. The data collection for this research occurred over 2 years (2022–2023). Notably, identifying information is not collected in the Thrive by Five app; therefore, it is not possible to link evaluation participants with their app usage data.
Statistical analysis
A pooled sample of five participating countries was used for analysis. Basic descriptive statistics (e.g. frequencies, percentages) were used to analyse demographic data. The sample was randomly divided into two halves using the split-half sample method for the robustness and generalisability of our findings.43,44 The two subsets of samples included 334 observations, which is consistent with the recommended criteria for exploratory factor analysis (EFA).45,46 EFA was conducted on the first half of the data while confirmatory factor analysis (CFA) was performed on the second half to collectively validate the robustness of our findings. Participants per item ratio for CFA calculated was 33 which aligns with the 5–10 participants per item suggested by previous studies. 47 Additional indices such as Chi-square, comparative fit index (CFI), Tucker Lewis index (TLI), and standardised root mean square residual (SRMR) were evaluated for model goodness of fit.
Several statistical analyses were performed to detect the factor structure of the SUS. EFA was performed to examine the underlying relationship among the items. As our context differs in geographical and demographic characteristics and when users have their first-time interaction with the app, EFA is desirable to understand the relationship of the underlying variables. Bartlett's test of sphericity was performed to test whether our observed correlations differ significantly from the identity matrix. An identity matrix means that our variables were not correlated with each other. A significant Barlett's test was an indication to carry out the factor analysis. While this test could have been affected by sample size, we also reported Kaiser–Meyer–Olkin (KMO) measure of sampling adequacy. 48 A KMO value >=0.70 is considered acceptable for factor analysis of the correlation matrix. A scree plot was used to determine the number of factors to retain in the EFA. All statistical analyses were conducted using RStudio (version 4.3.1) using lavaan 49 and Psych 50 packages. P-values less than 0.05 were considered as significant.
CFA was conducted to further assess and verify the factor structure of the variables and evaluate the construct validity of the SUS. In addition, CFA was used to check whether the SUS could be used as a single score, or if it is multidimensional. In relation to this, several statistical tests were used to determine the adequacy of various models’ fit to the data. We evaluated four models including one-factor, two-factor (usability and learnability), tone structure (positive and negative statements), and bi-factor models to further explore the SUS factor structure. The rationale behind the evaluation of a two-factor and bi-factor model was to provide further insights on the dimensionality of SUS investigated in other contexts.4,17 A two-factor structure involves two distinct latent factors, and each observed variable is influenced by one of these factors. 51 This structure explains variance in observed data through two underlying factors which limits its applicability to data where variance can be attributed to a general factor as well as specific factors. Bi-factor, on the other hand, allows for the examination of both general factor and specific factors simultaneously and offers an advantage when dealing with constructs that have both a broad overarching dimension (e.g. usability) and other secondary dimensions (e.g. usability and learnability). 52 Because the data is collected on a 5-point Likert scale and is considered ordinal, we adjusted parameter estimates using weighted least squares mean and variance which is a recommended approach for the analysis of ordinal data. 51 Accordingly, goodness-of-fit was assessed using CFI and TLI (each with a cutoff score>=0.95 for an acceptable fit), and SRMR (cutoff score<=0.08). 53
Following Dueber, 54 further advanced statistics were calculated to carefully decide on the dimensionality of the found structure. Omega was calculated to report a model-based estimate of internal reliability. While there is no predetermined cutoff for Omega, studies recommend a value between 0.50 and 0.75 as an acceptable level of reliability. Further complimentary statistical indices calculated were Omega hierarchical (OmegaH), explained common variance (ECV), and percent of uncontaminated correlations (PUCs). Omega hierarchical or OmegaH reports the percentage of systematic variance in unit-weighted total scores that can be attributed to the individual differences in the general factor. 55 The higher the OmeageH the more the general factor is the dominant source of systematic variance and the higher the likelihood of unidimensionality. ECV is the proportion of common variance attributable to the general dimension while PUC is the percentage of covariance terms which only reflect variance from the general dimension. PUC along with ECV influences the parameter bias of the unidimensional solution. When ECV and PUC > 0.70, the relative bias will be slight, and the common variance can be regarded as essentially unidimensional. 55 Similarly, when PUC values are lower than 0.80, general ECV values greater than 0.60 and OmegaH > 0.70 suggest the presence of some multidimensionality is not severe enough to disqualify the interpretation of the instrument as primarily unidimensional. 56
Results
Demographic characteristics of respondents
A total of 668 participants were recruited through the research sites in the five participating countries including Afghanistan (
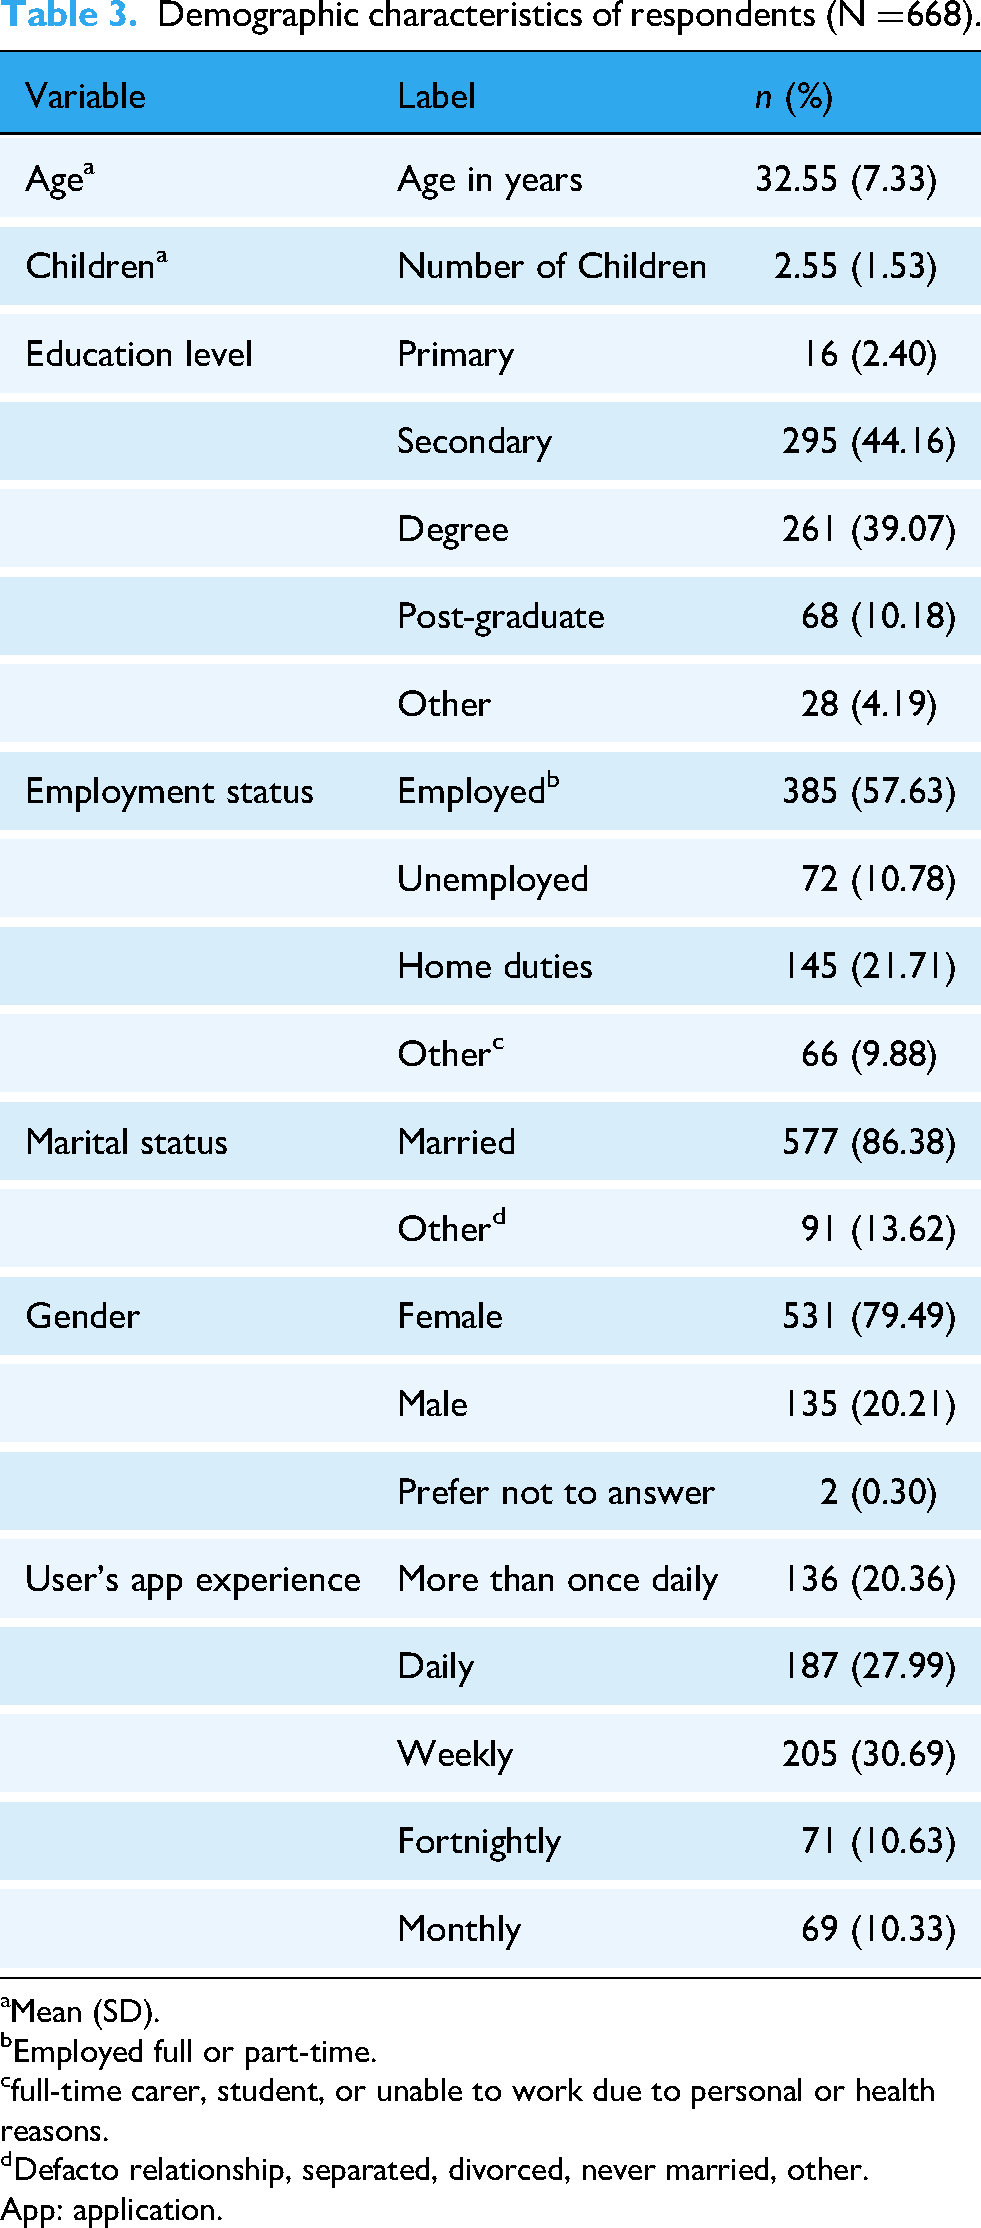
Table 3 reports the pooled demographic characteristics of the participants across the five countries. All variables, except participant age and number of children, are categorical variables. The frequency (n) and percentages are reported for the categorical variables, while means and standard deviations are reported for continuous variables, such as age and number of children. Approximately 50% of the respondents had completed a degree or post-graduate qualification and 68% were employed full- or part-time. The average age of respondents was about 32 years with 79% female and 86% married. The last four rows report users’ experience with the app. Daily and more than once daily use was reported by 48%, weekly use by 31%, and fortnightly and monthly use by 11% and 10%, respectively. It should be noted that this was the users’ first interaction with Thrive by Five, and their experience is reported only in this context. For example, we did not collect data on user's prior experience with the app as it was implemented for the first time in the targeted countries. In this relation, we do not deal with the longitudinal aspects of usability evaluation –testing over time to take into consideration user's prior experience with the app. 57
Summary statistics of SUS statements
Table 4 reports the means of individual statements and the mean total SUS score, with the standard deviations presented in column 3 and range in column 4. The mean total SUS score is 65.07 (this is approximately the 50th percentile in our sample) which falls below the acceptable standard. Overall, respondents, except for statements 4 and 10 (measuring learnability), tended to disagree relatively more with the even-numbered statements (negatively worded) compared to the odd-numbered statements (positively worded). This could mean that Thrive by Five was relatively less quickly learnable for caregivers in our sample overall. However, examination of the results in relation to demographic characteristics (refer to Table 3) using univariate regression analysis found statistically significant differences in the total SUS score based on age (p < 0.001), employment status (p < 0.05), number of children (p < 0.01), with young caregivers who were employed and had fewer children reporting higher SUS scores compared to their counterparts.
Demographic characteristics of respondents (
Mean (SD).
Employed full or part-time.
full-time carer, student, or unable to work due to personal or health reasons.
Defacto relationship, separated, divorced, never married, other.
App: application.
Psychometric outcomes
Consistent with the previous literature, the reliability coefficients show that the SUS has acceptable reliability as evidenced both by

Scree plot from the factor analysis of SUS statements. SUS: System Usability Scale.
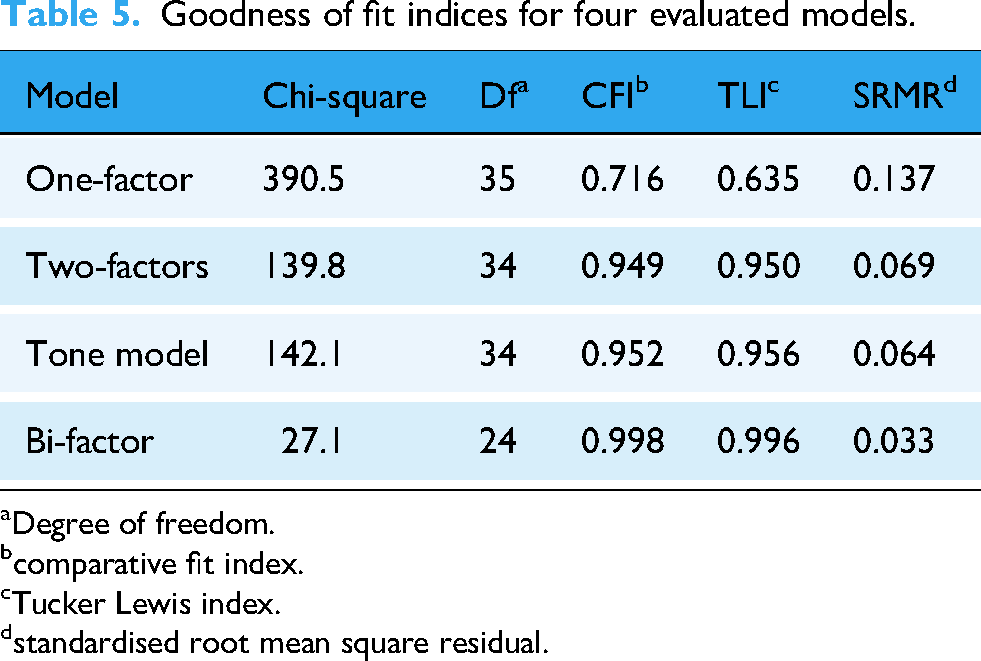
As a next step, the model fitness was investigated using CFA to see whether the SUS could be used as a single score or if there is a departure from essential unidimensionality. Four models were evaluated: one-factor, two-factor, tone structure, and bi-factor model. Table 5 shows the results of the four models. The goodness-of-fit indices suggest that one-factor does not have an acceptable fit with CFI and TLI < 0.95 and SRMR > 0.08. However, two-factor, tone structure, and bi-factor models show an acceptable fit according to the goodness-of-fit indices (CFI>=0.95. TLI>=0.95, SRMR<=0.08). Based on the fit indices, the bi-factor model shows the best fit compared to other models. Figure 3 shows a graphic representation of the fitted bi-factor model with a positive correlation between usability and learnability.
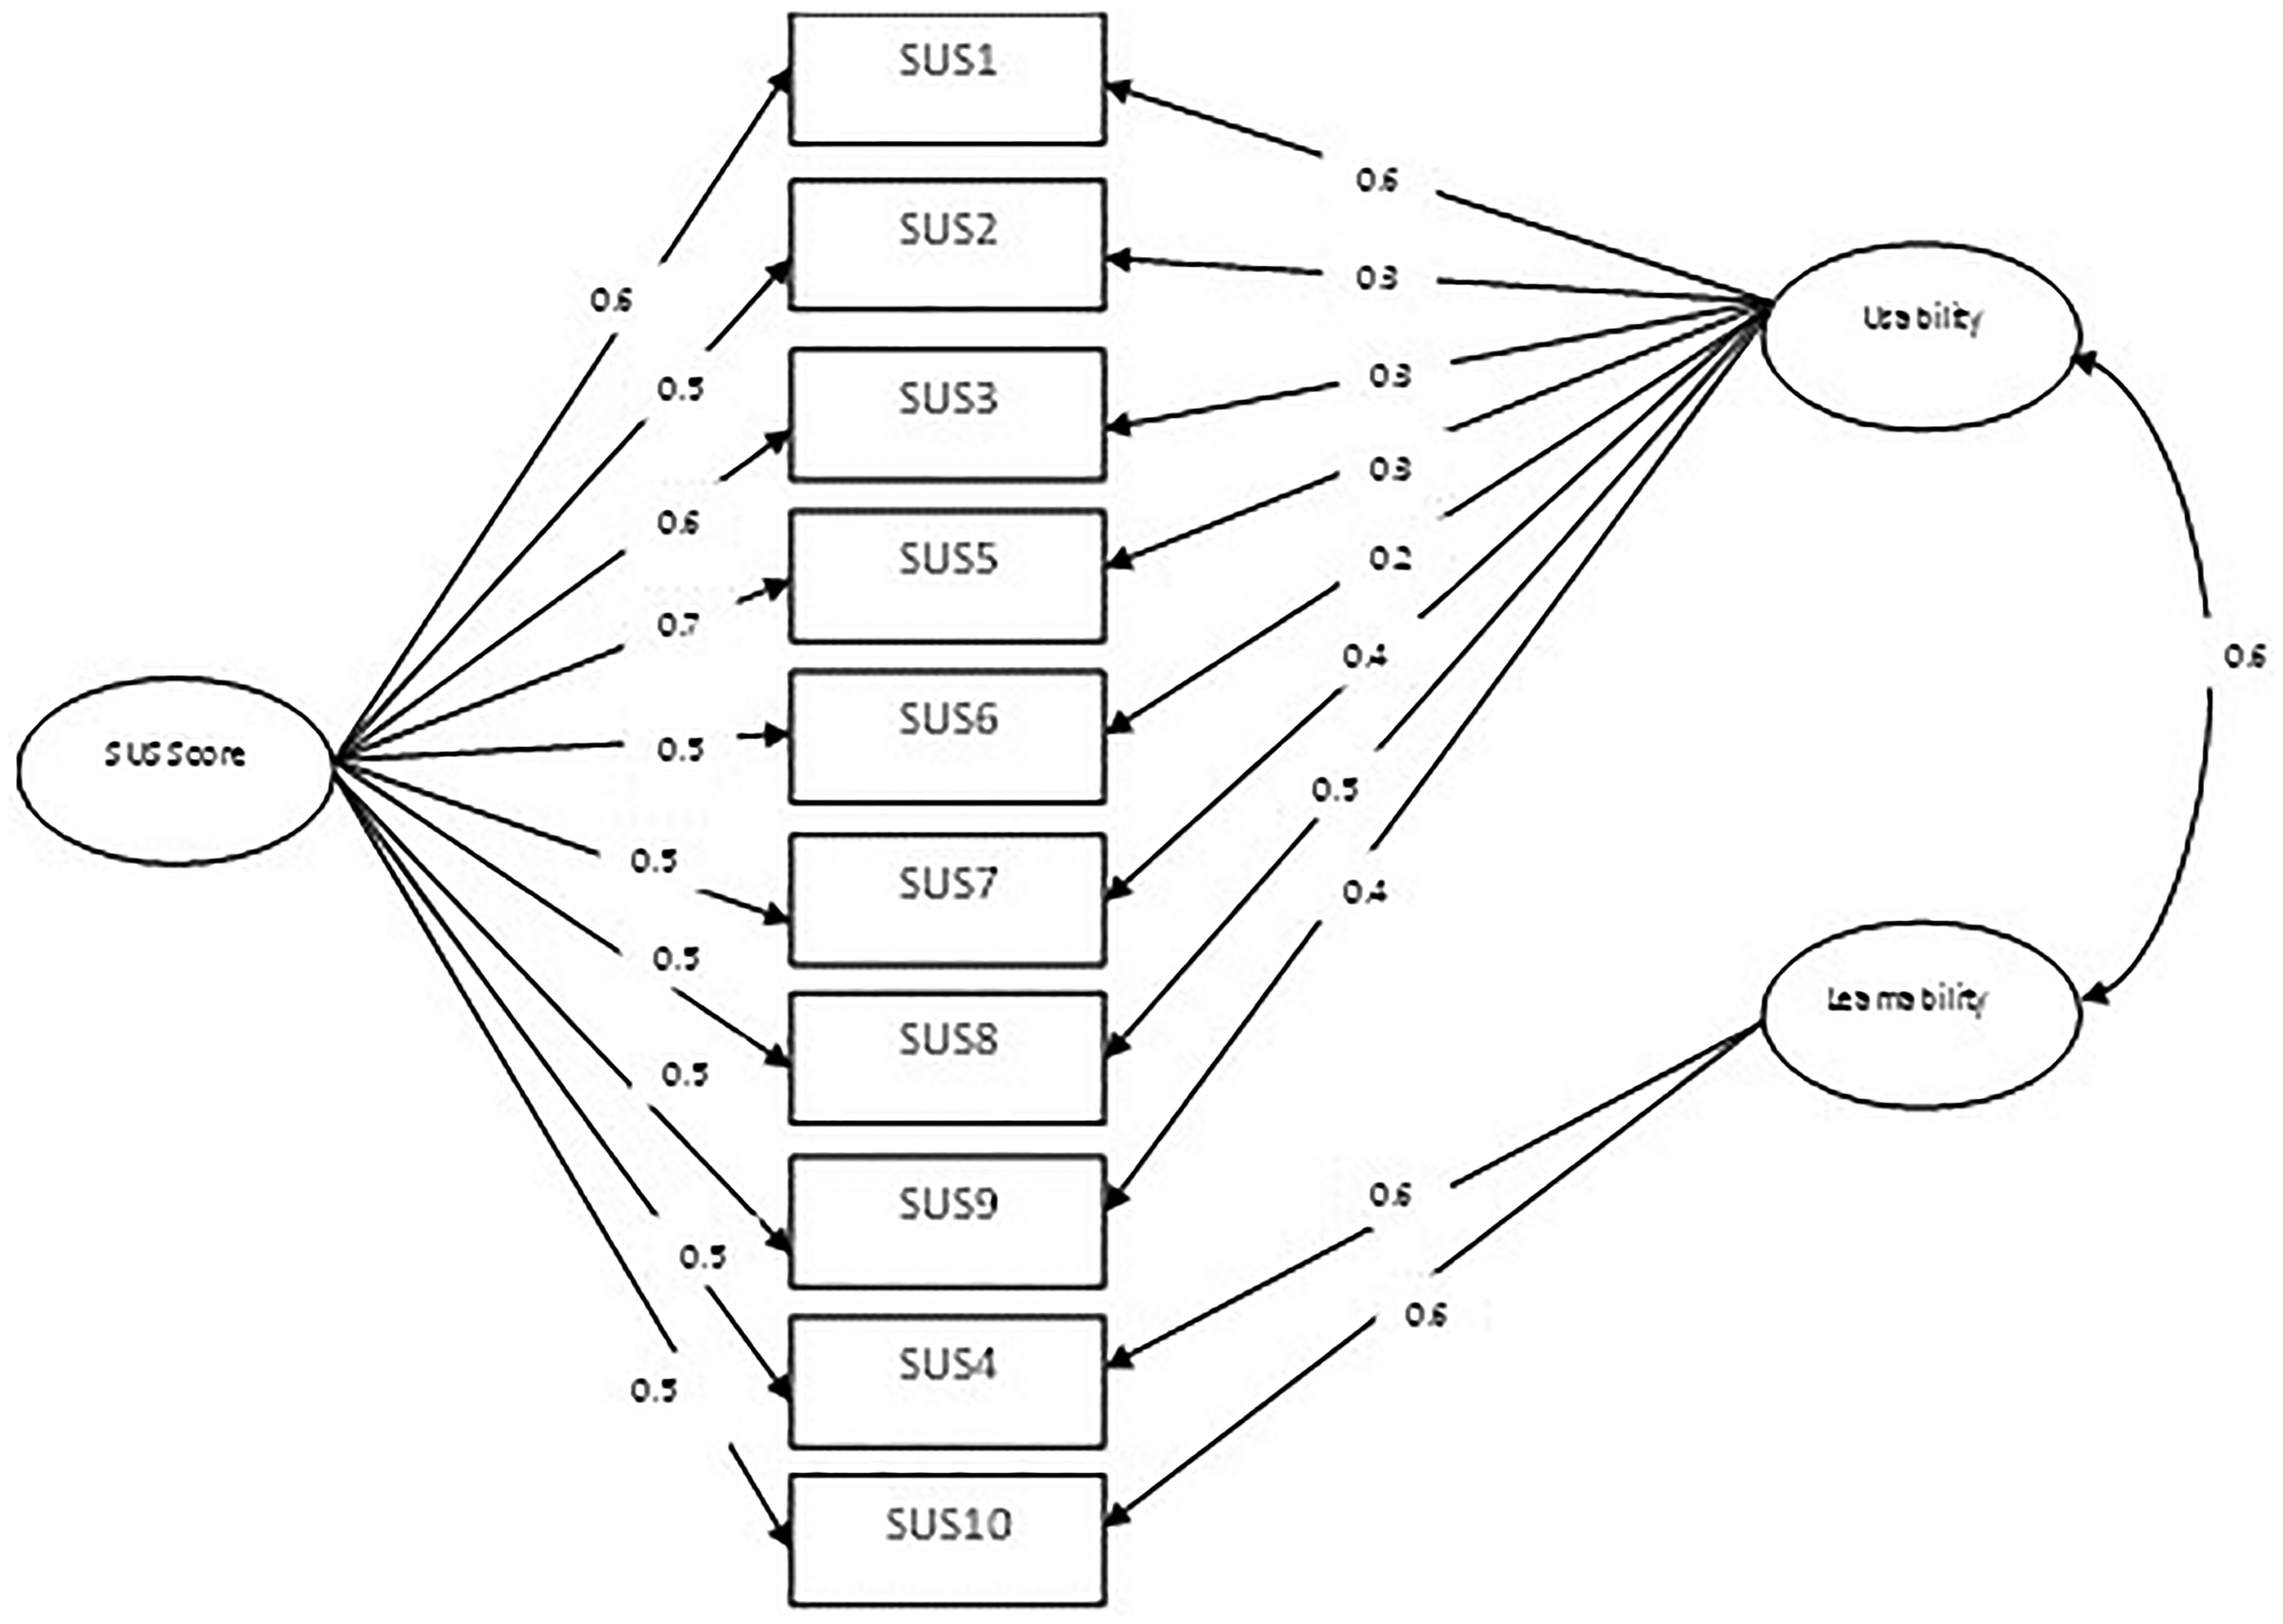
Factor structure of the bi-factor model.
Summary statistics of individual statements and total SUS score.

Each SUS statement ranges from strongly disagree (=1) to strongly agree (=5).
SUS: System Usability Scale.
Goodness of fit indices for four evaluated models.
Degree of freedom.
comparative fit index.
Tucker Lewis index.
standardised root mean square residual.
As reported previously, the tone structure has no practical and theoretical meaning in the context of the SUS and hence further analysis is not of interest. However, the two-factor structure concerning usability and learnability has practical implications and has been explored in the previous literature. Hence to model multidimensionality, the bi-factor model is used with a general factor directly influencing all manifest variables along with orthogonal specific factors (usability and learnability) additionally influencing distinct subsets of variables.
Following Reise et al., 56 next we calculated advanced bi-factor indices such as PUC and ECV to decompose variance and determine the relative strength of the general factor versus specific factors and quantify the degree of unidimensionality. The calculated ECV is 0.60 meaning that 60% of the variation comes from the general dimension. The PUC is 0.36 and the Omega H value is 0.65. Given that the ECV and PUC values are less than 0.70, the common variance cannot be considered as essentially unidimensional. Collectively, these findings suggest that the presence of some multidimensionality cannot be eliminated and SUS cannot be completely regarded as essentially unidimensional. 56
Discussion
Mobile apps have made it possible to deliver evidence-based health and well-being information to a wider audience (e.g. parents, caregivers); however, to generate impact at scale, it is important for developers and researchers to continuously test, validate, and evaluate apps to provide optimised and culturally informed experiences for end users. In cross-cultural contexts, it is important that the reliability of evaluation instruments such as SUS is not assumed, but rather tested and validated. We explored the factor structure of the SUS in the context of a childrearing app for a diverse group of caregivers in five LMICs. Our findings indicate that the SUS has acceptable reliability and is a valid measure for mobile-based parenting apps aimed at supporting children's social, emotional, and cognitive development in diverse contexts. Notably, our findings show that the SUS is not essentially unidimensional, and that the subscales (learnability/usability) cannot be disregarded in our context. Various reasons could help explain this finding. Specifically, recent research shows the amount of user experience with a product as one of the possible determinants of the factor structure of the SUS. 22 Their findings suggest the SUS is a one-factor scale when completed by users with less experience and a two-factor scale for users with more experience with the product.
The two-factor structure may also emerge when users spend more time with a product to acquire more learning (or what the previous research mentioned as learnability). 4 As ECD and childrearing practices are influenced strongly by local cultures, there is potential for users to have difficulty aligning app contents with existing perspectives on childrearing, hence requiring more learning to close this gap. In other words, more time may be required for users to personally adapt the content to their own culture and context. Indeed, beyond new learnings from digital health interventions, such as Thrive by Five, parenting practices are ongoingly and dynamically influenced by a myriad of factors including cultural beliefs, personal experiences, economic and social status, personal goals and priorities, family dynamics, and social media. 5 In such circumstances where a product or application serves as an educational platform, the learnability dimension may have more weight than usability particularly depending on how the new learnings align with other information sources or beliefs with regard to parenting.
Our heterogeneous sample contains large variations in users’ experience with the app, education levels, and employment status. Almost half the caregivers reported use of the app either daily or more than once daily. This high frequency of use may be explained by users having to adapt to a new platform. Thus, it can be inferred that more learning was required to translate knowledge into positive caregiving practices. This pattern appears in the statement-wise summary statistics reported in Table 4. The table shows that a relatively higher proportion of the respondents reported learnability issues by agreeing with the statements that they needed the support of a technical person and that they needed to learn a lot of things before getting going with the app. There is also a relatively higher variation in respondents’ responses to these two statements.
The total SUS score in our pooled sample falls below acceptable standards. As is explained above, a relatively higher tendency of participants toward learnability challenges could be one of the reasons for a low total usability score in our data. Further, examination of differences based on demographic variables allows us to draw additional inferences. Specifically, the statistically significant negative association between the age of the participant and usability in our sample may indicate that young users find the app relatively more usable compared to older users, a finding consistent with the previous research. 21 We also found that parents and caregivers with relatively more children who were not employed full- or part-time reported poorer usability scores compared to their counterparts. For example, parents (particularly mothers) with more children are less likely to engage in paid employment, 58 may not have time to ‘learn’ the app due to finite levels of resources (time, energy, etc.) and therefore report poor usability. Collectively, these factors provide suggestive evidence of the underlying mechanisms behind the below acceptable usability score in our data.
Based on our analyses, the SUS appears to have a multidimensional structure and the subscales usability and learnability provide additional information that could be specific to our context – typical caregivers in LMICs with no or very limited exposure to the product and substantial variability in relation to education levels, employment status, age, and number of children. This has significant implications for interpreting SUS scores for other mHealth apps scaling in global settings where issues of learnability may need to be addressed to achieve acceptable usability. However, there are some limitations that we would like to mention. The sample comes from culturally and linguistically diverse contexts that may have influenced variability (standard errors) in our reported estimates. As we mentioned earlier, the survey was translated from English into up to three local languages in participating countries to enable participants to provide their responses in their preferred language. The reliability (
Conclusion
With the universal endorsement of ECD in the 2030 sustainable development goals, there is a growing trend in the use of digital learning platforms to help parents and caregivers in LMICs address the risks of suboptimal development in young children. While technology has the potential to support the scaling up of ECD programs in diverse contexts, it entails challenges regarding culture, language, digital literacy, and training. It is therefore important to understand the usability of digital applications targeted toward ECD in specific contexts. In pursuit of this goal, it is imperative that evaluation tools for assessing these impact measures are scrutinised for validity and reliability, particularly when they are used in diverse contexts. In this article, we explore the reliability and factor structure of the SUS in the context of a childrearing app in five LMICs. We demonstrated that the SUS had good psychometric properties and is a valid and reliable tool for assessing the usability of mobile apps when used by parents and other caregivers for children's socioemotional and cognitive development. However, it appears to have a multidimensional structure that could be specific to contexts where there users’ experiences, exposures, cultures, and languages are variable. The subscales of usability and learnability provide additional information that is not already contained in the total SUS score, highlighting the need to examine demographic, knowledge-based, cultural, or contextual factors that may make it more difficult for a user to ‘learn’ an app. Thrive by Five and other parenting applications interacting with cultures and requiring cultural adaptation need further inquiry ideally at the levels of individual countries or cultures to produce targeted findings for the designers and consumers in this discourse.
Footnotes
Acknowledgments
The authors would like to thank all in-country partners including the Bayat Foundation (Afghanistan), the Indonesian Child Welfare Foundation (Indonesia), Roza Otunbayeva Initiative (Kyrgyzstan), the Malaysian Association of Professional Early Childhood Educators (Malaysia), and the Innovation Centre (Uzbekistan) for their assistance in facilitating local ethics and governance approvals as necessary and for recruiting parents and caregivers to participate in this research study. Additionally, we would like to thank all study participants who contributed their valuable, knowledge, and feedback. We also would like to thank the technology team at BBE for their efforts in developing, piloting, and testing the Thrive by Five app. Finally, we are very appreciative of our partner, Minderoo Foundation, for their support of this research.
Guarantor
IBH
Ethical considerations
This study has been approved by the University of Sydney Human Research Ethics Committee (HREC) (Project 2021/956). Where a country-specific HREC exists, a site-specific protocol and supporting documents were submitted for local ethics approval, prior to initiating the research at the identified site. The Site Principal Investigator assisted in identifying the appropriate country-specific HREC as well as with the preparation and submission of ethics application as required. In instances where the country did not have a governing ethics body (e.g. Afghanistan), the approval from the University of Sydney applied as advised by the University of Sydney's HREC Office.
Consent to participate
All participants provided informed consent electronically prior to participating in this study.
Author contributions/CRediT
Authors, HL, YS, and IH were integral in securing funding to support the study. The impact evaluation study was designed by HL, YS, VL, and ME, with additional insights and support from QK, AN, and IZ. Scientific oversight and guidance were provided by IH to ensure all activities were conducted responsibly and in a culturally appropriate manner. QK was responsible for all data analyses and drafted the original manuscript. All authors contributed to and have approved the final manuscript.
Funding
The author(s) disclosed receipt of the following financial support for the research, authorship, and/or publication of this article: This research was conducted by the University of Sydney's Brain and Mind Centre pursuant to an agreement between the University and Minderoo Foundation Limited (Minderoo). Minderoo's Thrive by Five International Program targets parents and caregivers of children 0–5 years to support the cognitive, socioemotional development and well-being of young children across diverse cultures. IBH is supported by a NHMRC L3 Investigator Grant (GNT2016346).
Conflicts of interests
The author(s) declared the following potential conflicts of interest with respect to the research, authorship, and/or publication of this article: IBH is the Co-Director, Health and Policy at the Brain and Mind Centre (BMC) University of Sydney, Australia. The BMC operates an early-intervention youth services at Camperdown under contract to headspace. He is the Chief Scientific Advisor to, and a 3.2% equity shareholder in, InnoWell Pty Ltd which aims to transform mental health services through the use of innovative technologies.
Data availability
The data analysed during the current study are not publicly available to protect participant's privacy and confidentiality. However, R codes used for the analysis are available from the corresponding author upon reasonable request.