
Abstract
Objective
Gait analysis plays a pivotal role in evaluating walking abilities, with recent advancements in digital health stressing the importance of efficient data collection methods. This study aims to classify nine gait types including one normal and eight abnormal gaits, using sequential network-based models and diverse feature combinations obtained from insole sensors.
Methods
The dataset was collected using insole sensors from subjects performing 15 m walking with designated gait types. The sensors incorporated pressure sensors and inertial measurement units (IMUs), along with the center of pressure engineered from the pressure readings. A number of deep learning architectures were evaluated for their ability to classify the gait types, focusing on feature sets including temporal parameters, statistical features of pressure signals, center of pressure data, and IMU data. Ablation studies were also conducted to assess the impact of combining features from different modalities.
Results
Our results demonstrate that models incorporating IMU features outperform those using different combinations of modalities including individual feature sets, with the top-performing models achieving F1-scores of up to 90% in sample-wise classification and 92% in subject-wise classification. Additionally, an ablation study reveals the importance of considering diverse feature modalities, including temporal parameters, statistical features from pressure signals, center of pressure data, and IMU data, for comprehensive gait classification.
Conclusion
Overall, this study successfully developed deep sequential models that effectively classify nine different gait types, with the ablation study underscoring the potential for integrating features from diverse domains to enhance clinical applications, such as intervention for gait-related disorders.
Introduction
Abnormal gait refers to deviations from the normal walking pattern, which can indicate underlying musculoskeletal or neurological conditions. Detecting these gait abnormalities is significant for early diagnosis and effective management of conditions such as ill habits that may lead to more severe musculoskeletal conditions or are associated with neurological disorders. Identifying abnormal gait patterns can provide insights into the severity and progression of these diseases, enabling timely and targeted interventions that can significantly improve patient outcomes.1,2 Moreover, accurate gait classification aids in developing personalized treatment plans, monitoring disease progression, and preventing secondary complications such as joint degeneration and decreased mobility. 3 Traditionally, gait analysis has been conducted by utilizing three-dimensional motion capture (MoCap) systems equipped with digital cameras and inertial measurement unit (IMU) sensors. While these systems provide accurate and sophisticated insights, they require dedicated facilities, expert personnel, and multiple sensors affixed to patients, resulting in a significant amount of time and resources. Furthermore, the complexity of these systems poses challenges in practical implementation within clinical settings.4,5 As a result, there is a growing demand for streamlined approaches to data collection that minimize sensor requirements and accelerate the process. Recently, in-shoe devices have emerged as a promising alternative for gait analysis. These devices, equipped with integrated IMU sensors, can capture angular velocities and accelerations of the foot, making it possible to classify different gait types. For instance, Meng Chen et al. demonstrated the effectiveness of utilizing shoe sensors to categorize five distinct gait types using support vector machine algorithms. 6 Similarly, Sang-Il et al. leveraged data from insole sensors to classify seven gait types based on variations in terrain and speed, employing null-space linear discriminant analysis to extract features from categorized pressure intensity sequences. 7 Other than conventional machine learning models, Xia et al. utilized long short-term memory (LSTM) with attention mechanism for Parkinson’s disease (PD) detection with publicly available pressure data collected from foot-worn sensors and achieved 99% of accuracy in classifying patients from normal people. 8
However, the first two studies focused exclusively on training conventional machine learning models using specific sensor data. Meng Chen et al. utilized only IMU data, while Sang-Il et al. combined IMU data with pressure readings, yet both studies were limited in number of features or the scope of feature domains explored, leaving room for further improvements in classification performance. Furthermore, both studies classified only a limited number of gait types, making their findings less generalizable to broader gait analyses, such as distinguishing between pathological and normal gaits under more varied conditions.
The study by Xia et al., while demonstrating exceptional performance in PD detection, focused exclusively on distinguishing a specific neurological condition rather than addressing the challenge of classifying multiple gait types across diverse conditions. Additionally, this study utilized pressure data alone, without integrating kinematic data or other feature sets that could provide a more comprehensive understanding of gait dynamics.
To the best of our knowledge, there is a lack of studies evaluating these many types of abnormal gaits using deep learning models trained exclusively on features extracted from pressure sensors and IMUs. Therefore, our research focused on developing and validating an algorithm for diagnosing abnormal gait types using features extracted from pressure sensors and IMUs integrated into smart insoles. By leveraging a deep learning approach, our goal was to create a robust model that could successfully identify abnormal gaits from normal ones and further distinguish the abnormal gait types, often stemming from ill habits, carry the risk of progressing into more severe musculoskeletal conditions or being linked to neurological disorders. Moreover, we conducted an ablation study to identify the features from which domain contributes the most in a successful classification task. This process involves exhaustively comparing the classification performance of the best model that resulted from the first task trained on each combination of feature sets.
Materials and methods
A cross-sectional experimental study was conducted to classify nine types of gait patterns using deep sequential models. Specifically, we collected gait data from participants under various walking conditions using smart insoles. These insoles were designed to capture pressure signals and IMU data. The extracted features from this data were then utilized to train deep sequential networks, with the objective of classifying the various types of gait. Furthermore, an ablation study was conducted to assess the impact of distinct feature combinations on classification accuracy.
Subject recruitment
A total of 53 participants were recruited for this study between May and August 2023 at the Korea Institute of Science and Technology. To ensure the reliability and validity of the experiment, participants were recruited based on strict inclusion and exclusion criteria. The criteria were designed to select healthy individuals whose gait patterns would not be influenced by existing medical or physical conditions. The criteria in detail are as follows:
Healthy male and female adults aged between 20 and 59 years. Individuals without temporary or chronic physical discomfort or musculoskeletal disorders affecting the lower back, lower limbs, or soles of the feet. Additionally, individuals who are unable to walk on flat ground at a normal pace for more than 30 minutes, irregardless of specific conditions, are excluded from the experiment. Participants with a history of musculoskeletal conditions influencing gait ability, such as cervical or lumbar disc herniation and knee osteoarthritis, are excluded.
The age of participants ranged from 20 to 59 years old and the mean age of the participants was 38.4. The mean weight and height were 66.4 kg and 166.0 cm, respectively, with a similar distribution of participants in each decade. Furthermore, the gender of the participants was also similarly distributed among the groups. Table 1 provides a detailed overview of the demographics of the study participants. This study was conducted with the approval of the Institutional Review Board (IRB No.KIST
Demographics of the subjects.
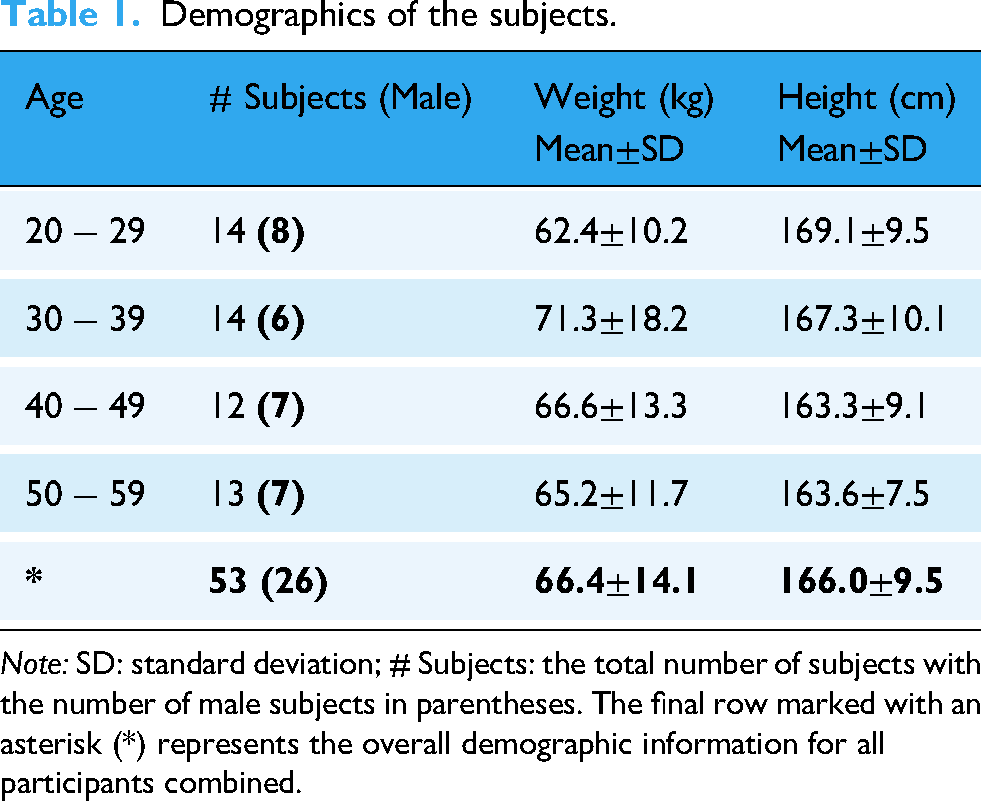
Note: SD: standard deviation; # Subjects: the total number of subjects with the number of male subjects in parentheses. The final row marked with an asterisk (*) represents the overall demographic information for all participants combined.
Definition of abnormal gaits
Eight abnormal gait types that were included in this study were in-toeing (IT), out-toeing (OT), excessive eversion (EE), excessive inversion (EI), flat-foot, forefoot, drop-foot, and circumduction gait. IT gait, which can shift the center of gravity to areas less capable of withstanding stress, may lead to joint pain or discomfort, as well as rotational deformities of the shin or thigh bones, potentially affecting hip function. 9 OT gait is associated with skeletal conditions such as medial tibiofemoral osteoarthritis, and may also predispose individuals to other degenerative joint diseases. 10 Flatfoot was included as it often affects patients with soft tissue laxity, posterior tibial tendon dysfunction, or cerebral palsy. 11 EE and EI were included due to their potential to cause high ankle sprain and sprains in lateral ankle ligaments.12,13 These conditions elevate the risks of instability of ankle joints which can end up being a chronic disease if left untreated. Forefoot gait may indicate underlying foot arthropathy, metatarsalgia, or lesser toe deformities, warranting further investigation. 14 Drop foot, commonly linked to neurological disorders such as stroke, multiple sclerosis, or amyotrophic lateral sclerosis, was also considered due to its serious implications for motor function. 15 Additionally, circumduction gait is a hallmark of stroke patients, making it a critical gait pattern for analysis. 16
Experimental protocol
For this investigation, a normal gait (N) at usual, slow, and fast speeds was combined with eight abnormal gait types. For usual, slow, and fast gait tasks, participants were asked to perform the gait tasks 10% to 30% slower and faster than their usual gait. For the abnormal gait tasks, participants were asked to perform them only at the speed they were comfortable with. For abnormal gaits, the participants were instructed about how to mock abnormal gaits, and an ample amount of time was given to practice. For the IT gait task, participants were instructed to turn their toes inward towards the midline of their body during the stance phase of walking and maintain this inward angulation.
17
As for the OT gait task, participants were directed to rotate their toes outward away from the midline of their body during the stance phase of walking and sustain this outward rotation.
17
For the EE gait task, participants were instructed to exaggerate the inward rolling motion of their foot, particularly during the stance phase, focusing on pushing the inner edge of their foot toward the ground as much as possible while maintaining forward progression.
18
For the EI gait task, on the other hand, participants were instructed to make the outward rolling motion of their foot during the stance phase, pushing the outer edge of their foot off the ground and emphasizing outward rotation.
19
The flat-foot gait (Flat) task was instructed as the heel and toe of the foot touching the ground simultaneously while the fore-foot gait (Fore) task was instructed as the heel not striking the ground without their heels touching the ground.
20
The drop-foot gait (Drop) task was instructed as dragging toes while walking and the circumduction gait (CD) task was instructed as lifting the leg away from the body and following a semicircular path to clear the ground while moving forward.21,22 Once the mimicking of abnormal gaits was judged sufficient, the participants were asked to perform the tasks. For a total of 11 gait tasks, the participants were asked to perform a round trip of a 15-meter aisle for each gait task with smart insoles inserted in their shoes (NeuroGait Insole, SALTED Co., Ltd, South Korea). The smart insole was equipped with six resistive pressure sensors per foot, totaling twelve pressure measurement points across both feet. These sensors were capable of detecting pressure values up to approximately 600 kPa. The IMU sensor measured acceleration up to

Schematic diagram of (a) Insole of pressure sensors and (b) inertial measurement unit (IMU) sensors. (a) The locations of six pressure sensors embedded within the insole. These sensors measure absolute pressure values at specific points on the foot. and (b) The orientation of IMU axes within the insole, showing the
Figure 2 describes the experimental setup for data collection. For gait types other than normal, slow, fast walking, IT, OT, EE and EI, each of the remaining four gait types was performed twice, assuming the condition was present in either the left or right foot separately. Moreover, an additional trial was conducted as if the abnormality was present in both feet. The pressure and IMU readings from the six pressure sensors and IMU sensor of each foot were collected during each 15-meter trial.
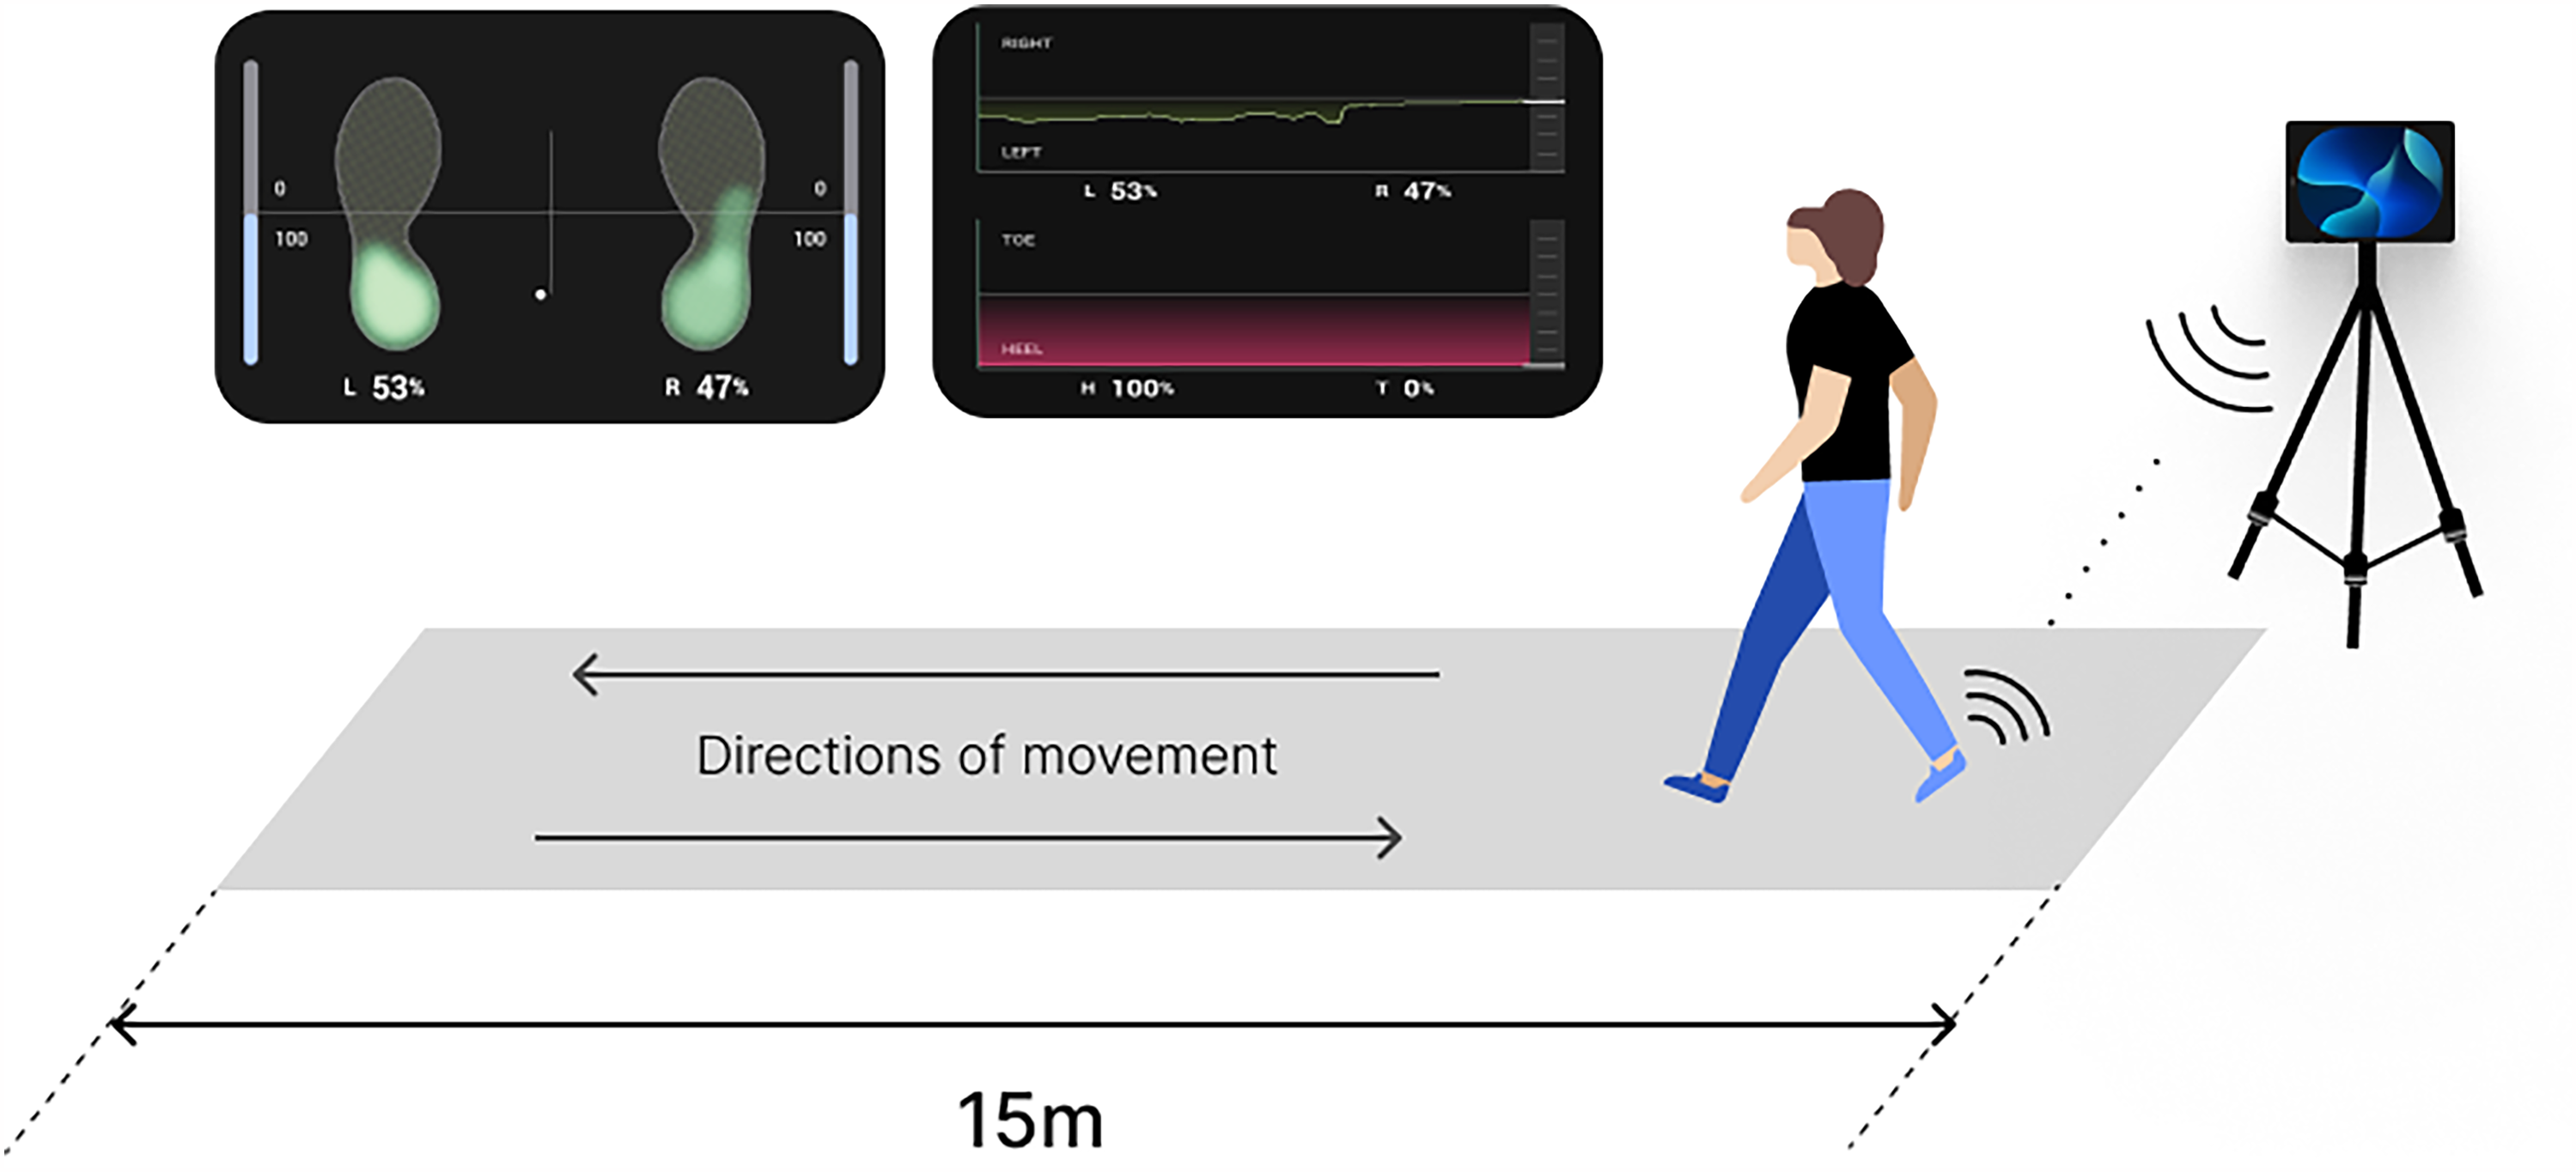
Experimental setup for data acquisition. The schematic diagram illustrates the experimental environment where participants performed gait tasks along a 15-meter aisle. The directions of movement are marked by arrows. Participants walked along the designated path while maintaining the instructed gait pattern.
Data preprocessing
Signal processing and feature engineering
The raw signals of pressure and IMU were third-order low-pass filtered at cut-off frequency of 10 Hz in order to remove the artifacts and noise for rigorous feature extraction. We utilized the centroid of external forces, known as the center of pressure (CoP), as a key factor in feature extraction. To determine the CoP coordinates in both the frontal and lateral directions, we employed a weighted average calculation method based on the established formula;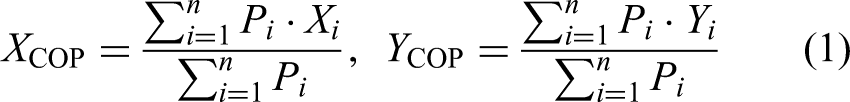
where
Parameters that reflect gait characteristics were extracted from the pressure signals, net pressure, CoP trajectories, and IMU signals. For temporal parameters extraction, two gait events, heel strike (HS) and toe-off (TO) were identified from the net pressure signal using a thresholding approach based on when the signal reaches or drops to 10% of the body weight of a subject. The identified gait events were then used to obtain seven gait temporal parameters. These include step time, stride time, stance time, swing time, single limb support, and double limb support. Step time is the amount of time from the HS of the ipsilateral foot to the HS of the contralateral foot, stride time is the amount of time from the HS of the ipsilateral foot to the following of the same foot, stance time is from the HS to TO of the same foot, swing time is from the TO to the next HS. Double limb support time, which consists of the initial and terminal phases, is the amount of time spent where both feet are in touch with the ground. Initial and terminal double limb support are the first and last phases of double limb support in a gait cycle, with initial occurring when one foot contacts the ground as the other prepares to leave, and terminal occurring when the trailing foot prepares to lift off as the leading foot bears weight. Single limb support time is the amount of time when only one foot is in touch with the ground.23–25 Figure 3 presents the visualization of the temporal parameters used in this study.

Visualization of temporal parameters. The diagram illustrates the phases of the gait cycle with temporal parameters being represented by the arrows between two gait events; heel strike and toe-off. The figure identifies stride, step, stance, swing, single-limb and double-limb support time within a gait cycle.
Other than temporal parameters, 22 statistical parameters were extracted from pressure, net pressure, CoP, and IMU signals: Mean, mean average value (MAV), minimum value (min), maximum value (max), root mean squared (RMS), variance (VAR), standard deviation, (SD), slope sign change (SSC), mean absolute division (MEAN_AD), simple square integral (SSI), average energy (ME), difference absolute mean value (DAMV), Willison amplitude (WAMP), median frequency (MDF), peak frequency (PKF), total power (TTP), mean power (MNP), maximum power (MAXP), Kurtosis (KURT), Skewness (SKEW), coefficient of variance (CV), and mean frequency (MNF). From seven pressure signals including signals from each sensor and net pressure, a total of 161 parameters were extracted, seven of which being temporal and the others being statistical features. Statistical features used and their calculation are described in Table 2. As a result, a total of 341 features were extracted.
Statistical features and their formula.

Note: SSC, the number of times the slope of the signal changed within an analysis window; WAMP, the number of times the signal crosses the minimum threshold within an analysis window;
27
Feature selection with Featurewiz
This study employed the Featurewiz algorithm, an automated feature selection tool designed to eliminate irrelevant features while retaining the high predictive ones. 26 Featurewiz operates through a two-step process: Selecting Uncorrelated List of Variables (SULOV) and recursive eXtreme Gradient Boosting (XGBoost). The SULOV method evaluates pairwise correlations among all features to identify and eliminate redundant ones. Features with a correlation exceeding a pre-defined threshold, which was set to 0.7 in this study, are iteratively pruned to ensure minimal redundancy.
Following the SULOV step, the recursive XGBoost method further refines the selection. It is applied iteratively to evaluate the importance of each feature in predicting the output labels. Features deemed less important are recursively eliminated, ensuring that only those with maximum relevance to the target variable remain. Through this hybrid approach of SULOV and recursive XGBoost, the algorithm identified a final subset of 58 features that exhibited minimal redundancy and maximum relevance to the target labels. This refined feature set was subsequently used as input predictors, expected to enhance the predictive power of the model by focusing on the most informative variables.
Model selection and training
This section demonstrates how the dataset was split for real-world applicability, input shape engineering and a holistic training process to avoid overfitting.
Dataset split and input engineering
First, the initial data was split into three datasets; training, validation, and test set. To avoid the model being optimized on individual samples, the dataset was divided by distinct subjects so that internal trends of samples within a subject did not appear in the validation or testing phase. The participants were split into 33, 9, and 11 subjects for three categories respectively.
To enhance the input representation and add temporal context, we combined features from ten consecutive strides and defined them as a sequential feature. The sequential feature was used as an input sample. Figure 4 describes the data aggregation for ten consecutive strides for sequential input.

Data aggregation from ten consecutive strides. The diagram illustrates how features from ten consecutive strides are concatenated to form a sequential input sample. Each stride contributes its features, which are combined sequentially across the ten strides. This approach adds temporal context to the input, enabling the model to identify long-term dependencies and subtle variations in locomotion patterns.
This concatenation approach enabled us to gather information across multiple temporal windows, with the purpose of the model to identify long-term dependencies and subtle variations in locomotion patterns. All features were scaled using StandardScaler provided by the scikit-learn application programming interface before concatenation.
Evaluation strategy
In this study, 9-class classification was conducted in which the target labels were N as usual, slow and fast speed combined, IT, OT, EE, EI, Flat, Fore, Drop and CD. The evaluation of the model was undergone in two parts; sample-wise and subject-wise. For sample-wise classification each data sample was considered for the overall evaluation just like a general evaluation whereas in subject-wise classification the main focus was to distinguish the subjects, each of whom was composed of multiple samples that shared a similar trend present within the same subject. To perform a subject-wise evaluation, the probability vector of each sample that represented the class membership was first calculated. Then, these vectors of each sample that originally belonged to the same class were averaged to find the class which the subject were most likely to belong to. By incorporating two different strategies, we could evaluate the classifier based not only on performance scores on specific samples, but also across different individuals.
Deep sequential models with convolution neural network
Since conventional machine learning models are not adequate for sequential data due to their non-stationary characteristics, deep learning models designed specifically for these types of data were utilized for the desired task. 28 A number of sequential models were trained on 10-stride samples for abnormal gait classification. The models included recurrent neural network (RNN), LSTM, gated recurrent unit (GRU), bi-directional LSTM (BiLSTM), and bi-directional GRU (BiGRU) along with the five models with attention mechanism incorporated (RNN_ATTN, LSTM_ATTN, GRU_ATTN, BiLSTM_ATTN and BiGRU_ATTN).
Each sequential network was preceded by 1-d convolutional neural network (CNN) with a kernel size, stride and padding of 3, 1 and 1, respectively. This CNN layer was followed by the scaled exponential linear unit activation function and dropout layer to mitigate overfitting.
The deep sequential networks were then succeeded by two fully connected layers, culminating in a softmax layer for final classification.
Hyperparameter optimization
The models were optimized to identify hyperparameters that were most likely to yield the best performance. An open-source hyper-parameter optimization framework called Optuna was utilized for this specific task. One of the key features of this framework is that it allows you to define search spaces for hyperparameters using Python conditions, loops and syntax which enables simple yet effective exploration of broad hyperparameter configurations. 29
For all ten models we used, the hyperparameter search space was set as follows. The number of layers and hidden size were set to four integer values with each ranging from 1 to 4 and 16 to 64 with an increment of 16. Other hyperparameters such as the type of optimizer, dropout rate, and batch size were also tested with different values; stochastic gradient descent (SGD), root mean square propagation (RMSProp), and adaptive moment estimation (Adam) for optimizer type, seven float values ranging from 0.1 to 0.7 with an increment of 0.1 for dropout rate, and 16, 32, 64 for batch size.
The hyperparameters we applied for each model were what returned the lowest validation loss out of 100 different trials.
Model training
For training the model, we implemented weight-adjusted Cross Entropy loss to address the inherent class imbalance within the dataset. These weights were inversely proportional to the frequency of each sample, ensuring effective model training by emphasizing the significance of underrepresented instances. The learning rate was also adjusted to decrease with a factor of 0.0005 based on the loss value throughout the iteration when it did not decline every fifth epoch. The batch size and the total number of epochs were set to 16 and 100. Lastly, the weights of the best version of the model which had the least validation loss were saved and leveraged for the final test evaluation.
Ablation study
We further evaluated the effect of different feature sets on the classification of abnormal gaits. The model that showed best performance in gait classification was used for the ablation study to vouch for consistency in the evaluation process and allow for a direct comparison of the impact of different feature sets on this task. Features used in ablation study were categorized into four sets: Temporal parameters (T), statistical parameters extracted from pressure signals (P), CoP data (CoP), and IMU data (IMU). In this study, we investigated the impact of all 15 possible combinations of these four feature sets on the performance of our deep learning model in subject-wise classifications. Our aim was to discern the individual contributions of temporal parameters, statistical parameters derived from pressure signals, CoP data, and IMU data.
Results
Classification performance of deep sequential models
To derive an unbiased comparison of the performance of the deep sequential models, they were evaluated in four distinct metrics which were accuracy, precision, recall, and F1-score. 30 Table 3 presents the metrics of the sample-wise and subject-wise classification performance of the models.
Metrics of (a) sample-wise classification and (b) subject-wise classification achieved by each sequential model.

Note: GRU: gated Recurrent Unit; BiGRU: bi-directional gated recurrent unit; LSTM: long short-term memory; Bi-LSTM: bi-directional long short-term memory; RNN: recurrent neural network.
The top best-performing models were BiLSTM_ATTN and GRU_ATTN with the highest F1-scores, both of which having 0.89 and 0.92 in sample-wise and subject-wise evaluation, respectively. These models demonstrated superior performance in capturing intricate patterns and dependencies within the sequential data.
To provide further insights into the performance of the model, confusion matrices were generated for both the sample-wise and subject-wise classifications. Confusion matrices of BiLSTM_ATTN model, which was one of the best models, are presented in Figure 5.

Results of (a) sample-wise classification and (b) subject-wise classification of BiLSTM_ATTN. The horizontal axis represents the predicted labels, and the vertical axis represents the true labels. Each cell displays the classification accuracy as a percentage and the corresponding number of correctly classified samples (in parentheses). Darker shades indicate higher classification accuracy, and lighter shades represent lower accuracy.
In the sample-wise evaluation, classification accuracy exceeded 90% for N, IT, Fore, Drop, and CD, while EE and EI achieved over 80%. OT and Flat were classified with relatively lower accuracy, scoring approximately 68% and 74%, respectively.
In the subject-wise evaluation, no misclassifications were observed for N, EE, Fore, Drop, and CD. However, one subject from IT was misclassified as EE, and one from Flat was incorrectly predicted as Fore. Additionally, two OT subjects were misclassified as N and EE, while three EI subjects were predicted as N and Fore.
Ablation study on different combinations of feature types
The BiLSTM_ATTN model, one of the best-performing models for classifying abnormal gaits, was used for the ablation study. Table 4 summarizes the metric scores achieved by each feature combination.
Metrics subject-wise classification on different subsets of features.

Note: #, the number of components in feature set; T, temporal parameters; P, statistical parameters extracted from pressure signals; CoP,statistical parameters extracted from center of pressure data; IMU, statistical parameters extracted from inertial measurement unit data.
For individual feature sets, the model trained on IMU data achieved the highest F1-score of 0.86, followed by CoP, P, and T. When combining two feature sets, incorporating CoP with IMU slightly improved performance, reaching an F1-score of 0.90. Among the combinations of three feature sets, using T, P, and IMU yielded the highest classification performance. However, the best result in classifying abnormal gaits was achieved using all feature sets, with an F1-score of 0.92.
The results indicate that feature set selection strategies that were tailored to the classification task were crucial. Although certain feature combinations may excel in one classification scenario, a holistic approach that encompasses diverse feature modalities proved to be advantageous in capturing the patterns inherent in the dataset.
Discussion
This study focused on identifying nine gait types using deep sequential models and determining which feature domains contribute most to the classification task. The best-performing models, BiLSTM_ATTN and GRU_ATTN, achieved F1-scores of 0.89 in the sample-wise evaluation and 0.92 in the subject-wise evaluation. The ablation study demonstrated that using features from all four domains yielded significantly better results compared to other feature set combinations. This study also validated the data collected from the smart insole device, confirming its reliability for gait analysis.
The insole devices utilized for data collection have not yet been validated, therefore, we conducted a comparative analysis using two external gait measurement systems: A commercial insole-based system (Insole3, Moticon GmbH, Munich, Germany)31–33 and a marker-based MoCap system (MAC, Santa Rosa, CA, USA).
To assess the accuracy of gait event detection, we analyzed HS and TO timings. The Moticon insole system was used as a reference for comparison across nine participants, each performing a 15 m walking trial at both usual and fast speeds. To ensure synchronized measurement of pressure signals, both insoles were overlapped inside the participants’ shoes during data collection.
Additionally, a validation analysis was conducted using a MoCap system. Reflective markers were attached to the toe, heel, and ankle, and gait events were manually identified based on kinematic trajectory data. Three participants performed a 4-meter walking trial at both usual and fast speeds in a controlled MoCap environment.
A summary of the mean absolute error (MAE) and mean absolute percentage error (MAPE) for gait event detection across different validation methods is presented in Table 5.
Summary statistics of MAE and MAPE for gait events.

Note: MAE: mean absolute error;MAPE: mean absolute percentage error;SD: standard deviation; HS: heel strike; TO: toe-off. All values for MAE are reported in seconds (s), and MAPE values are expressed as percentages (%).
Through these validation analyzes, we confirmed the reliability of the insole device used in our study, demonstrating its comparability to the commercial Moticon system. These findings provided a strong rationale for selecting this device for our research.
The evaluation of sequential network-based models in the context of abnormal gait classification has yielded insights into their performance and potential implications for clinical applications. Among the ten models assessed, BiLSTM_ATTN and GRU_ATTN emerged as the top performers, demonstrating high performance across both sample-wise and subject-wise classifications. For IT, EE, Flat, and Fore gaits, features from certain pressure sensors may have played a key role in distinguishing these gait patterns. Since these gaits require concentrated pressure on particular foot regions to be performed, the model’s ability to capture these pressure distributions likely contributed to their accurate classification. Meanwhile, Drop and CD gaits, which involves substantial dynamic movement, may have been effectively classified with features extracted from IMU data. To examine the statistical differences in the extracted features for each gait type, refer to Table 1 in the supplementary materials. These findings underscore the efficacy of deep sequential models in effectively capturing the intricate temporal dependencies inherent in gait data. Moreover, the incorporation of attention mechanisms slightly enhanced their performance by allowing the models to focus on relevant features. However, despite their overall success, the models encountered challenges in accurately predicting labels of OT and EI. This may have derived from the location of the pressure sensors. As illustrated in Figure 1, the sensors are predominantly located on the outer side of the midfoot, potentially limiting the model’s ability to capture pressure distribution patterns critical for distinguishing these particular gait types. Given that OT and EI gaits may involve unique force dynamics across the inner regions of the foot, the sensor configuration might have provided insufficient data on those areas, thereby complicating the classification.
Future improvements could include enhancing sensor coverage across the entire foot or incorporating additional modalities such as high-resolution plantar pressure mapping to better capture subtle variations in pressure distribution for more accurate classification.
The ablation study, designed to evaluate the impact of different feature combinations on abnormal gait classification, provided valuable insights into the relative contributions of temporal parameters, statistical features from pressure signals, CoP, and IMU data.
Using only temporal parameters yielded the lowest F1-score of 0.43, suggesting that most gait types exhibited minimal variations in gait events. This low performance could have stemmed from the inherent similarity of gait types which confounds the model. The gait types barely differs in temporal information which obviously makes the model trained on these features less capable of capturing the key factors. In contrast, IMU data alone resulted in an F1-score of 0.86, outperforming all other single-feature sets. IMU data, which captures kinematic information during both the stance and swing phases, might have offered a more comprehensive representation of movement dynamics. Gait types such as Drop and CD involved substantial variations in swing phase dynamics, which the IMU sensors can effectively detect, which led to improved classification performance. Combining CoP and IMU features yielded the highest performance among two-feature combinations with an F1-score of 0.90. This combination seems to complemented one another in which IMU data captured kinematic movement while CoP provided positional information during the stance phase. A slight improvement of the performance over IMU alone suggests that the addition of CoP data assisted in refining the ability of the model to differentiate subtle gait patterns.
Combinations such as T_IMU and P_IMU exhibited performance comparable to IMU alone, suggesting the inclusion of temporal and pressure features had minimal influence on classification ability. Among three-feature combinations, T_P_IMU achieved the highest performance. However, the addition of T or P to the CoP_IMU combination resulted in a decline in performance, indicating a potential negative impact of these features on the overall classification outcome.
A common observation from the study was the substantial influence of IMU features on model performance. For example, the difference in F1-scores between T_P and T_P_IMU was 0.30, while the gap between T_P_CoP and T_P_CoP_IMU was 0.36. This highlights the dominant role of IMU data in contributing to classification performance.
Ultimately, the use of all four feature sets (T_P_CoP_IMU) produced the best overall results, with an F1-score of 0.92. This outcome underscores the importance of integrating a comprehensive set of features to achieve optimal classification performance. The incorporation of multiple feature domains allowed the model to capture a wider range of gait characteristics, resulting in more accurate differentiation of abnormal gait patterns.
However, it is essential to acknowledge the inherent limitations of the ablation study, where the study utilizes data obtained from simulated conditions rather than real-world patients. While the data collection was conducted in a controlled environment, they may not fully capture the complexities and nuances present in real-world gait patterns exhibited by patients with abnormal gait. Consequently, the generalizability and applicability of the findings to clinical settings may be bounded. Another overarching limitation is that the tested participants involved only Koreans in this study. There is a chance that the data collected biased to particular race, making it challenging to generalize the model towards non-Koreans.
Future research should prioritize the collection and analysis of data from real-world patients to ensure the validity and robustness of abnormal gait classification models in clinical practice. Furthermore, following study should involve obtaining samples from the subjects of diverse range of races.
The evaluation of sequential network-based models has provided valuable insights into their performance and potential implications for abnormal gait classification. While the study shows promising outcomes, continued research efforts are warranted to address the identified limitations and foster the development of robust classification models for gait analysis.
Conclusion
This study proposed a method for identifying abnormal gait types based on combined features each of which from different terrains. The deep sequential network-based classifiers, especially the one that was incorporated with attention mechanism, trained on sequences of the gait features presented high performance in classifying one normal gait and eight different abnormal gait types which implies their ability to capture subtle variations in gait patterns. These findings underscore the potential of deep learning techniques, coupled with comprehensive feature engineering, to improve the detection and classification of abnormal gait. These findings could contribute to clinical applications by detecting abnormal gait types, which may enhance patient assessment, facilitate early diagnosis, and inform personalized intervention strategies.
Supplemental Material
sj-docx-1-dhj-10.1177_20552076251332999 - Supplemental material for Smart insole-based abnormal gait identification: Deep sequential networks and feature ablation study
Supplemental material, sj-docx-1-dhj-10.1177_20552076251332999 for Smart insole-based abnormal gait identification: Deep sequential networks and feature ablation study by Beomjoon Park, Minhye Kim, Dawoon Jung, Jinwook Kim and Kyung-Ryoul Mun in DIGITAL HEALTH
Footnotes
Acknowledgement
The authors express their gratitude to SALTED Co., Ltd. for providing the smart insoles used in this study.
Ethical approval
This study was conducted with the approval of the Institutional Review Board (IRB No.KIST
Author contributions
Beomjoon Park contributed to the conceptualization, formal analysis, methodology, investigation, and writing of the original draft. Minhye Kim was involved in data curation and investigation. Dawoon Jung and Jinwook Kim participated in methodology development and supervision of the research activities. Kyung-Ryoul Mun, as the corresponding author, oversaw the overall project execution, provided supervision, and contributed to the writing and revision of the manuscript.
Conflicting interests
The authors declared no potential conflicts of interest with respect to the research, authorship, and/or publication of this article.
Funding
The authors disclosed receipt of the following financial support for the research, authorship, and/or publication of this article: This research was supported in part by the Korea Medical Device Development Fund grant funded by the Korea government (the Ministry of Science and ICT, the Ministry of Trade, Industry and Energy, the Ministry of Health Welfare, the Ministry of Food and Drug Safety) (Project No. RS-2020-KD000101) and the Korea Institute of Science and Technology Institutional Program (Project No. 2E33841).
Supplemental material
Supplemental material for this article is available online.
References
Supplementary Material
Please find the following supplemental material available below.
For Open Access articles published under a Creative Commons License, all supplemental material carries the same license as the article it is associated with.
For non-Open Access articles published, all supplemental material carries a non-exclusive license, and permission requests for re-use of supplemental material or any part of supplemental material shall be sent directly to the copyright owner as specified in the copyright notice associated with the article.