
Abstract
Objective
Aiming at the problems of the long incubation period, insufficient early diagnosis, and lack of treatment methods of coal workers’ pneumoconiosis (CWP), the objective of this study is to accurately predict the CWP staging based on machine learning (ML) methods and small-sample clinical data.
Methods
The study included a comparative analysis of clinical data from 202 healthy individuals and 81 CWP patients at general Hospital of Xuzhou Mining Group. Firstly, various oversampling techniques were employed to address the issue of data imbalance. Subsequently, multiple ML methods were adopted for supervised learning and prediction of CWP staging. Then, an innovative feature selection method was proposed, integrating the importance and independence of clinical features to achieve high-precision predictions of CWP with a limited number of indicators.
Results
The study identified ALB, PLT, and WBC as significant predictive factors for CWP through the Random Forest importance assessment method. Furthermore, in terms of integrated feature selection, when the weight ratio of feature importance to independence was 7:3 or 6:4, all ML models showed optimal performance, with the Random Forest (RF)-Adaboost model demonstrating the best predictive accuracy for CWP, reaching a F1 score of 0.8757.
Conclusions
The integration of clinical biochemical examination data with ML models, especially the RF-Adaboost and support vector machine-particle swarm optimization models, effectively predicted the staging of CWP. The proposed integrated feature selection method, which considered both the importance and independence of features, significantly enhanced model performance, providing a valuable tool for early screening and diagnosis of CWP.
Introduction
Pneumoconiosis, as the most common occupational disease worldwide, has long been a focus of attention in the field of public health. 1 Due to the differences in the composition of inhaled dust, pneumoconiosis has many classifications, of which coal workers’ pneumoconiosis (CWP) is a type of occupational disease caused by long-term inhalation of coal dust particles, leading to their retention in the lungs and the primary occupational disease characterized by pulmonary fibrosis. 2 The disease has a certain latency, a high mortality rate, and causes irreversible damage to the lungs. 3 Up to now, there is no effective treatment for CWP but its early screening and diagnosis are crucial for preventing the treatment of further deterioration of the patient's condition. 4 According to the occupational pneumoconiosis diagnostic guidelines proposed by the International Labour Organization, high-kV chest X-ray is the gold standard for the diagnosis of pneumoconiosis. 5 Currently, the diagnosis of CWP predominantly relies on the assessment by professional doctors who classify and stage the condition based on the profusion and distribution of opacities observed on chest X-ray films. The staging of CWP helps doctors understand the patient's condition, guiding them to propose suitable treatment and prevention strategies. Generally, according to the severity of film reading, CWP patients are divided into stage I, stage II, and stage III. 6 However, the diagnostic and staging process is susceptible to subjective factors such as the experience of doctors, potentially resulting in misdiagnosis. 7 In recent years, computer-aided detection technology has been widely used to improve the accuracy of CWP diagnosis by clinical doctors,8–11 but it must be noted that this auxiliary diagnosis scheme requires significant time investment for doctors to manually define features, 12 which is not suitable for complex pneumoconiosis staging tasks and hinders the early screening of CWP for frontline workers.
In addition to chest X-ray, integrating metabolomics into CWP prediction studies provides new opportunities for identifying biomarkers associated with CWP. Metabolomics, as a rapid and precise diagnostic method, holds significant potential for the early detection of CWP.13,14 Among the biomarkers, serum levels of cytokines such as TGF-β, MCP-1, 15 interleukin-8, intercellular adhesion molecule-1, 16 IL-13, IL-18R, matrix metalloproteinase-9 (MMP-9), and matrix metalloproteinase inhibitor-9 17 have been confirmed to be closely related to the disease progression of CWP patients. Meanwhile, serum lipid metabolites such as phosphatidylethanolamine, 18 phosphatidylcholine, and lysophosphatidylcholine (lysopcs) 19 also play a crucial role in guiding clinical diagnoses of pneumoconiosis. In recent years, the application of machine learning (ML) technology in the biomedical field has been increasing, demonstrating tremendous potential in improving the accuracy of disease diagnosis, the formulation of personalized treatment plans, and the development of new drugs. 20 The combination of ML and metabolomics enables the processing and analysis of high-throughput metabolomic data, thereby more rapidly and accurately identifying and screening biomarkers associated with specific diseases. In order to find biomarkers for CWP, Chen et al. 19 combined metabolomics technology with ML methods to screen biomarkers in the serum of CWP patients. After adjusting for age, smoking, drinking, and other factors, three ML methods were used to screen out the potential biomarker of CWP as propylparaben from 68 different metabolites. Chen et al. 21 combined lipidomics with ML methods to detect the serum of CWP patients and found that lipid metabolites represented by AHEXCER, DG, and DMPE may be good biomarkers of CWP. To further understand the application of clinical indicators in pneumoconiosis diagnosis, Dong et al. 22 used embedded methods to select 62 clinical indicators and predict early CWP by combining three feature selection methods with five ML models. The results show that AaDO2 and some lung indexes are critical in identifying the prediction of early CWP, and in this study, the support vector machine (SVM) algorithm is found to be the best ML model for predicting CWP. Compared with chest X-ray, it is more convenient to detect changes in serum biomarker content. However, it should be noted that metabolomic-based biomarker detection is costly and is not conducive to the routine screening of CWP in mine workers.
Routine biochemical tests are widely used in clinical practice because of their low cost, easy access, and high accuracy. 23 Studies have shown that combining these tests with ML can provide important guidance for disease prediction. 24 For example, Cai et al. 25 systematically evaluated the value of routine laboratory tests, including blood routine tests, coagulation tests, and urine tests, in the diagnosis of ovarian cancer, and combined with ML to develop an AI-assisted diagnostic model based on multiple test indicators. However, in the staging prediction of CWP, ML is mostly based on chest X-ray and metabolomics, while there are few studies based on routine biochemical examination. To enable an earlier, more accurate, and cost-effective assessment of the health status of patients with CWP, this article proposed an innovative method for evaluating the stage of CWP. This approach combined routine biochemical tests (blood routine, liver function, renal function, blood glucose, blood lipid) with ML algorithms to develop more effective treatment and prevention strategies. Additionally, to comprehensively consider the multifaceted effects of clinical data and improve the accuracy of evaluation, a multi-metric integrated feature selection method was proposed. By comparing the performance of different ML algorithms, key features that had a significant impact on CWP staging were identified, and the most effective CWP staging prediction model was found to achieve early prediction of CWP.
Our main contributions are summarized as follows. Firstly, we addressed the challenge of unbalanced data distribution inherent in the clinical dataset through dedicated data preprocessing techniques. Secondly, we conducted dimensionality reduction using various feature selection methods (including importance-based, correlation-based, and integrated approach we proposed) to identify the most discriminative variables for CWP staging. Subsequently, we determined the optimal ML model configuration for prediction.
Methods
Patients source and clinical data collection
The study was approved by the Medical Ethics Committee ([2022]-101501) and selected 81 patients with pneumoconiosis hospitalized in Xuzhou Mining Group General Hospital from 28 June 2022 to 13 July 2023, as well as 202 healthy individuals who underwent physical examinations at the hospital from 12 January 2024 to 24 May 2024. The inclusion criteria were as follows: 1) age between 40 and 90 years; 2) all male; 3) the examination report included common demographic and routine biochemical indicators, such as blood lipid tests including triglycerides, total cholesterol, high-density lipoprotein cholesterol, low-density lipoprotein cholesterol, and very low-density lipoprotein cholesterol; 4) those who provided informed consent for the study. By combining the intersection of routine biochemical examination indicators from healthy individuals and clinical test indicators from pneumoconiosis patients, the most common 22 typical biochemical examination indicators were selected as sample data, which are detailed in Table 1.
Indicators of routine biochemical examination.

Data processing
In the diagnosis and prediction of diseases, there is often a problem of category imbalance between the healthy and the affected population. 26 This imbalance can lead to classification models misclassifying the minority class (diseased individuals) as the majority class (healthy individuals), which affects the accuracy of the model and may cause patients to miss the best treatment opportunities. Based on the clinical data we collected, the proportion of CWP patients at stages II and III was only 7.4% and 2.1%, respectively. This indicated a significant imbalance in the data distribution, with the majority of patients concentrated in stage I. To address this challenge and ensure robust model performance on minority classes, we employed specific data handling and evaluation strategies.
Given the limited size of the dataset (original distribution: Phase 0: 202, Phase I: 54, Phase II: 21, Phase III: 6, total 283 cases), rigorous data processing and model evaluation strategies were employed. Initially, given the extremely limited number of Phase III cases, which posed a significant challenge for reliable classification, CWP Phase III data were merged into the CWP Phase II category, resulting in a revised class distribution (Phase 0: 202, Phase I: 54, Phase II: 27). Despite this merger, the dataset still presented a considerable class imbalance. Therefore, to ensure robust model evaluation on this limited and imbalanced data, and crucially, to prevent data leakage during resampling techniques, we adopted a Stratified 5-fold Cross-Validation approach. In each fold, the dataset was stratified split into a training set and a test set, ensuring similar class distribution proportions to the original data within both splits. To mitigate the class imbalance within the training set of each fold, resampling techniques were applied, broadly categorized into undersampling and oversampling. Undersampling methods reduce the number of majority class samples, while oversampling methods increase the number of minority class samples. Common oversampling methods mainly include synthetic minority oversampling technique (SMOTE) and adaptive synthesis (ADASYN). 27 Synthetic minority oversampling technique generates new sample points by interpolating between the nearest neighbors of a few class samples, while ADASYN generates more new samples in the feature space regions of a few classes with lower data density, and fewer new samples in the regions with higher density. In this study, we employed a combined resampling strategy: firstly, random undersampling was applied to the majority class (Phase 0) in the training set to reduce its sample count. Subsequently, one of the oversampling techniques (either SMOTE or ADASYN) was applied to the undersampled training set to balance the representation of classes 0, 1, and 2. This entire resampling process, including both undersampling and oversampling, was strictly confined to the training data of each fold. The final reported metrics represent the average performance across the 5 folds, including specific evaluation measures (Precision, Recall, F1-score) for each individual class, in addition to macroaveraged and overall metrics.
Machine learning method
As a major branch of artificial intelligence, ML is usually divided into two categories: supervised learning and unsupervised learning. 28 Since this study was based on labeled clinical data to build a pneumoconiosis staging prediction model, Random Forest (RF), SVM, K-Nearest Neighbor (KNN), and Decision Tree (DT) were selected as the basic models.
Random Forest, renowned for its robustness and accuracy, is a prevalent ensemble learning method. However, it can exhibit diminished sensitivity to underrepresented classes, potentially impairing classification performance. 29 To address this limitation, we integrated the Adaboost algorithm into our model training process. Adaboost enhances classification by iteratively training weak classifiers to focus on misclassified instances, thereby refining the overall classifier's accuracy. 30 This method is particularly applied during the Model Training phase of the RF algorithm, as shown in Figure 1, where the specific optimization mechanism was delineated.

RF optimization mechanism of Adaboost algorithm. This figure illustrates the steps from Data Preparation and setting up the RF model parameters (defining base weak learners) to the iterative Adaboost procedure. Adaboost iteratively trains these weak RF learners, adaptively adjusting sample weights based on misclassification errors in each step, thereby enhancing the overall classifier's performance and yielding the final optimized classifier. RF: Random Forest.
Support Vector Machine performs well in the case of small sample size and has good generalization ability but its performance largely depends on the choice of parameters, such as penalty parameter c and kernel function parameter g. Traditionally, the selection of the best parameters for SVM is a manual process that involves time-consuming methods like grid search, which can be quite cumbersome and inefficient. 31 Conversely, Particle Swarm Optimization (PSO) is an evolutionary algorithm that leverages population-based cooperation and information exchange to rapidly converge to an optimal solution. 32 Integrating PSO with SVM facilitates an efficient stochastic search for the optimal parameters c and g within a predefined search space, thereby enhancing SVM's parameter optimization process and making up for its limitations. The specific optimization mechanism is shown in Figure 2.

SVM optimization mechanism of PSO algorithm. This figure illustrates the steps from Data Preparation and setting up the SVM model parameters (specifically c and g) to the iterative PSO procedure. PSO iteratively updates particle positions based on fitness evaluations in each step, adaptively searching the parameter space for optimal c and g values, thereby enhancing the overall model's performance and yielding the final optimized SVM model. PSO: Particle Swarm Optimization; SVM: support vector machine.
Evaluation metrics
To ensure a comprehensive and reliable evaluation of the ML models for this multiclass classification task with imbalanced data distribution, multiple performance metrics derived from the confusion matrix were employed, because reliance solely on overall accuracy can be misleading in such scenarios. The evaluation metrics33–36 used and their corresponding formulas are as follows:


where TP (True Positive) refers to the number of instances correctly predicted as belonging to that class; TN (True Negative) refers to the number of instances correctly predicted as not belonging to that class; FP (False Positive) refers to the number of instances incorrectly predicted as belonging to that class; and FN (False Negative) refers to the number of instances incorrectly predicted as not belonging to that class.
Although resampling techniques were applied to the training data to mitigate class imbalance during training, model performance was evaluated on the test set in each fold, which reflects the original data distribution. Therefore, this study primarily reports the Macro F1 Score. The Macro F1 Score is computed by calculating the F1 Score for each individual class (0, 1, and 2), and then taking their unweighted arithmetic average:
This approach provides a more reliable metric for measuring the model's overall performance in handling classification tasks that involve class imbalance by giving equal importance to the performance on each class.
Integrated feature selection method
To consider both feature importance and its relationship with other features, we introduced an innovative integrated approach to assess each feature variable based on a comprehensive evaluation of its impact on the model.
Initially, to assess feature importance, we averaged the scores obtained from multiple evaluations using the RF algorithm. Subsequently, to quantify feature independence, we calculated the average of the absolute values of its Spearman correlation coefficients with all other features in the dataset. A higher feature independence value indicates stronger average correlation with other features, implying lower independence and a higher risk of introducing multicollinearity. Thereafter, we combine them into a single score y for ranking and selection. The detailed formula is as follows:
where ω1+ω2 = 1 and x1 represents the importance value while x2 represents the independence value.
The higher the importance value, the greater the contribution to the model's prediction, positively affecting the model performance, so features corresponding to high-importance values should be retained whenever possible. Conversely, the higher the independence value, the more pronounced the multicollinearity among variables, which negatively impacts the model's prediction, thus features corresponding to high independence values should be eliminated whenever possible.
44
Therefore, we modify the aforementioned linear model to
Then, to investigate the impact of different weightings, 9 weight combinations were assigned. For each weight combination, the combined score was calculated for all 22 features, and based on the calculated y scores to exclude those ranked with the lowest scores. Finally, the remaining feature subsets were subsequently utilized for model training and evaluation.
To sum up, the overall technical route of this study is depicted in Figure 3.

Technical route of machine learning-based CWP classification. This figure illustrates the sequence of steps including Data Processing (using SMOTE and ADASYN for imbalanced data), Feature Selection (evaluating importance by RF, independence by correlation and an integrated linear model combining both importance and independence), Model Selection (training various models including RF, SVM, DT, KNN, RF-Adaboost, SVM-PSO on the selected features), and Model Evaluation (using Accuracy, Precision, Recall, and F1-score metrics). ADASYN: adaptive synthesis; CWP: coal workers’ pneumoconiosis; DT: Decision Tree; KNN: K-Nearest Neighbor; RF: Random Forest; SMOTE: synthetic minority oversampling technique; SVM: support vector machine; SVM-PSO: support vector machine-particle swarm optimization.
Results
Results of oversampled balanced data on various ML models
The combined prediction results of two oversampling methods and six ML models are shown in Table 2. This table presents the average Accuracy, Macro Precision, Macro Recall, and Macro F1 Score obtained from the 5-fold cross-validation for each model on the same datasets. The results showed that model performance varied depending on the oversampling method used. For clarity and conciseness throughout this article, including Table 2 and all subsequent tables, the best average value for each performance metric is highlighted in bold, and the second best is underlined. Furthermore, the metrics will be referred to as Accuracy, Precision, Recall, and F1 score in the following text.
Classification results of each model under oversampled data.
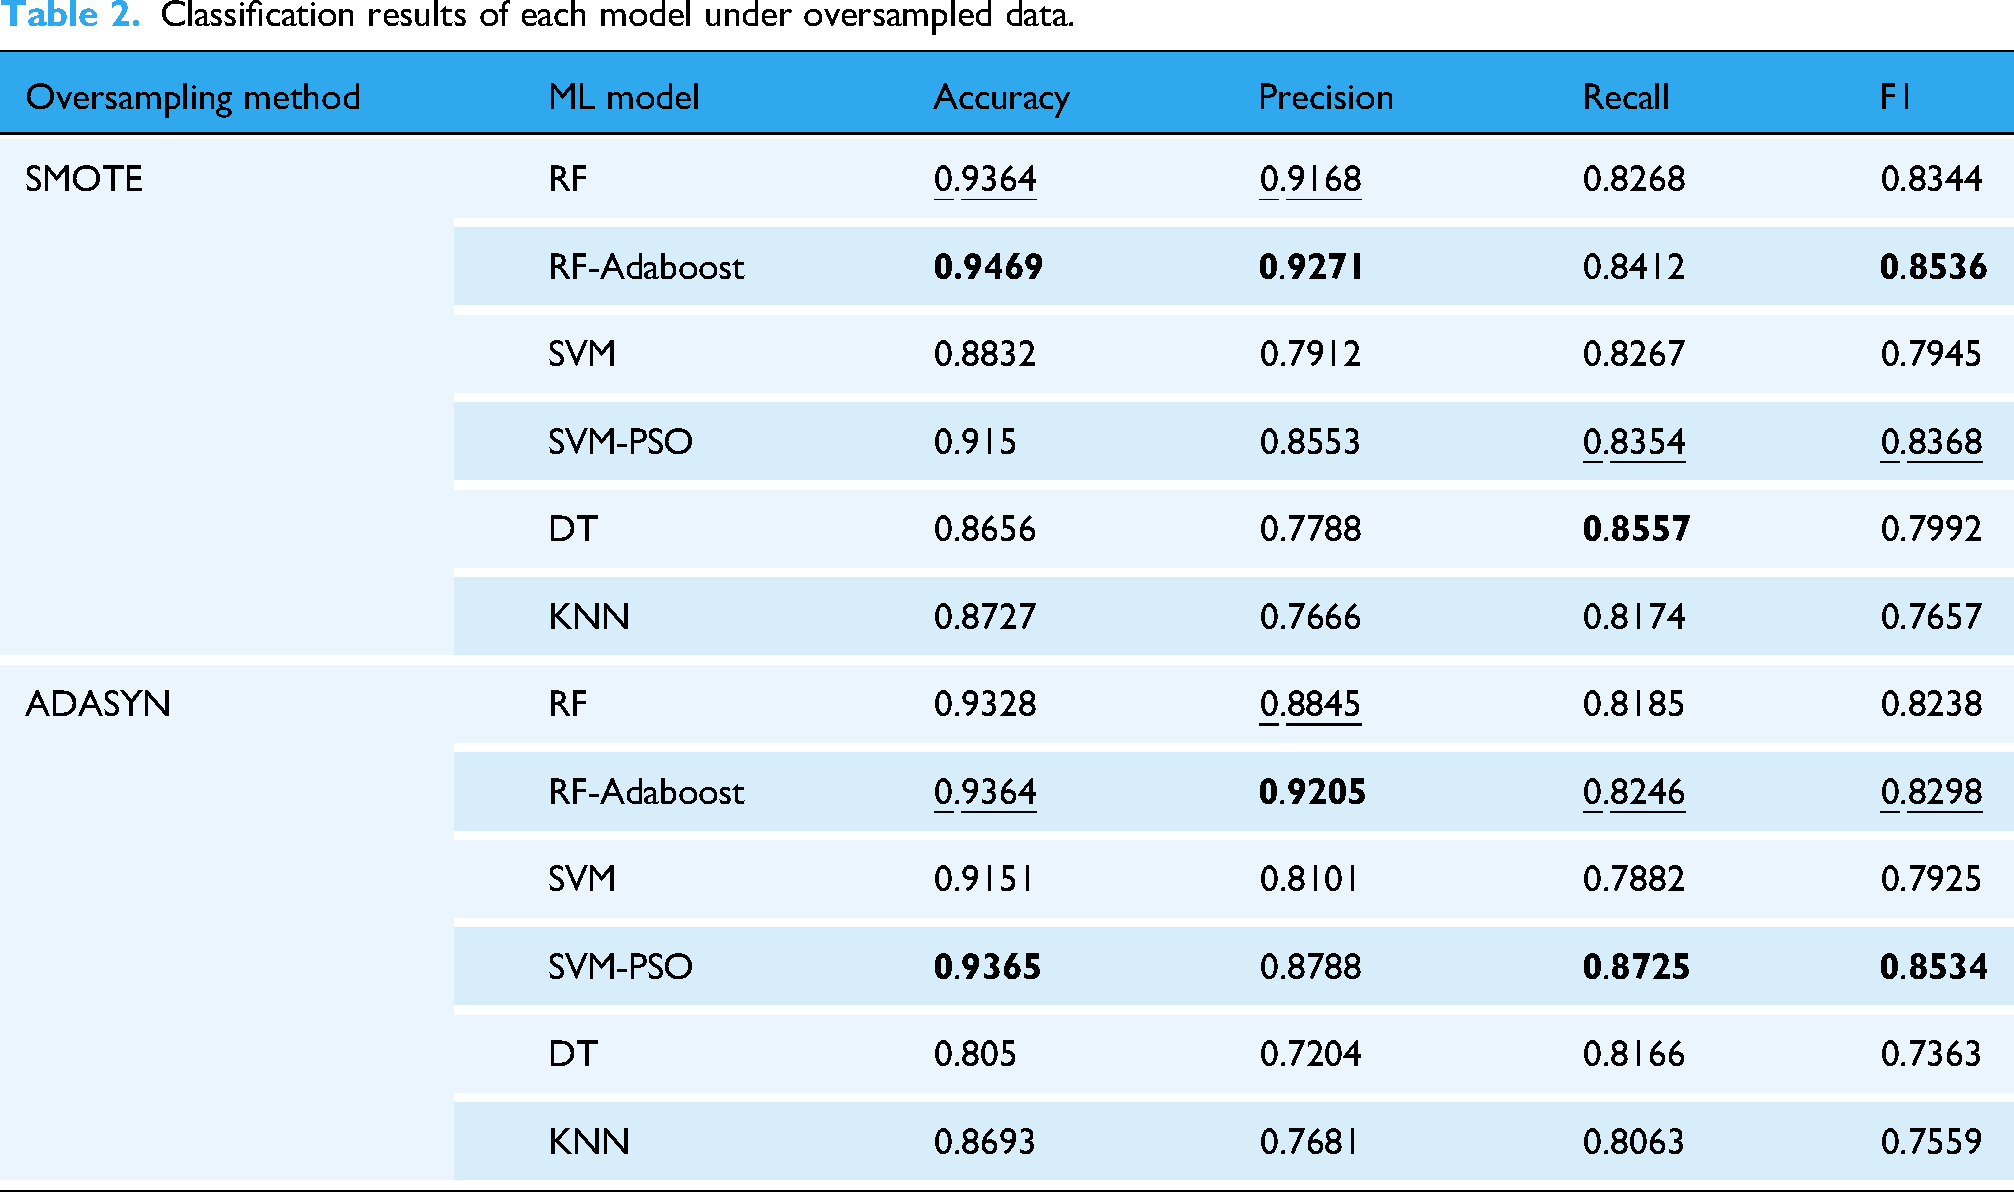
On the SMOTE dataset, RF-Adaboost demonstrated the best performance, achieving the highest Accuracy (0.9469), Precision (0.9271), and F1 score (0.8536). Given the importance of accurately identifying early stages of CWP (Class 0 and 1), we further examined the per-class performance of the RF-Adaboost model on the SMOTE dataset. For Class 0, the Precision, Recall, and F1 scores were 0.9807, 0.9951, and 0.9878, respectively. For Class 1, these metrics were 0.8756, 0.9418, and 0.9024. Conversely, KNN exhibited the worst performance with the lowest F1 score (0.7657).
Similarly, on the ADASYN dataset, SVM-PSO performed best, achieving the highest Accuracy (0.9365), Recall (0.8725), and F1 score (0.8534). For Class 0, SVM-PSO achieved average Precision, Recall, and F1 scores of 0.9847, 0.9605, and 0.9723, respectively. For Class 1, the average scores were 0.9223, 0.9636, and 0.9396. However, DT had the worst performance with the lowest F1 score (0.7363). By comparing the two datasets, it was found that except for SVM-PSO, the other 5 models had slightly better performance indicators on the SMOTE dataset than the ADASYN dataset. In addition, SMOTE is more widely used than ADASYN in clinics, 37 so the subsequent study in this article will be based on the SMOTE oversampling data set.
Further visualization of the performance results of oversampling on six ML models is presented in Figure 4. The figure showed that the optimized RF-Adaboost and SVM-PSO had significantly improved compared with the four evaluation indicators before optimization, which indicated that the optimized model made up for the shortcomings of the original model, thereby improving the performance. In addition, the indexes of RF, RF-Adaboost, and SVM-PSO on the two oversampling datasets all reached more than 0.8, indicating that these three models were better than the other three models.

Performance indicators of the models under different oversampling methods. (a) Performance indicators under SMOTE; (b) performance indicators under ADASYN. ADASYN: adaptive synthesis; SMOTE: synthetic minority oversampling technique.
When employing ML for predictive analytics, the primary concern is the model's generalization capability, with the avoidance of overfitting being essential to preserving this capability. Overfitting refers to the phenomenon that the model fits the training data excessively well, leading to suboptimal performance on unseen data and thereby impairing the model's generalization performance. 38 Furthermore, existing research indicated that an increased number of input variables raises the risk of overfitting. 39 Consequently, to enhance model performance and generalization ability, our subsequent research will focus on an in-depth analysis of the input feature variables.
Feature selection based on importance analysis
Feature selection is a method to reduce the redundancy of a dataset while retaining the most valuable information for the target variable. This approach can not only improve the accuracy and generalization of the model but also reduce the risk of overfitting, and enhance the interpretability of the model. 40 This study included 22 features, and to identify those with a greater influence on the predicted target, we employed the RF importance criterion for feature selection.
Random forest importance assessment is an embedded method in feature selection. We combined the oversampled balanced data with the RF respectively for importance assessment. The importance of the 22-dimensional feature variables before feature selection is shown in Figure 5. The results showed that the top five characteristics that had the greatest influence on the stage of CWP were ALB, PLT, WBC, LDL, and ALC.

Importance evaluation of clinical features.
In this study, we selected features that ranked in the top 70% of importance as the variables after screening. Ultimately, 16 key features associated with the staging of CWP were identified. These features were then combined with six types of ML models as inputs for prediction. Additionally, since the F1 score is a weighted average of precision and recall, it can effectively measure the overlap of data between categories. 41 That is, the larger the F1 score, the better the classification performance of the model. Therefore, we used the F1 score to compare the performance before and after feature selection, with the comparative results presented in Table 3.
Results of feature selection based on importance assessment.

From the results in Table 3, we observed that the RF-Adaboost model achieved the best overall performance among the six models under this importance-based feature selection condition. To understand its effectiveness in identifying crucial early stages, we examined its per-class metrics. For Class 0, the Precision, Recall, and F1 scores were 0.9806, 0.9902, and 0.9852, respectively. And for Class 1, these metrics were 0.8509, 0.9236, and 0.8836.
Feature selection results based on correlation analysis.

Figure 6 shows the performance comparison before and after the feature selection more clearly. The results indicated a slight decrease in the performance metrics of the six models following feature selection, as assessed by the RF importance criterion when compared to the metrics obtained before feature selection.

Performance comparison between uncharacterized selection and selection based on importance features.
Feature selection based on correlation analysis
Feature selection was performed based solely on feature importance; however, a comparative analysis of model performance before and after the selection process unexpectedly indicated a decline in performance rather than an enhancement. Notably, this decline was particularly significant for the SVM and KNN models, with performance decrements of 4.03% and 3.17%, respectively. Given that these algorithms fundamentally rely on distance-based classification, they are highly sensitive to spatial distribution and feature continuity. 42 The observed decrease in performance suggests that feature selection based on importance may have introduced discontinuities in the feature space. This is likely due to the removal of variables that are highly interrelated with the retained features, thereby impairing the model's capacity to capture the underlying patterns and resulting in a significant deterioration of performance.
On the other hand, considering that all input variables are derived from clinical data, we must address the common issue of multicollinearity in clinical medical research datasets. 43 Multicollinearity arises when two or more features are highly correlated, potentially leading to overfitting in the training process of ML models and consequently impairing their predictive performance. To assess the impact of feature intercorrelation on model efficacy, we performed a correlation analysis using SPSS software on the 22 input features. The resulting correlation coefficients were visualized in a heatmap, as depicted in Figure 7.

Correlation heat maps among CWP characteristic variables. This figure illustrates the Spearman correlation coefficients among the 22 CWP characteristic variables used in the study. The color scale maps positive correlations toward blue (closer to +1) and negative correlations toward red (closer to −1), with color intensity indicating the magnitude. Numerical correlation values are displayed in each cell. CWP: coal workers’ pneumoconiosis.
Figure 7 shows significant correlations between certain variables, such as the correlation between RBC and HB. To investigate the potential impact of these strong correlations on model performance, we established an absolute threshold of 0.7 for the correlation coefficient to screen variable pairs. After screening, the following eligible feature pairs were TG and VEDL(r = 0.71), CHOL and LDL (r = 0.931), HB and RBC (r = 0.899), GLB and the A/G ratio (r = 0.852), ANC and WBC (r = 0.828), and ALT and AST (r = 0.724).
To eliminate the influence of strong correlation between variables and obtain the highest accuracy with the least number of indicators, we arranged and combined these six feature pairs to obtain a total of 64 feature combinations that need to be eliminated. Then, six features contained in each combination were removed from the original data set to create 64 new datasets. Each dataset was then subjected to ML models to assess predictive performance, with the one showing the worst performance identified as the deleted dataset 1, and the best as the deleted dataset 2. Among them, the features excluded from the deleted dataset 1 included TG, CHOL, RBC, GLB, WBC, and ALT, while the features excluded from the deleted dataset 2 included VEDL, LDL, HB, A/G, ANC, and AST. The predictive outcomes of these two datasets in conjunction with six ML models are detailed in Table 4 and visualized in Figure 8.

Performance comparison between uncharacterized selection and feature selection based on correlation.
Features selection results based on comprehensive importance and correlation.

The results indicated that the F1 scores for the deleted dataset 2 had improved when compared to the unprocessed counterpart. Notably, the SVM model demonstrated the most pronounced optimization effect, with a 2.47% enhancement in performance. And among the models evaluated with the deleted dataset 2, RF-Adaboost achieved the highest overall performance Examining its effectiveness on the critical early stages, the Precision, Recall, and F1 scores for Class 0 were 0.9805, 0.9951, and 0.9877, respectively. For Class 1, these metrics were 0.8509, 0.9236, and 0.8836. This finding showed that the strong intervariable correlation was one of the contributing factors to the variability in model performance. Consequently, further investigation into the strong correlations between variables and their impact on model performance was of great importance for optimizing the predictive capabilities of our models.
Furthermore, we observed that the performance of the deleted dataset 1 was inferior to that of the unprocessed dataset. This outcome indicated that the features removed from this dataset substantially contributed to the model's predictive capacity. Therefore, based on the current findings, we believe that during feature selection informed by correlation analysis, it is crucial to retain feature that were identified to be eliminated when their exclusion led to a degradation in model performance should be retained. Conversely, features that were removed from datasets leading to performance improvement should be eliminated. This strategy aimed to preserve the model's predictive accuracy at an optimal level.
Integrated feature selection method based on a comprehensive assessment of importance and correlation
Analysis of these nine subsets revealed that the resulting 16 feature subsets generated by different weight combinations were not all unique. Specifically, we found that some feature sets were identical for the weight combinations, including ω1:ω2 = 9:1/8:2, ω1:ω2 = 7:3/6:4, and ω1:ω2 = 4:6/3:7/2:8/1:9. Consequently, the nine weight combinations collectively resulted in four distinct feature subsets after excluding the bottom six features, which are successively labeled as Dataset 1 to 4. To determine under which weight combination the model performed optimally, we combined these datasets with 6 ML models for predictive analysis. The outcomes of these predictions are presented in Table 5.
Furthermore, to more clearly and intuitively visualize the performance changes across different datasets, a comparative visualization is shown in Figure 9.

Performance of data sets with different weight ratios on each model.
The analysis of the figure above revealed that Dataset 4, with its corresponding weight configurations ω1:ω2 = 4:6/3:7/2:8/1:9, had the worst performance across the six models based on the F1-score (average F1 ≈ 0.8056). Conversely, Dataset 2 with corresponding weight configuration ω1:ω2 = 7:3/6:4 showed the best overall performance based on F1-score (average F1 ≈ 0.8348). Notably, the RF-Adaboost model achieved the highest overall performance on Dataset 2, consistent with the findings for the other feature selection methods. Furthermore, compared to using uncharacterized selection, importance-based selection, and correlation-based selection methods, the F1 score for identifying early-stage Class 1 using RF-Adaboost under this combined approach improved by 1.66%, 3.54%, and 3.55%, respectively. This suggested that the specific set of 16 features retained in Dataset 2 provided the most effective contribution to the enhancement of model performance in terms of balancing precision and recall, while the feature set in Dataset 4 was less effective.
Additionally, to evaluate the performance efficacy of the six ML models using the innovative combined feature selection method relative to standard baseline approaches (using uncharacterized, importance-based, and correlation-based selection), F1-scores were compared (detailed in Figure 10). The analysis reveals distinct advantages of the combined method, particularly when represented by its best-performing subset Dataset 2.
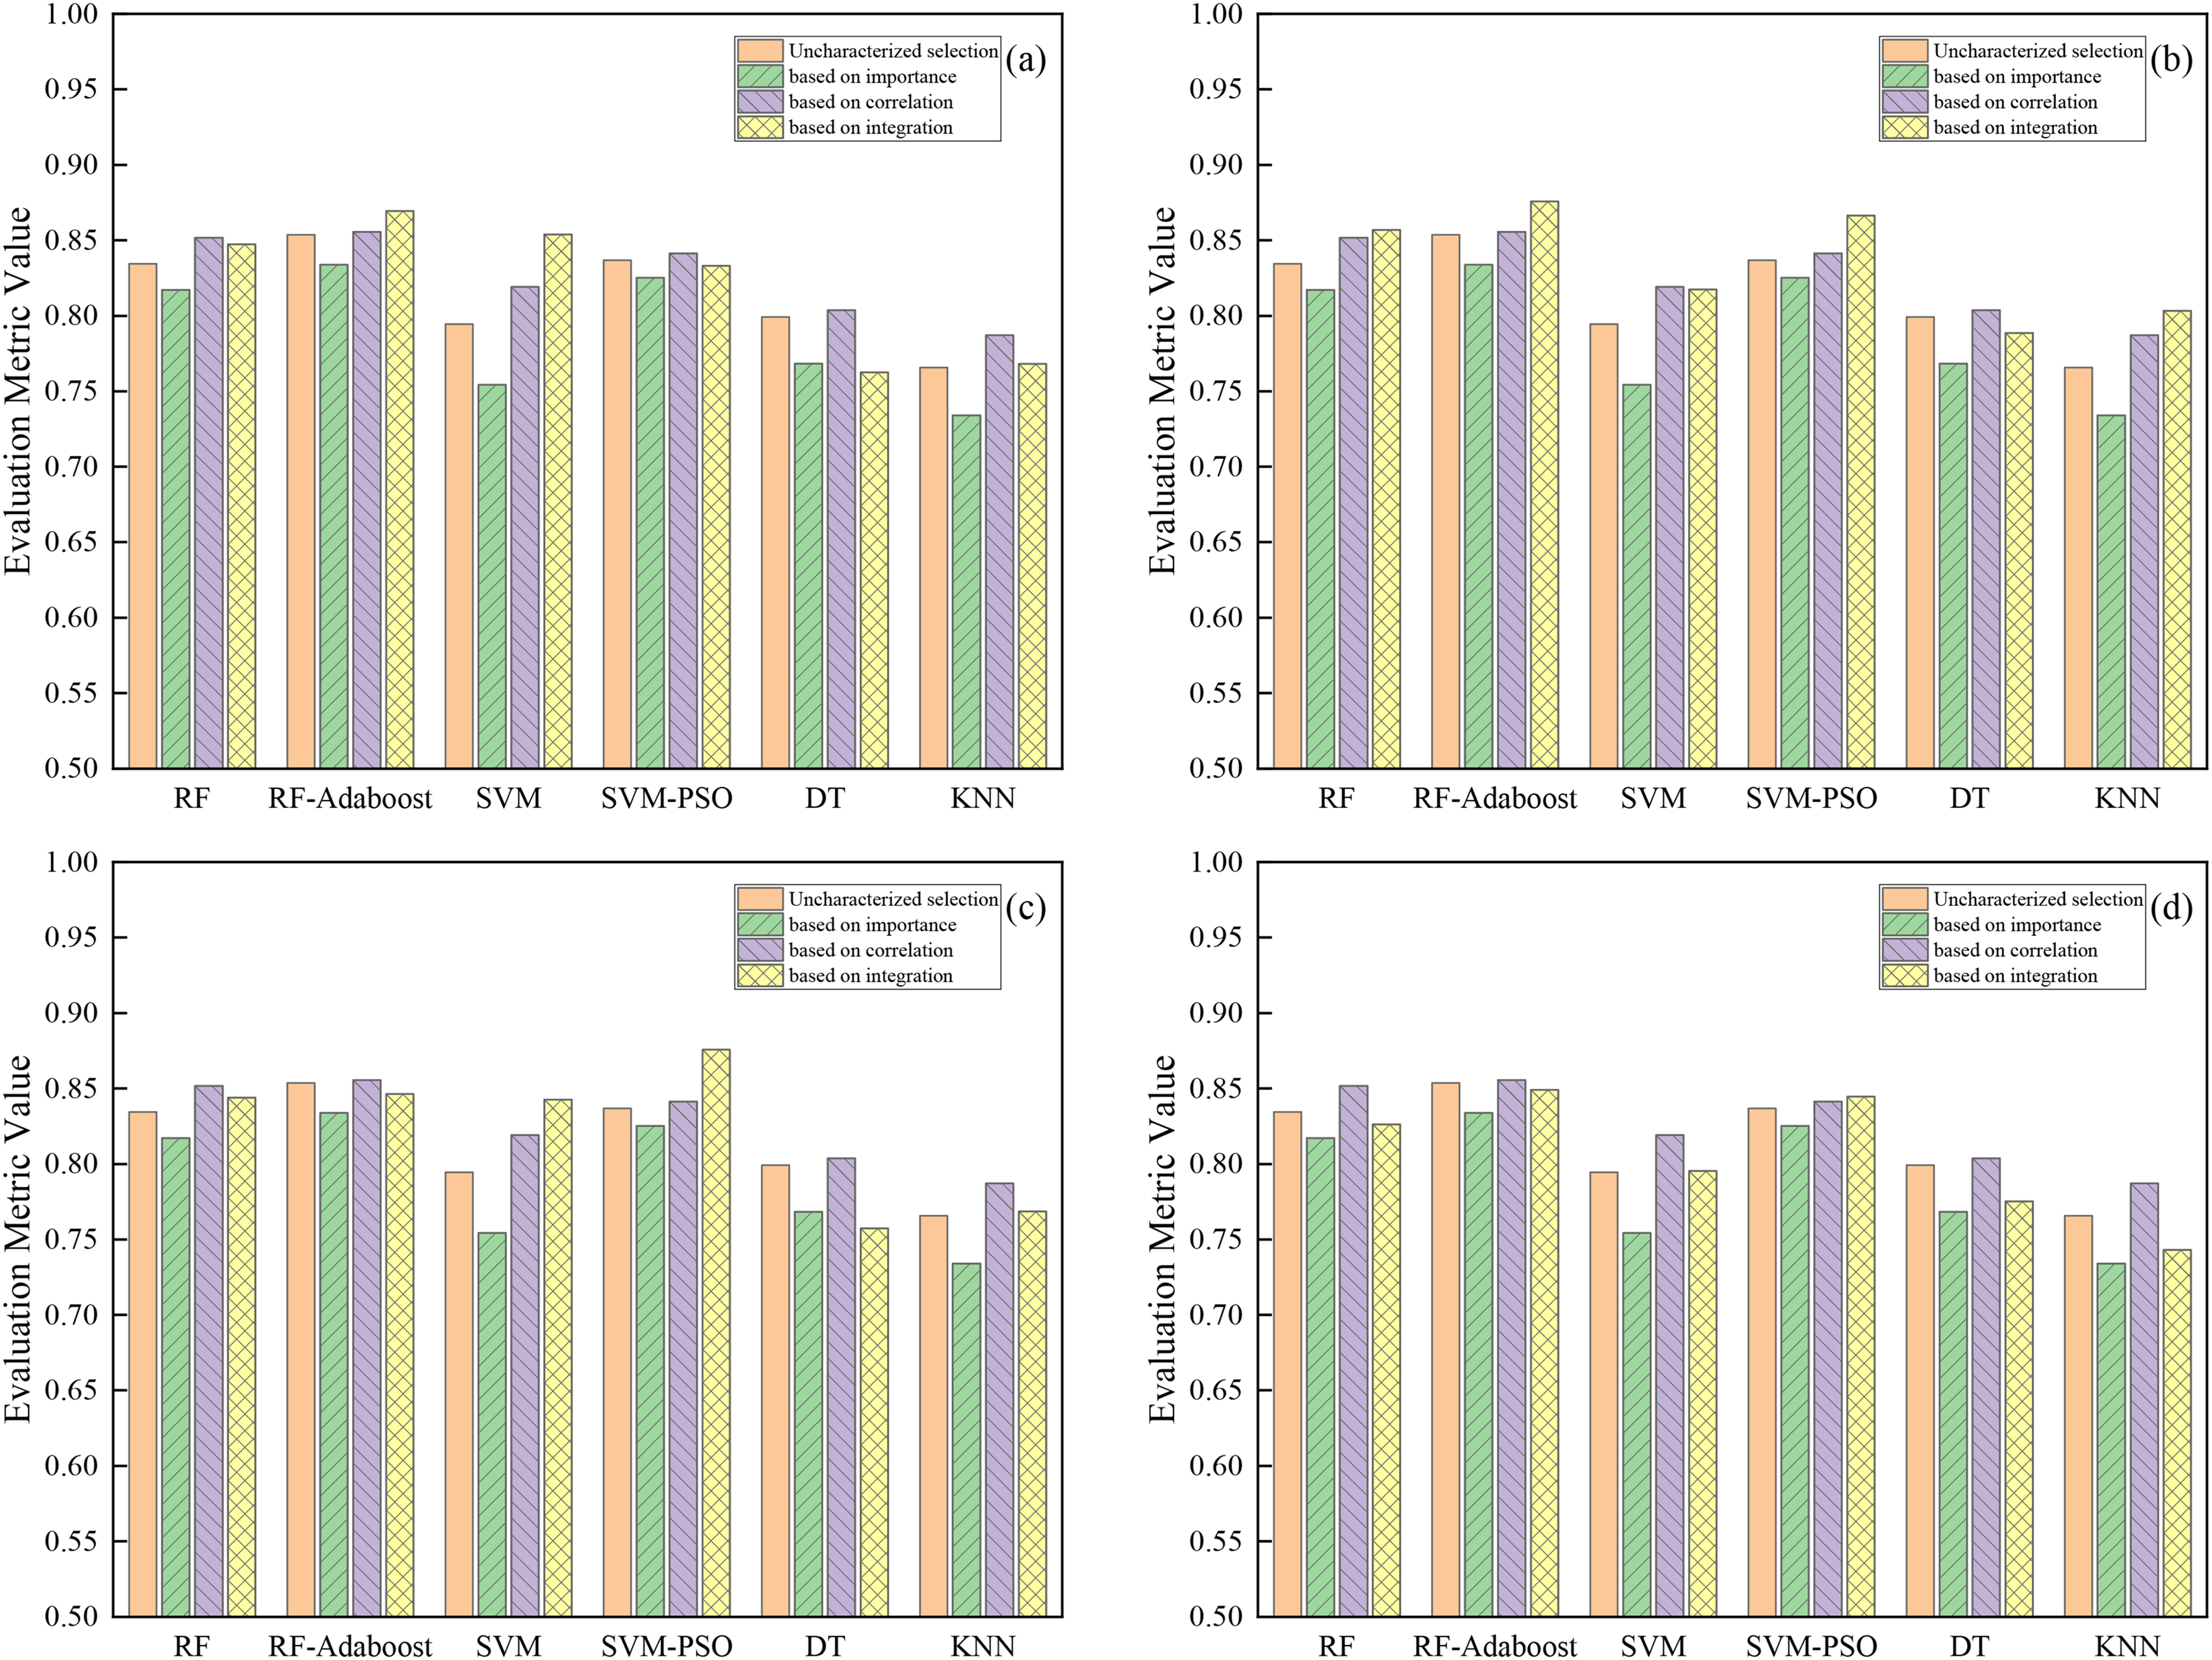
Performance comparison of different feature selection methods on different models. The integrated feature selection weight ratio is (a) 9:1, 8:2; (b) 7:3, 6:4; (c) 5:5; and (d) 4:6, 3:7, 2:8, and 1:9.
Compared to feature selection based solely on importance, the combined method demonstrated clear performance advantages. Using the best-performing Dataset 2, the F1-scores of the six models (RF, RF-Adaboost, SVM, SVM-PSO, DT, and KNN) were improved by approximately 3.97%, 4.19%, 6.32%, 4.14%, 2.03%, and 6.94%, respectively, relative to the importance-only baseline. The robustness of the combined approach is further highlighted by Dataset 4 (the lowest-performing subset), which also consistently outperformed the importance-only baseline. For instance, Dataset 4 still yielded F1-score improvements over importance-based selection, notably by approximately 4.12% for SVM and 1.94% for SVM-PSO. Therefore, integrating feature independence with importance provides a more effective feature selection strategy than relying solely on importance rankings.
When compared against using all features, the integrated method, represented by Dataset 2, also demonstrated clear value for most models. Specifically, Dataset 2 led to improved F1-scores for five of the six models: RF, RF-Adaboost, SVM, SVM-PSO, and KNN, with performance increases of approximately 2.25%, 2.21%, 2.29%, 2.97%, and 3.77%, respectively, compared to using uncharacterized selection. Conversely, the DT model performed slightly better (by about 1.05%) with the uncharacterized selection. Thus, while not universally superior to using all features across every model, the combined feature selection method demonstrated its effectiveness by enhancing performance for the majority of the algorithms evaluated.
The comparison between the combined method (using Dataset 2) and correlation-based feature selection revealed model-specific performance differences. The combined method demonstrated superior efficacy in four of the six algorithms. Specifically, compared to the correlation-based method, the F1-scores for RF, RF-Adaboost, SVM-PSO, and KNN increased by approximately 0.51%, 2.01%, 2.51%, and 1.63%, respectively. Conversely, correlation-based selection yielded slightly better results for the SVM and DT models, with F1-scores approximately 0.18% and 1.51% higher, respectively, than the combined method. This result indicates that while correlation-based selection remains an effective baseline for specific models, the combined strategy proposed in this study, integrating both importance and independence, can provide distinct performance advantages for certain ML algorithms, particularly for the evaluated ensemble RF-Adaboost and SVM-PSO models.
In summary, the comparative analysis emphasizes the value of the proposed combined feature selection method. By integrating both feature importance and independence, the method consistently and significantly outperformed selection based solely on importance. Despite model-dependent performance against the uncharacterized and correlation-based baselines, the combined method achieved substantial performance gains for the majority of the algorithms used in this article, particularly with the feature set corresponding to Dataset 2. Notably, it demonstrated distinct advantages for RF-Adaboost and SVM-PSO models, surpassing all baseline methods in these instances. These findings highlight the combined strategy's potential to enhance predictive performance (measured by F1-score), presenting it as a robust and effective feature selection method.
Discussion
This study analyzed clinical data from CWP patients compared to healthy individuals to construct an ML model for the staging diagnosis of CWP. The findings indicated changes in certain clinical data between CWP patients and the healthy control group. Using the RF feature selection method, the three most critical features for the staging of pneumoconiosis were identified as ALB, PLT, and WBC. However, after performing unidimensional feature selection in this study, it was observed that the model performance did not significantly improve but there was a downward trend in some models. To address this problem, we weighted the importance and independence of features for linear fitting, thereby comprehensively considering the impact of each dimension on the staging of CWP. The results, indicated by accuracy, precision, recall, and F1 scores, showed that the model performance improved with each weight combination compared to considering only a single dimension. The best model performance was achieved when the weight ratio of importance to independence was 7:3 or 6:4.
A substantial number of studies have demonstrated that ML based on clinical data has been extensively applied to various aspects of disease diagnosis and prognosis, such as the differentiation of acute appendicitis categories 45 and the rapid diagnosis of chronic kidney disease. 21 Traditional diagnosis of CWP relies on doctors interpreting chest X-ray. 46 However, on the one hand, chest X-ray is more costly than traditional clinical data, significantly increasing the medical expenses for patients. On the other hand, even the most accurate digital radiography images can have issues with organ overlap leading to unclear visibility. 47 Therefore, this study combined clinical biochemistry examination data with ML models for the staging prediction of CWP, which not only addressed the existing problems in imaging but also reduced the medical costs for patients.
Feature selection methods are typically categorized into three types, including embedded, wrapper, and filter methods. 48 Generally, feature selection reduces the number of features, which can decrease the complexity of the model, reduce the risk of overfitting, and thereby enhance model performance. 49 In this study, we employed the RF importance for feature selection. However, we observed a decline in the predictive performance of the model, contrary to our expectations. Research suggests that this phenomenon may arise from the loss of variables with significant predictive contributions during the feature selection process, which could also account for the slight performance decrease when using only importance for feature selection in this study. Nevertheless, researchers have noted that despite a reduction in dimensionality and a decrease in computational time, the dataset post-feature selection remains applicable for classification tasks, especially when the performance decline is minimal. 50 Therefore, the feature selection based on importance in this study still held certain research significance.
Additionally, RF can also identify clinically relevant features for CWP according to the magnitude of feature importance scores. Previous studies have utilized RF importance to identify AaDO2 as a predictive factor for CWP. 22 Furthermore, some studies employed metabolomics analysis and discovered a negative correlation between direct bilirubin in the serum of pneumoconiosis patients and the severity of CWP. 51 In this study, we used common clinical biochemical indicators, which are more readily available than pulmonary function and blood gas analysis, thus filling the gap in the prediction of CWP staging using common clinical data. Unlike the more costly metabolomics approach, we employed the Kruskal–Wallis H test, a statistical method, and identified significant variations in features such as ALC, ALB, and ALT across different stages of CWP. Box plots based on their medians, quartiles, and interquartile ranges are shown in Figure 11. The p-values from the Kruskal–Wallis H test were all less than the level of significance of 0.05, indicating significant differences between at least two groups. As shown in Figure 11, the levels of ALC, ALB, and ALT also decreased with the severity of CWP, suggesting that these features can serve as good predictive factors for CWP staging from a statistical perspective. However, further research is needed to explore the underlying biological mechanisms and clinical significance.
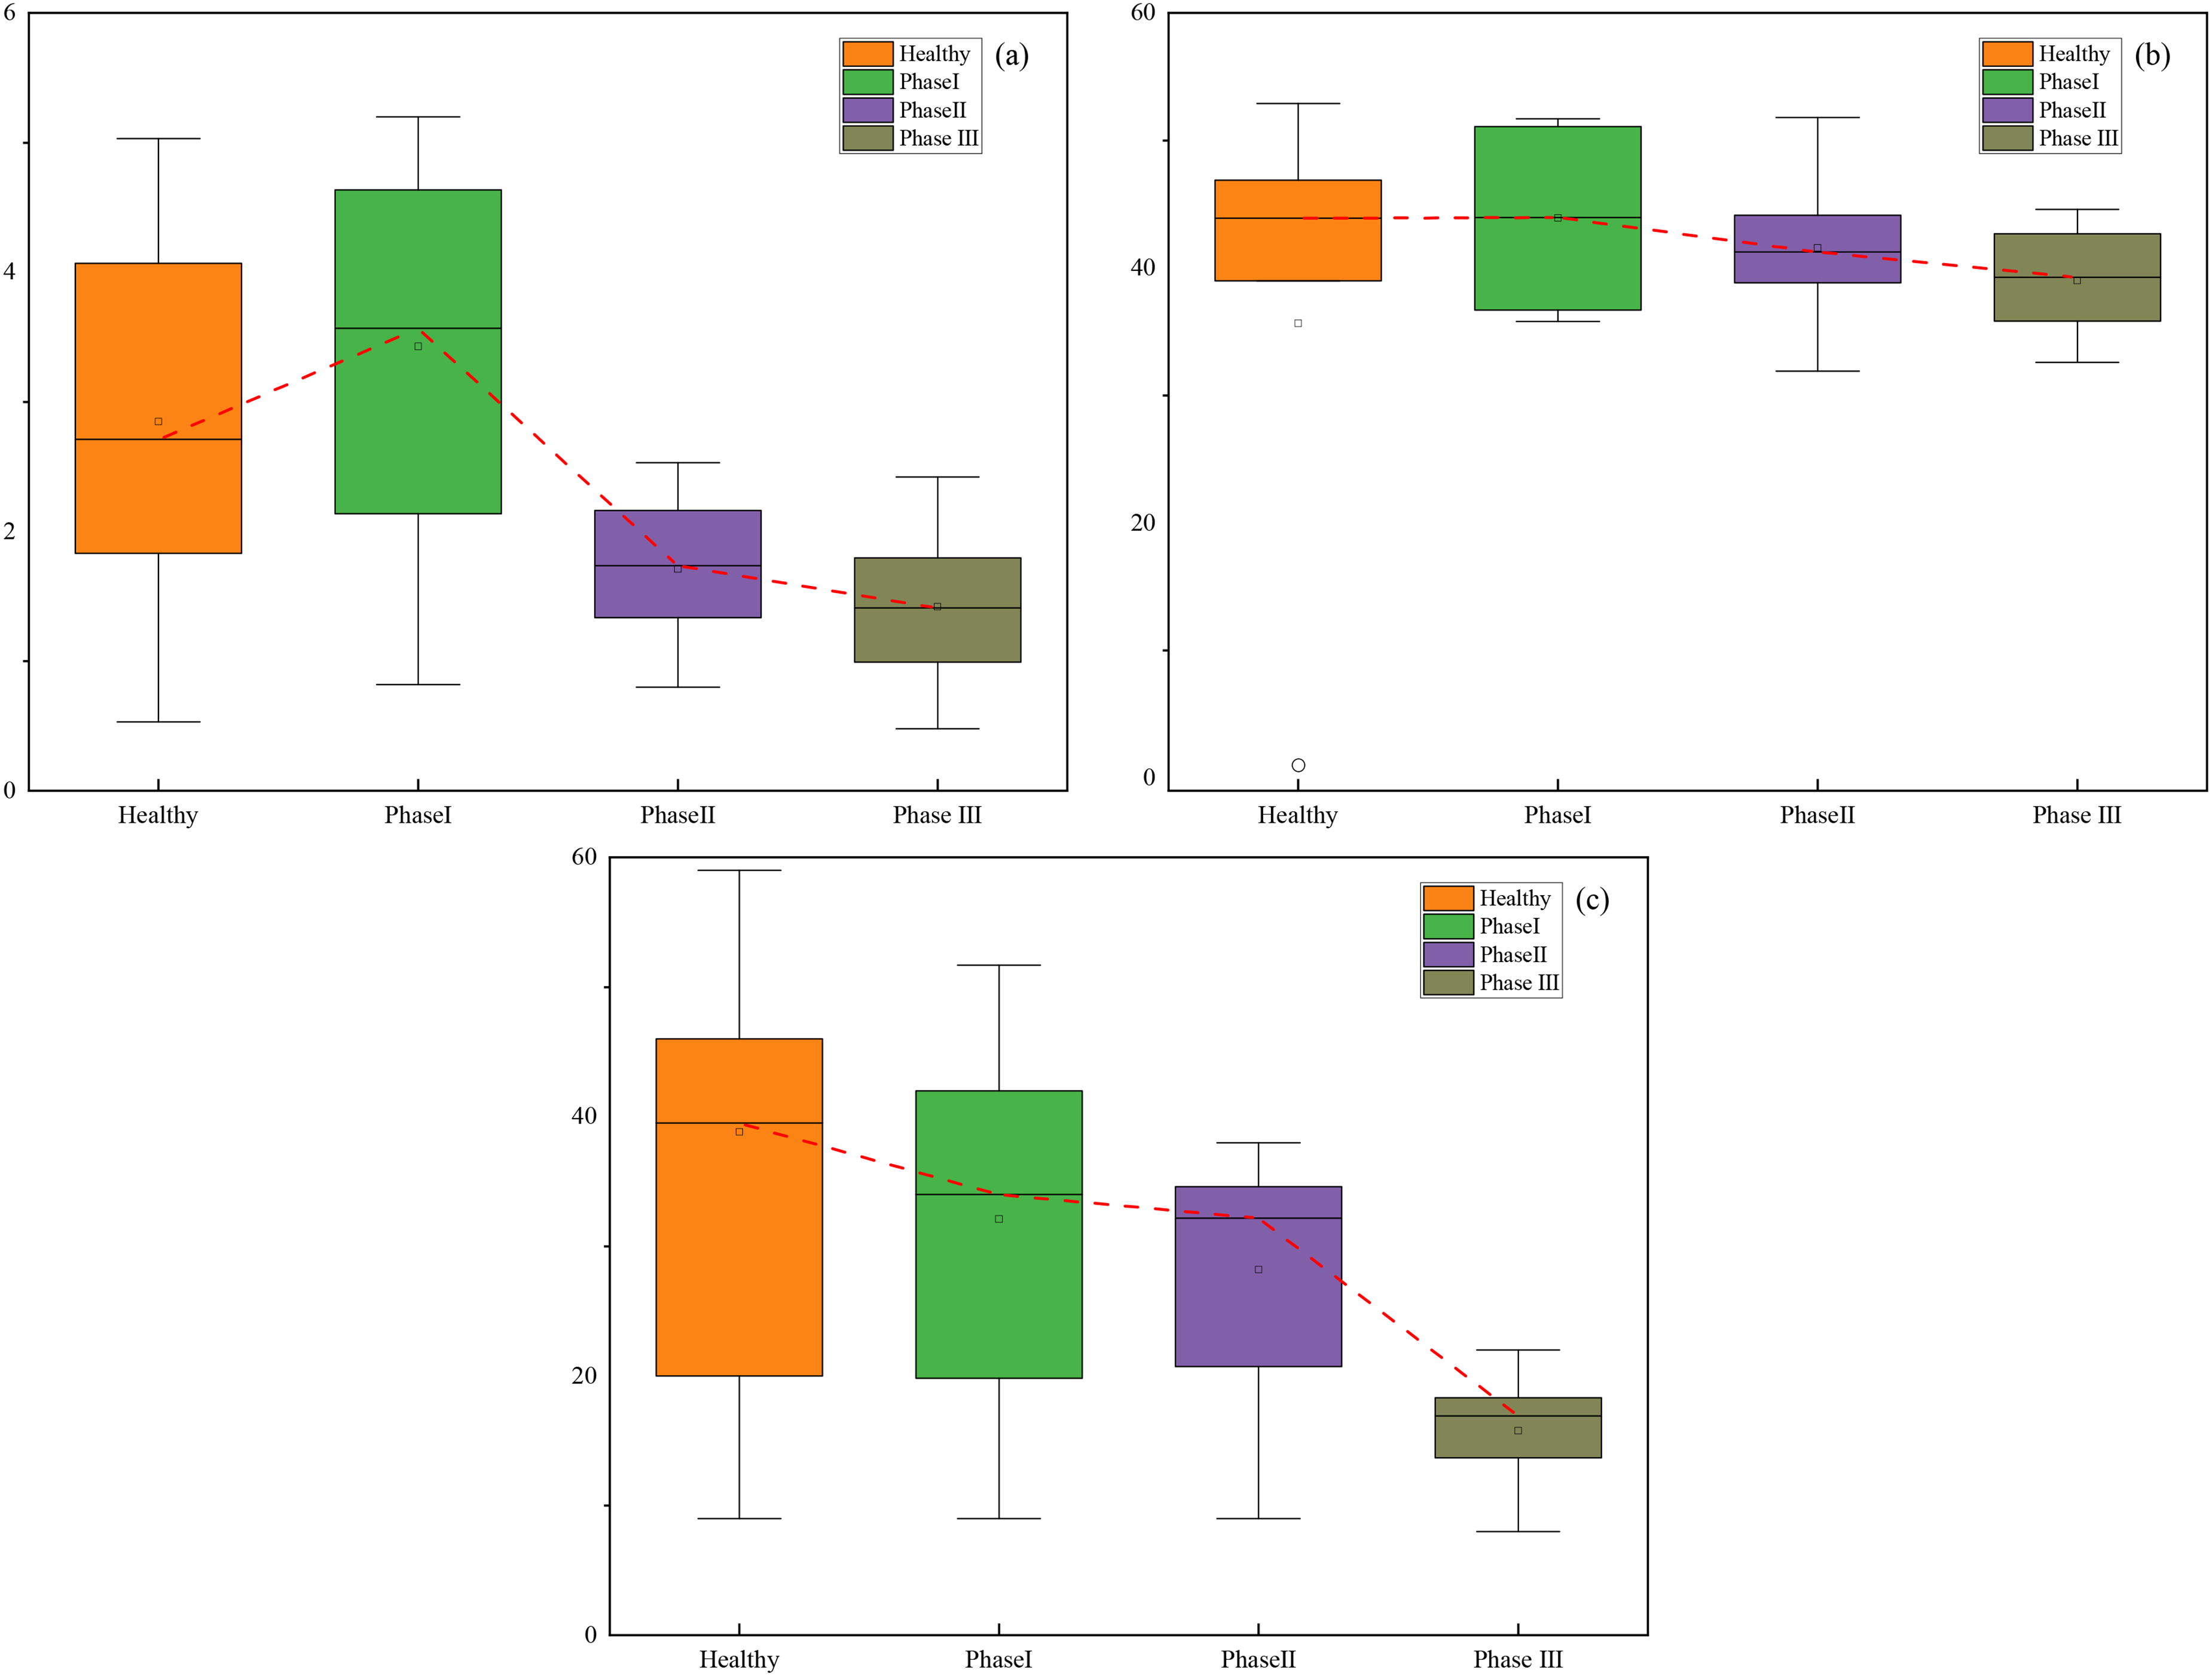
Kruskal–Wallis H test results of different clinical indicators at different stages. (a) ALC; (b) ALB; and (c) ALT.
In the process of feature selection based on importance assessment, we excluded six indicators with the lowest importance values, including GLB, A/G, VLDL, TG, Cr, and AMC. However, due to the particularities of clinical data, there is often a strong correlation between two or more variables, known as multicollinearity, which is not uncommon in medical research. 52 This phenomenon can affect the outcomes of model predictions since it becomes difficult to discern the individual impact of each input variable on the target variable. Up to date, a variety of methods have been identified to address multicollinearity, 53 such as stepwise regression and factor analysis. Yet, these traditional solutions tend to be complex, involving tedious hyperparameter tuning and substantial computational effort. In this study, we employed the simplest approach by directly utilizing Spearman's rank correlation analysis, setting a threshold for the absolute value of the correlation coefficient to guide feature selection, thereby creating a new dataset comprised of variables with low or no correlation. By comparing the model performance before and after the exclusion, we observed an overall improvement in performance postprocessing compared to preexclusion. This indicated that in this research, a simple method was also capable of resolving multicollinearity issues. The method is straightforward, time-efficient, and ensures the accuracy of the model, holding certain significance for clinical research.
To further substantiate that the application of correlation analysis in resolving multicollinearity is not unique to this study, we have referenced UCI's Heart Disease public dataset for validation. This dataset utilizes 14 clinical features such as trestbps to construct ML models for predicting the presence of heart disease. A correlation analysis was performed on these 14 clinical features, and the resulting heatmap of the correlation coefficients is depicted in Figure 12.
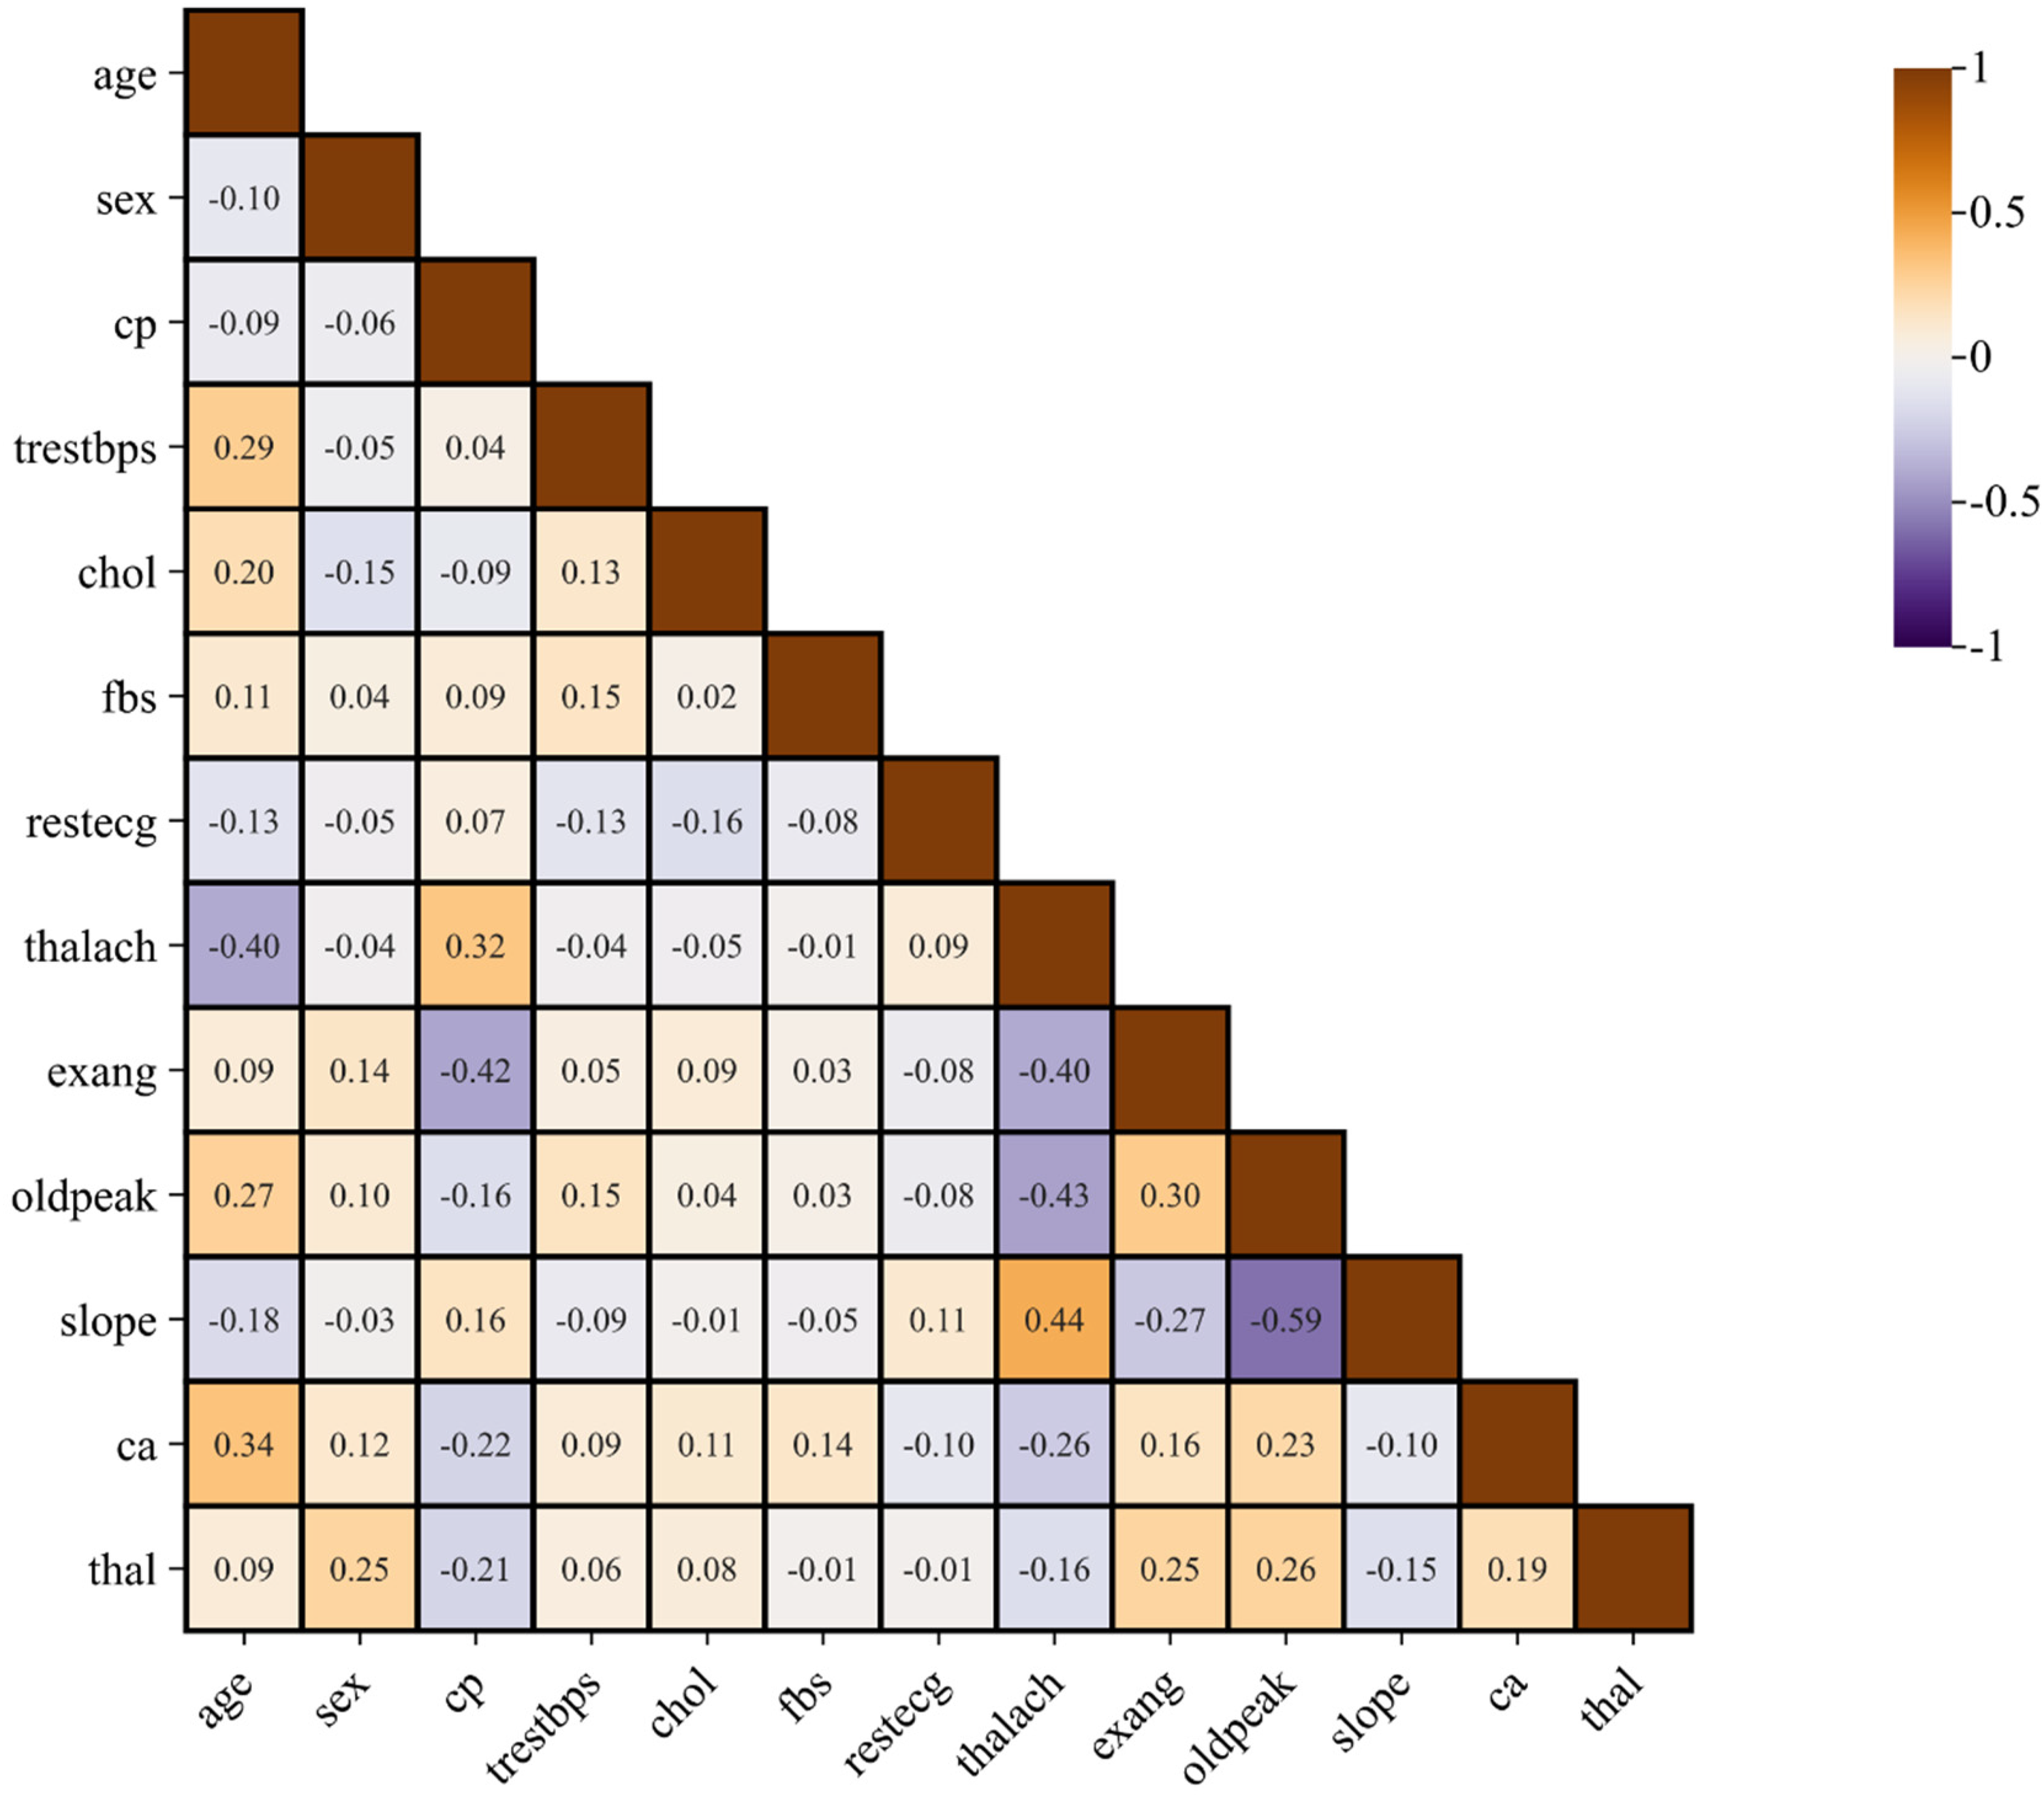
Correlation heat maps of heart disease characteristic variables.
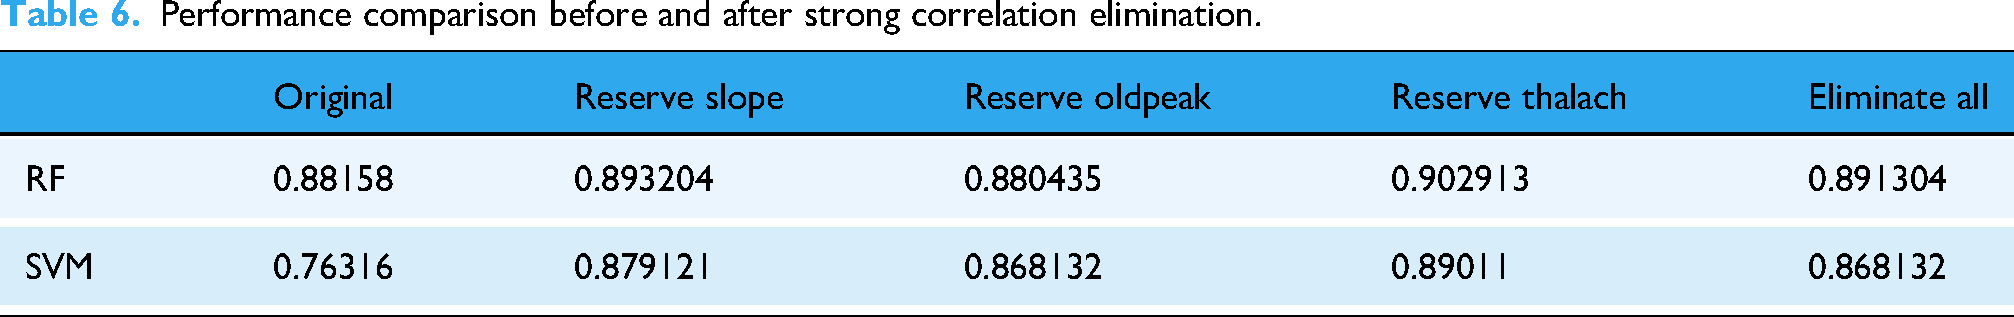
To ensure that the features excluded only have low intercorrelations, a threshold of 0.43 for the absolute value of the correlation coefficient was set for screening. After this process, the features that met the criteria were identified as thalach, oldpeak, and slope. Since these three variables all had intercorrelations above the threshold, the exclusion was performed four times. The datasets after exclusion were compared with the original Heart Disease dataset using the RF and SVM models for prediction, and the results are presented in Table 6. It was found that the datasets with strong intercorrelations removed showed a performance improvement compared to the original datasets, with the SVM model showing a more pronounced enhancement. The performance of the datasets with strong intercorrelations removed improved by 1.0384% for the RF model and 11.3214% for the SVM model compared to the original datasets. These results indicated that strong intercorrelations among features are one of the factors affecting the predictive performance of the models, and that correlation analysis can effectively address the issue of multicollinearity.
Performance comparison before and after strong correlation elimination.
Based on the current research findings, we have observed that when conducting feature selection based on importance and correlation, the features eliminated by the two methods differ due to their distinct focuses. Relying on a single-dimensional feature selection criterion may lead to model misjudgment and overfitting due to the loss of information. To enable the model to grasp more information and achieve more stable and accurate performance, we explored a more comprehensive feature selection strategy. A common multidimensional feature selection method involves using the intersection of features selected by various feature selection methods as the optimal subset, 54 such as combining hybrid filter and embedded feature selection methods to filter key features. 55 In this study, we innovatively proposed a weighted linear ensemble feature selection method, which adjusted the weights of feature importance and independence to predict the staging of CWP. The results demonstrated that compared to single-dimensional feature selection, this ensemble method significantly enhances the model's predictive performance under various weight configurations, thereby validating its effectiveness. This approach also provides a novel perspective for the prediction of pneumoconiosis staging and may offer a reference for the diagnosis and classification of other clinical diseases.
Although this study introduces an innovative method for CWP staging prediction, certain limitations should be acknowledged. Firstly, the findings are derived from data sourced exclusively from a single institution, which may limit the generalizability of our predictive models. Future work should utilize data collected from multiple centers to enhance the broader applicability of these models. Secondly, the current study acquires patient information within a specific timeframe, lacking insight into the temporal changes of clinical indicators in CWP patients. Consequently, future research should consider temporal factors, tracking patients, and the changes in their relevant clinical and biochemical indicators. Such an approach could provide a more comprehensive assessment for CWP research.
Conclusion
In conclusion, the objective of this study was to achieve precise staging prediction for CWP through ML methods and a small sample of routine clinical data. Initially, we employed various oversampling techniques to balance the small-sample clinical data. Subsequently, we utilized multiple ML methods for supervised learning and prediction of CWP staging outcomes. Furthermore, we proposed an integrated feature selection approach that takes into account both feature importance and independence, thereby achieving high-accuracy CWP staging prediction with a reduced number of clinical test indicators.
Oversampling methods were utilized to enhance the small-sample clinical data, resulting in a balanced CWP dataset, and ML techniques were combined to achieve early prediction of CWP. Among these, various ML models demonstrated optimal performance on the SMOTE oversampling dataset. The RF and SVM models were optimized using the Adaboost algorithm and the PSO algorithm, respectively, to compensate for the models’ deficiencies. The optimized RF-Adaboost model demonstrated superior performance for staging prediction of CWP on the SMOTE oversampling dataset, achieving an accuracy of 0.8536, which represented a 1.23% improvement over the unoptimized RF model. The SVM-PSO model showed enhanced performance on the ADASYN oversampling dataset, with an accuracy of 0.8534, marking a significant 6.09% increase in performance compared to the original SVM model. The RF importance assessment method was employed to identify ALB, PLT, and WBC as significant predictive factors for CWP. Additionally, in an innovative approach, the Kruskal–Wallis H test, a statistical method, was utilized to detect significant changes in the features of ALC, ALB, and ALT across different stages of CWP. This approach fills the gap in identifying prognostic factors for CWP staging predictions using simple statistical methods. An innovative integrated feature selection method was proposed, which comprehensively considered the importance and independence of the clinical features utilized. In contrast to traditional prediction approaches that depend on chest radiography or metabolomics, this method enabled accurate staging prediction of CWP with fewer clinical indicators. The highest increase in prediction accuracy for CWP, by 6.94%, was achieved when the combined weight ratio of the importance to independence indicators was set at 7:3 or 6:4.
Footnotes
Ethical considerations
This study was approved by the Medical Ethics Committee ([2022]-101501).
Consent for publication
All authors are aware of and agree to publish.
Author contributions
JJ: Investigation, methodology, and writing—original draft. JH: Data curation and methodology. YC: Methodology and writing—review & editing. DZ: Methodology and conceptualization. HL: Data curation and conceptualization. SW: Investigation, methodology, and writing—review & editing. WH: Funding acquisition, project administration, and writing—review & editing. All authors reviewed and approved this manuscript.
Funding
The authors disclosed receipt of the following financial support for the research, authorship, and/or publication of this article: This study was supported by National Natural Science Foundation of China (No. 82405130), Natural Science Foundation of Jiangsu Province (No. BK20220236), Occupational Health Research Project Jiangsu Province (No. JSZJ20233202), Health Commission Research Project of Jiangsu Province (No. Z2023023), Research Fund for Doctoral Degree Teachers of Jiangsu Normal University of China (No. 22XXFRS011), and Jiangsu Normal University Postgraduate Research and Practice Innovation Program (No. 2024XKT0651).
Declaration of conflicting interests
The authors declared no potential conflicts of interest with respect to the research, authorship, and/or publication of this article.
Guarantor
SW.