
Abstract
Objective
Diabetes mellitus is a chronic condition that requires constant blood glucose monitoring to prevent serious health risks. Accurate blood glucose prediction is essential for managing glucose fluctuations and reducing the risk of hypo- and hyperglycemic events. However, existing models often face limitations in prediction horizon and accuracy. This study aims to develop a hybrid deep learning model combining Transformer and Long Short-Term Memory (LSTM) networks to improve prediction accuracy and extend the prediction horizon, using personalized patient information and continuous glucose monitoring data to support better real-time diabetes management.
Methods
In this study, we propose a hybrid deep learning model combining Transformer and LSTM networks to predict blood glucose levels for up to 120 min. The Transformer Encoder captures long-range dependencies, while the LSTM models short-term patterns. To improve feature extraction, we integrate Bidirectional LSTM and Transformer Encoder layers at multiple stages. We also use positional encoding, dropout layers, and a sliding window technique to reduce noise and manage temporal dependencies. Richer features, including meal composition and insulin dosage, are incorporated to enhance prediction accuracy. The model's performance is validated using real-world clinical data and error grid analysis.
Results
On clinical data, the model achieved root mean square error/mean absolute error of 10.157/6.377 (30-min), 10.645/6.417 (60-min), 13.537/7.283 (90-min), and 13.986/6.986 (120-min). On simulated data, the results were 1.793/1.376 (15-min), 2.049/1.311 (30-min), and 3.477/1.668 (60-min). Clark Grid Analysis showed that over 96% of predictions fell within the clinical safety zone up to 120 min, confirming its clinical feasibility.
Conclusion
This study demonstrates that the combined Transformer and LSTM model can effectively predict blood glucose concentration in type 1 diabetes patients with high accuracy and clinical applicability. The model provides a promising solution for personalized blood glucose management, contributing to the advancement of artificial intelligence technology in diabetes care.
Keywords
Introduction
Diabetes mellitus (DM) is a complex metabolic disorder influenced by genetic, immune, and environmental factors. It primarily manifests as insulin secretion deficiencies and/or reduced tissue sensitivity to insulin, disrupting glucose, carbohydrate, lipid, and protein metabolism. Among the various forms of diabetes, type 1 diabetes (T1D) is particularly challenging, as it involves the autoimmune destruction of insulin-producing beta cells. This necessitates lifelong insulin therapy to maintain blood glucose concentrations (BGC) within a therapeutic range, preventing the onset of serious complications such as cardiovascular diseases, retinopathy, nephropathy, and neuropathy.
Maintaining optimal BGC is crucial for managing T1D. Hyperglycemia, defined as blood glucose exceeding 180 mg/dL, can result in severe complications. Such as damage to the eyes, kidneys, and nervous system, 1 while hypoglycemia (blood glucose below 70 mg/dL) caused by excessive insulin can lead to fainting, coma, or even death. 2 To reduce these risks, precise blood glucose prediction is essential. Accurate predictions help determine the right insulin doses, meal plans, and physical activity regimens, supporting both day-to-day management and long-term health outcomes.
A promising tool for blood glucose monitoring is continuous glucose monitoring (CGM), which provides real-time data on blood glucose levels through small sensors, eliminating the need for painful finger pricks. 3 Continuous glucose monitoring devices produce high-density time-series data, offering continuous and detailed measurements of blood glucose.
However, despite the advancements in CGM technologies, accurate blood glucose prediction remains a significant challenge. The dynamics of blood glucose are influenced by a variety of factors, including carbohydrate intake, insulin doses, physical activity, stress, infections, sleep patterns, and hormonal fluctuations. 4 Additionally, T1D patients show considerable individual variation in their glucose responses to insulin, further complicating predictions. These factors make it difficult to model glucose levels reliably and consistently across all patients. 5
In recent years, deep learning has emerged as a powerful tool for predicting blood glucose levels in diabetic patients. One of its key advantages is the ability to automatically extract relevant features from raw input data, eliminating the need for manual feature engineering. Deep learning models can handle complex and high-dimensional datasets, support multiple inputs and outputs, and effectively capture patterns in long sequences of data. 6 These capabilities allow deep learning to provide more accurate and reliable predictions, even in the presence of varying factors such as insulin doses, physical activity, and meal timing. This makes deep learning particularly well-suited for real-time blood glucose monitoring and management.
Bertachi et al. 7 combined artificial neural networks (ANN) with physiological models to predict blood glucose and detect nighttime hypoglycemia. The model used glucose, insulin, carbohydrate, and activity data, trained on a split dataset. Predictions were evaluated using root mean square error (RMSE). In the OhioT1DM dataset, RMSE for 30-min and 60-min predictions were 19.33 mg/dL and 31.72 mg/dL, respectively. The model achieved 85% sensitivity and 92% specificity for nighttime hypoglycemia. Zhu et al. 5 used an Extended Recurrent Neural Network (RNN) with vanilla RNN layers for efficient blood glucose prediction within 30 min. The model achieved an RMSE of 18.9 ± 2.6 mg/dL on the OhioT1DM dataset, outperforming NNPG, SVR, and ARX models. Similarly, Cappon et al. 8 developed a personalized BiLSTM model that processes sequences in both directions, enhancing pattern recognition. This model achieved an RMSE of 20.20 mg/dL for 30-min predictions and 34.19 mg/dL for 60-min predictions on the same dataset.
GluNet 9 is a deep learning model designed for blood glucose prediction using artificially generated continuous monitoring data from T1D patients. It incorporates preprocessing, label transformation, multilayer dilated convolutions with gate activations, and postprocessing for computational efficiency. The model achieved an RMSE of 19.28 ± 2.76 mg/dL for 30-min predictions and 31.83 ± 3.49 mg/dL for 60-min predictions. Similarly, Mehrad Jaloli et al. 10 proposed a CNN-LSTM model that integrates 1D convolutional layers for feature extraction and a Long Short-Term Memory (LSTM) block to capture temporal dependencies. Using historical glucose, meal, and insulin data, the model was evaluated on the Replace-BG and DIAdvisor datasets, demonstrating strong performance with low errors and accurate glucose-error grid predictions across 30-, 60-, and 90-min horizons. Additionally, QingXiang Bian et al. 11 developed a hybrid model that leverages CGM data, using clinical data to combine the Transformer's self-attention mechanism for capturing global dependencies with LSTM's ability to model local patterns. The model achieved mean squared errors (MSE) of 1.18, 1.70, and 2.00 at 15-, 30-, and 45-min intervals, respectively, highlighting its potential for effective blood glucose forecasting.
Existing research in blood glucose prediction faces several challenges, including limited datasets, small sample sizes, and difficulties in capturing long-term dependencies in glucose dynamics. Additionally, many models struggle with noise sensitivity even in high-quality data, have high computational demands, and exhibit slow real-time prediction responses. Few studies attempt to predict blood glucose levels for extended horizons (e.g., 90 or 120 min), due to the increased complexity and uncertainty associated with longer-term forecasting. Moreover, the RMSE values in many models remain high, likely due to short data collection periods that fail to fully capture the complexities of glucose fluctuations.
In this study, we address these limitations by employing a hybrid architecture that combines two deep learning algorithms—Transformer and LSTM—to predict blood glucose levels up to 120 min (30, 60, 90, and 120 min). The Transformer Encoder captures long-range dependencies in the input sequence, generating a contextual representation that enhances the model's understanding of the entire sequence. Meanwhile, the LSTM processes historical glucose data to capture short-term temporal patterns, allowing the model to leverage both global and local dependencies for better prediction accuracy. However, the direct combination of Transformer and LSTM may struggle to extract higher-level dynamic features in more complex time-series scenarios, limiting its potential to improve prediction accuracy. To address these issues, our model integrates Bidirectional LSTM and Transformer Encoder layers at multiple stages, enabling better joint modeling of dependencies.
To enhance model performance, we incorporate positional encoding and dropout layers while utilizing a sliding window technique to better handle temporal dependencies and reduce noise. Additionally, we enrich the feature set with meal composition and insulin dosage, allowing for more precise prediction of blood glucose fluctuations and minimizing prediction errors. Although our approach does not fully resolve all challenges, it effectively addresses key issues such as overfitting and large prediction errors over extended time periods. Ultimately, our model is designed to predict blood glucose levels for up to 120 min using real-world clinical data, offering clinically valuable insights and demonstrating strong performance in accuracy evaluations through the error grid analysis (EGA) method.
Methods
In this study, we propose an innovative approach that integrates Transformer Encoder and LSTM architectures for blood glucose time series prediction. This approach combines the strengths of both models to address the limitations of using them individually. The research, conducted from May 2024 to the present, is an exploratory and applied study carried out at the Department of Biomedical Engineering, Faculty of Information Engineering and Automation, Kunming University of Science and Technology, Kunming, Yunnan Province.
While both Transformer and LSTM models have been applied to glucose prediction tasks, our method distinguishes itself by employing these models in parallel to capture both global and local dependencies simultaneously. The self-attention mechanism in the Transformer Encoder captures long-range dependencies and global patterns, while LSTM is focused on modeling short-term fluctuations. This parallel approach allows our model to comprehensively address both short-term fluctuations and long-term trends in glucose dynamics—an area where models relying solely on either Transformer or LSTM have shown limitations. In contrast to previous studies, which process features sequentially through these models, our method simultaneously operates bidirectional LSTM and Transformer Encoder layers, allowing for richer feature abstraction and a better understanding of complex glucose patterns.
Our model further differentiates itself by incorporating additional features that improve prediction accuracy and robustness. Personalized patient features, time-related features, and positional encodings are integrated to enhance the model's ability to handle dynamic glucose data. These features are processed through different encoding layers and then fused, which enables the model to effectively capture complex temporal dynamics. Additionally, our method includes richer information, such as meal composition and insulin dosage, which is often overlooked by other models that mainly rely on historical glucose data. By combining short-term and long-term dependencies and utilizing a multistage feature fusion mechanism.
Methodology
The proposed model's input consists of a multivariate time series comprising the patient's CGM readings along with corresponding timestamps, personalized baseline information (age, gender, height, weight, BMI, waist circumference, hip circumference), meal information for each meal (carbohydrate intake, protein intake, fat intake, calorie intake), and insulin infusion information (insulin dose and basal insulin dose for the four hours prior to infusion) representing the patient's physiological state. In this scenario, the input data

The focus of this study is to develop a deep learning–based prediction approach, where the model M considers the current input data

Transformer model
The application of the Transformer model in time series prediction benefits from its self-attention mechanism and multihead attention mechanism, enabling the capture of long-term dependencies and complex temporal dynamics within sequences. 6 The self-attention mechanism dynamically allocates attention weights between different time steps, adapting to the importance of different time points in the sequence to capture long-term dependencies. The multihead attention mechanism allows the model to simultaneously focus on dynamic features at different time scales, facilitating a more comprehensive understanding of the temporal dynamics in the blood glucose sequence. 6
The self-attention mechanism is defined as follows:


The definition of the multihead attention mechanism is as follows:

Transformer uses positional encoding to embed position information in the sequence and can take into account the sequential relationship in the time series without the need for recurrent structures. This flexible model architecture can be adapted to various prediction tasks.
Long short-term memory model
Long short-term memory network is a variant of RNNs, which addresses the issue of long-term dependencies and gradient vanishing encountered in traditional RNNs by introducing a gating mechanism. 12 The basic unit of the LSTM network consists of one or multiple memory cells housed in a memory block, along with three adaptive multiplication gate units shared by all cells in the block: an input gate, a forget gate, and an output gate, accompanied by a cell state. These gate units enable the LSTM network to selectively retain or forget past information, facilitating more effective handling of long sequence data, commonly employed for processing and predicting time series data.
The LSTM input gate controls how the input information at the current time step influences the state of the unit, defined as follows:


Previously, single LSTM layers have been investigated for blood glucose prediction, 13 but they lack the ability to fully capture the time dependency exceeding 60 min PH. 14
In the blood glucose prediction task, LSTM can accept past blood glucose values as input and learn the relationship between sequence data to predict future blood glucose values. By training the LSTM network, it can gradually learn and capture patterns and trends in blood glucose data to predict future blood glucose values.
Proposed deep learning model architecture
In the initial experiments, the study evaluated the performance of pure LSTM and pure Transformer models in blood glucose time series prediction tasks. The results revealed that the LSTM model excelled in handling short-term dependencies but showed limitations in capturing long-term dependencies. Conversely, the pure Transformer model demonstrated strong capabilities in capturing global information and long-range dependencies but was less effective in addressing local dependencies compared to LSTM. Based on these observations, a decision was made to combine the Transformer Encoder with LSTM to leverage the Transformer's ability to capture global information and LSTM's strength in handling local dependencies.
During the architectural design process, multiple experiments were conducted to explore different model combinations and hyperparameter configurations. The results indicated that placing the LSTM layer before the Transformer Encoder effectively captured both short-term and long-term dependencies in the time series. Additionally, experiments were conducted by feeding the data into multiple encoder layers to better extract complex temporal dynamic features in the blood glucose data, which proved to be an effective performance enhancement strategy.
The final architecture design was selected based on a comprehensive consideration of these experimental results and task requirements, aiming to balance the model's complexity with performance. By combining the strengths of LSTM and Transformer Encoder, the model can handle both local and global dependencies simultaneously, thereby improving the accuracy of blood glucose prediction.
In this model architecture, the Transformer Encoder and LSTM are combined, utilizing the Transformer's self-attention mechanism to capture global information and long-range dependencies, while using LSTM to handle short-term dependencies, thereby enhancing prediction accuracy and robustness.
The model's inputs include personalized patient features, time features (converted into sine and cosine values for year, month, day, hour, minute, and second), positional encodings, and blood glucose-related data (such as blood glucose values, insulin doses, and meal data). These features are initially processed through different encoding layers: personalized features and blood glucose-related data are encoded into dense vectors through fully connected layers, time features are transformed into higher dimensions through one-dimensional convolutional layers, and positional encodings are generated by applying sine and cosine functions to sequence positions, enabling the model to perceive relative positional relationships in the input sequence. Subsequently, after all features are converted to the same dimension through different transformation methods, they are fused by direct addition. Specifically, each feature (such as personalized features, time features, location encoding, and blood sugar–related data) is independently transformed and encoded to ensure that their dimensions are consistent. Then, these processed features are fused by element-by-element addition while maintaining the consistency of dimensions, so that the model can process information from different sources simultaneously at each time step.
The core architecture of the model follows a multistage data flow, combining parallel Bidirectional LSTM and Transformer Encoder layers to capture both short-term and long-term dependencies in blood glucose prediction.
First, the fused input features, which have been processed through different transformation methods, are fed separately into the initial Bidirectional LSTM and Transformer Encoder layers (LSTM1 and Encoder1). The LSTM1 is responsible for capturing local temporal dependencies, while Encoder1 extracts global relationships using its self-attention mechanism. The outputs from both LSTM1 and Encoder1 are then passed through linear layers for dimensionality reduction, ensuring they are compatible with the next processing steps.
Next, the output from Encoder1 is passed into the second Transformer Encoder layer (Encoder2), where further global dependencies are captured. Simultaneously, the output from LSTM1 is sent to the second Bidirectional LSTM layer (LSTM2), which focuses on extracting additional short-term and long-range temporal dynamics.
The outputs from LSTM1 and LSTM2 are then fused through element-wise addition, preserving their dimensional consistency. This fusion allows the model to integrate information from both short-term (LSTM1) and long-term (LSTM2) dependencies. After the fusion step, the concatenated features are passed through a linear layer to adjust their dimensionality before they are passed to the final LSTM layer.
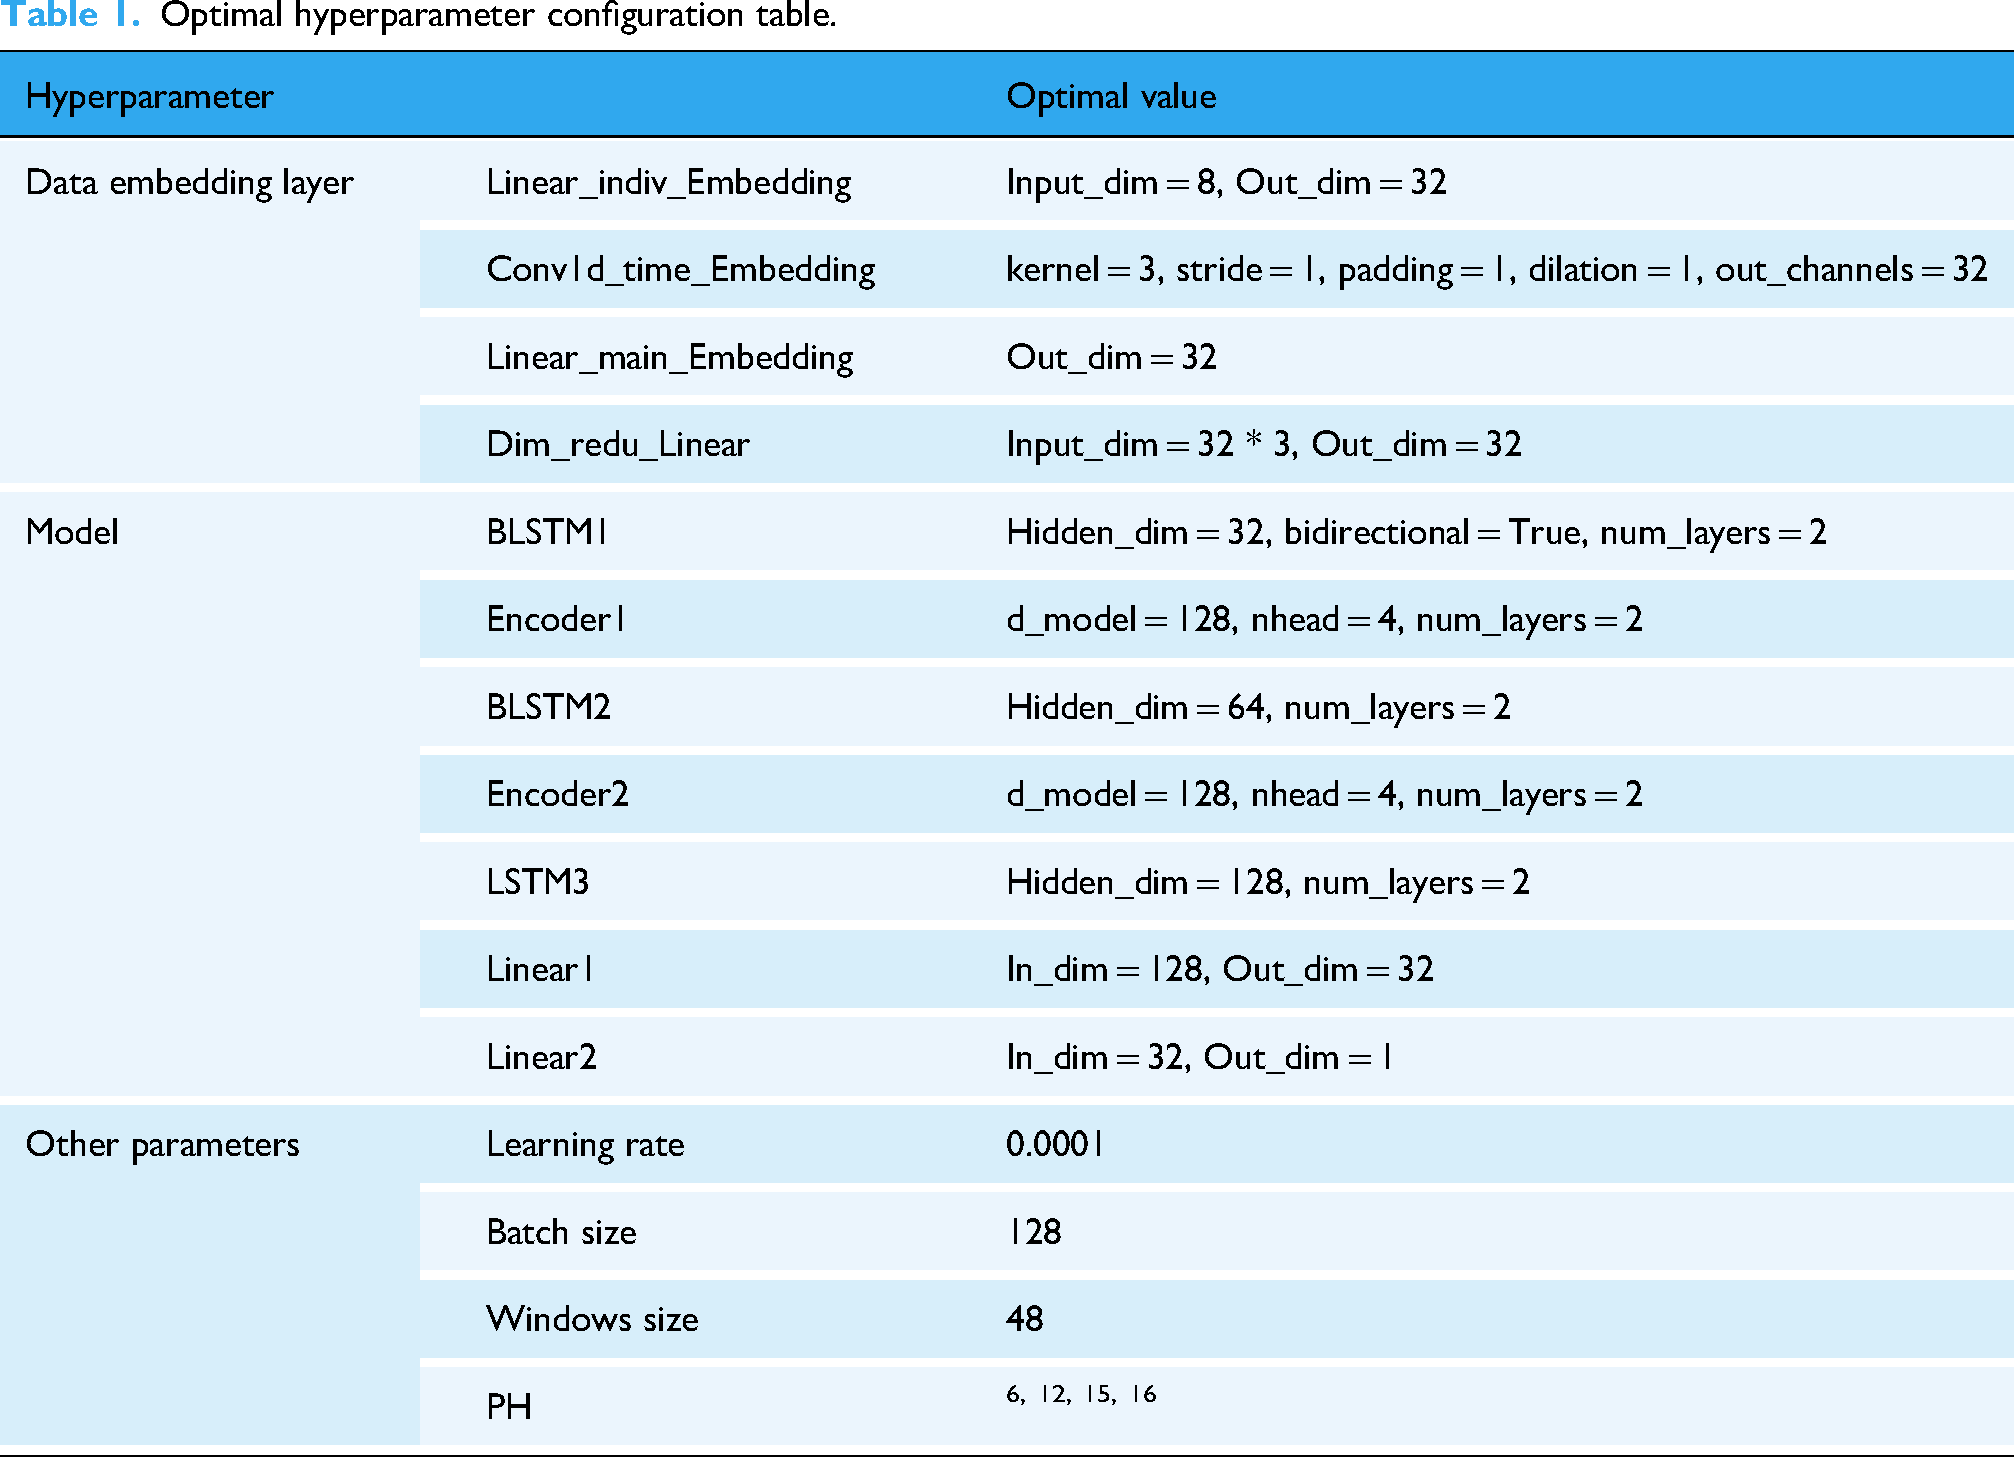
Finally, the processed features are passed through the final LSTM layer, which consolidates the information before generating the final prediction. The output from this LSTM layer is then passed through a fully connected layer to produce the final blood glucose predictions. For detailed information regarding the specific hyperparameters used in this model, please refer to Table 1.
Optimal hyperparameter configuration table.
Hyperparameter tuning and model optimization
Extensive hyperparameter tuning has been performed before obtaining the proposed optimal model for blood glucose prediction. For example, adjust the number of LSTM layers, the number of units per layer, different activation functions, the number of Transformer encoding layers, the number of heads in the encoding layer, etc. to get the best model. The CGM and insulin data summary are shown in Table 2.
Summary of CGM and insulin data.

Data sets
Clinical datasets
In this research, the dataset by T1D patients came from the First People's Hospital of Yunnan Province. These data encompassed the BGC of patients at different time points as well as their dietary intake. The CGM device used in the hospital is manufactured by Yunnan Shenyun Maple Technology Co., Ltd, with the model GS1; the insulin pump is manufactured by Dana Diabecare RS, developed by Xuyi Development Co., Ltd, in South Korea. All data collection procedures were conducted in accordance with relevant laws, regulations, and ethical standards and were approved by the hospital's ethics committee. Throughout the data collection process, strict adherence to principles of patient privacy protection was maintained, and confidentiality measures were implemented for the personal information of patients. Written informed consent was obtained from all subjects before the study began. The dataset possesses the following key characteristics:
The data comprises blood glucose readings, insulin infusion records, and meal intake data for three meals per day across four consecutive weeks for 13 patients. Additionally, personalized baseline data for each patient are included. Meal intake data include meal times, carbohydrate intake, protein intake, fat intake, and calorie intake for each meal. Baseline personalized data for patients include age, gender, height, weight, BMI, waist circumference, and hip circumference. Data were obtained from 13 T1D patients (3 males, 10 females), all of whom were undergoing insulin pump therapy. A sampling frequency of 5 min was employed to capture blood glucose fluctuations effectively.
The hyperparameter search space and optimal values are summarized in Table 1.
The violin plot depicting the distribution of patient blood glucose data is shown in Figure 1.

Violin diagram of blood glucose data distribution for each patient.
Simulated data set
The UVa/Padova simulator is the only U.S. Food and Drug Administration-approved insulin trial simulator that provides robust and reliable results. 17 The simulator was used to generate 360-day blood glucose data samples of 10 adult T1D patients, with 172,800 blood glucose data instances for each subject. The historical blood glucose values in this data set were accurately sampled every 3 min, making it very suitable to use as input to the model. Each instance contains four data fields: sampling time, CGM value, dietary carbohydrate intake, and insulin dose. The data of each subject is divided into a training set and a test set, with the training set accounting for 80% (138,240 instances) and the test set accounting for 20% (34,560 instances).
Data preprocessing
Missing value imputation and data smoothing
For patient with ID 13 in the clinical dataset, the missing blood glucose data may be due to device malfunctions or abnormal fluctuations caused by individual physiological changes. While the blood glucose data for other patients is complete, there are varying degrees of missing values for meal calories, carbohydrate intake, fat intake, protein intake, premeal insulin dosage, and basal insulin dosage. Considering that the Transformer model used in this study relies on the differences between current and future data points, such discontinuities in the time series may negatively impact the model performance. Furthermore, the proportion of missing blood glucose data points for patient 13 is relatively small (less than 1% of the total data points). Therefore, linear interpolation is chosen to fill in the missing data for patient 13. Additionally, incomplete insulin dosages exist for each patient. Given the daily periodicity of basal insulin dosage, missing values can be filled using data from the previous day. 18
In the clinical dataset, blood glucose data often exhibit high-frequency fluctuations. Continuous glucose monitoring data typically show a sawtooth pattern due to sensor noise, physiological variations, and changes in sampling frequency, necessitating the use of smoothing techniques to enhance data accuracy and usability.
19
Employing one-dimensional Gaussian filtering (G) aids in obtaining a smooth time series:
15

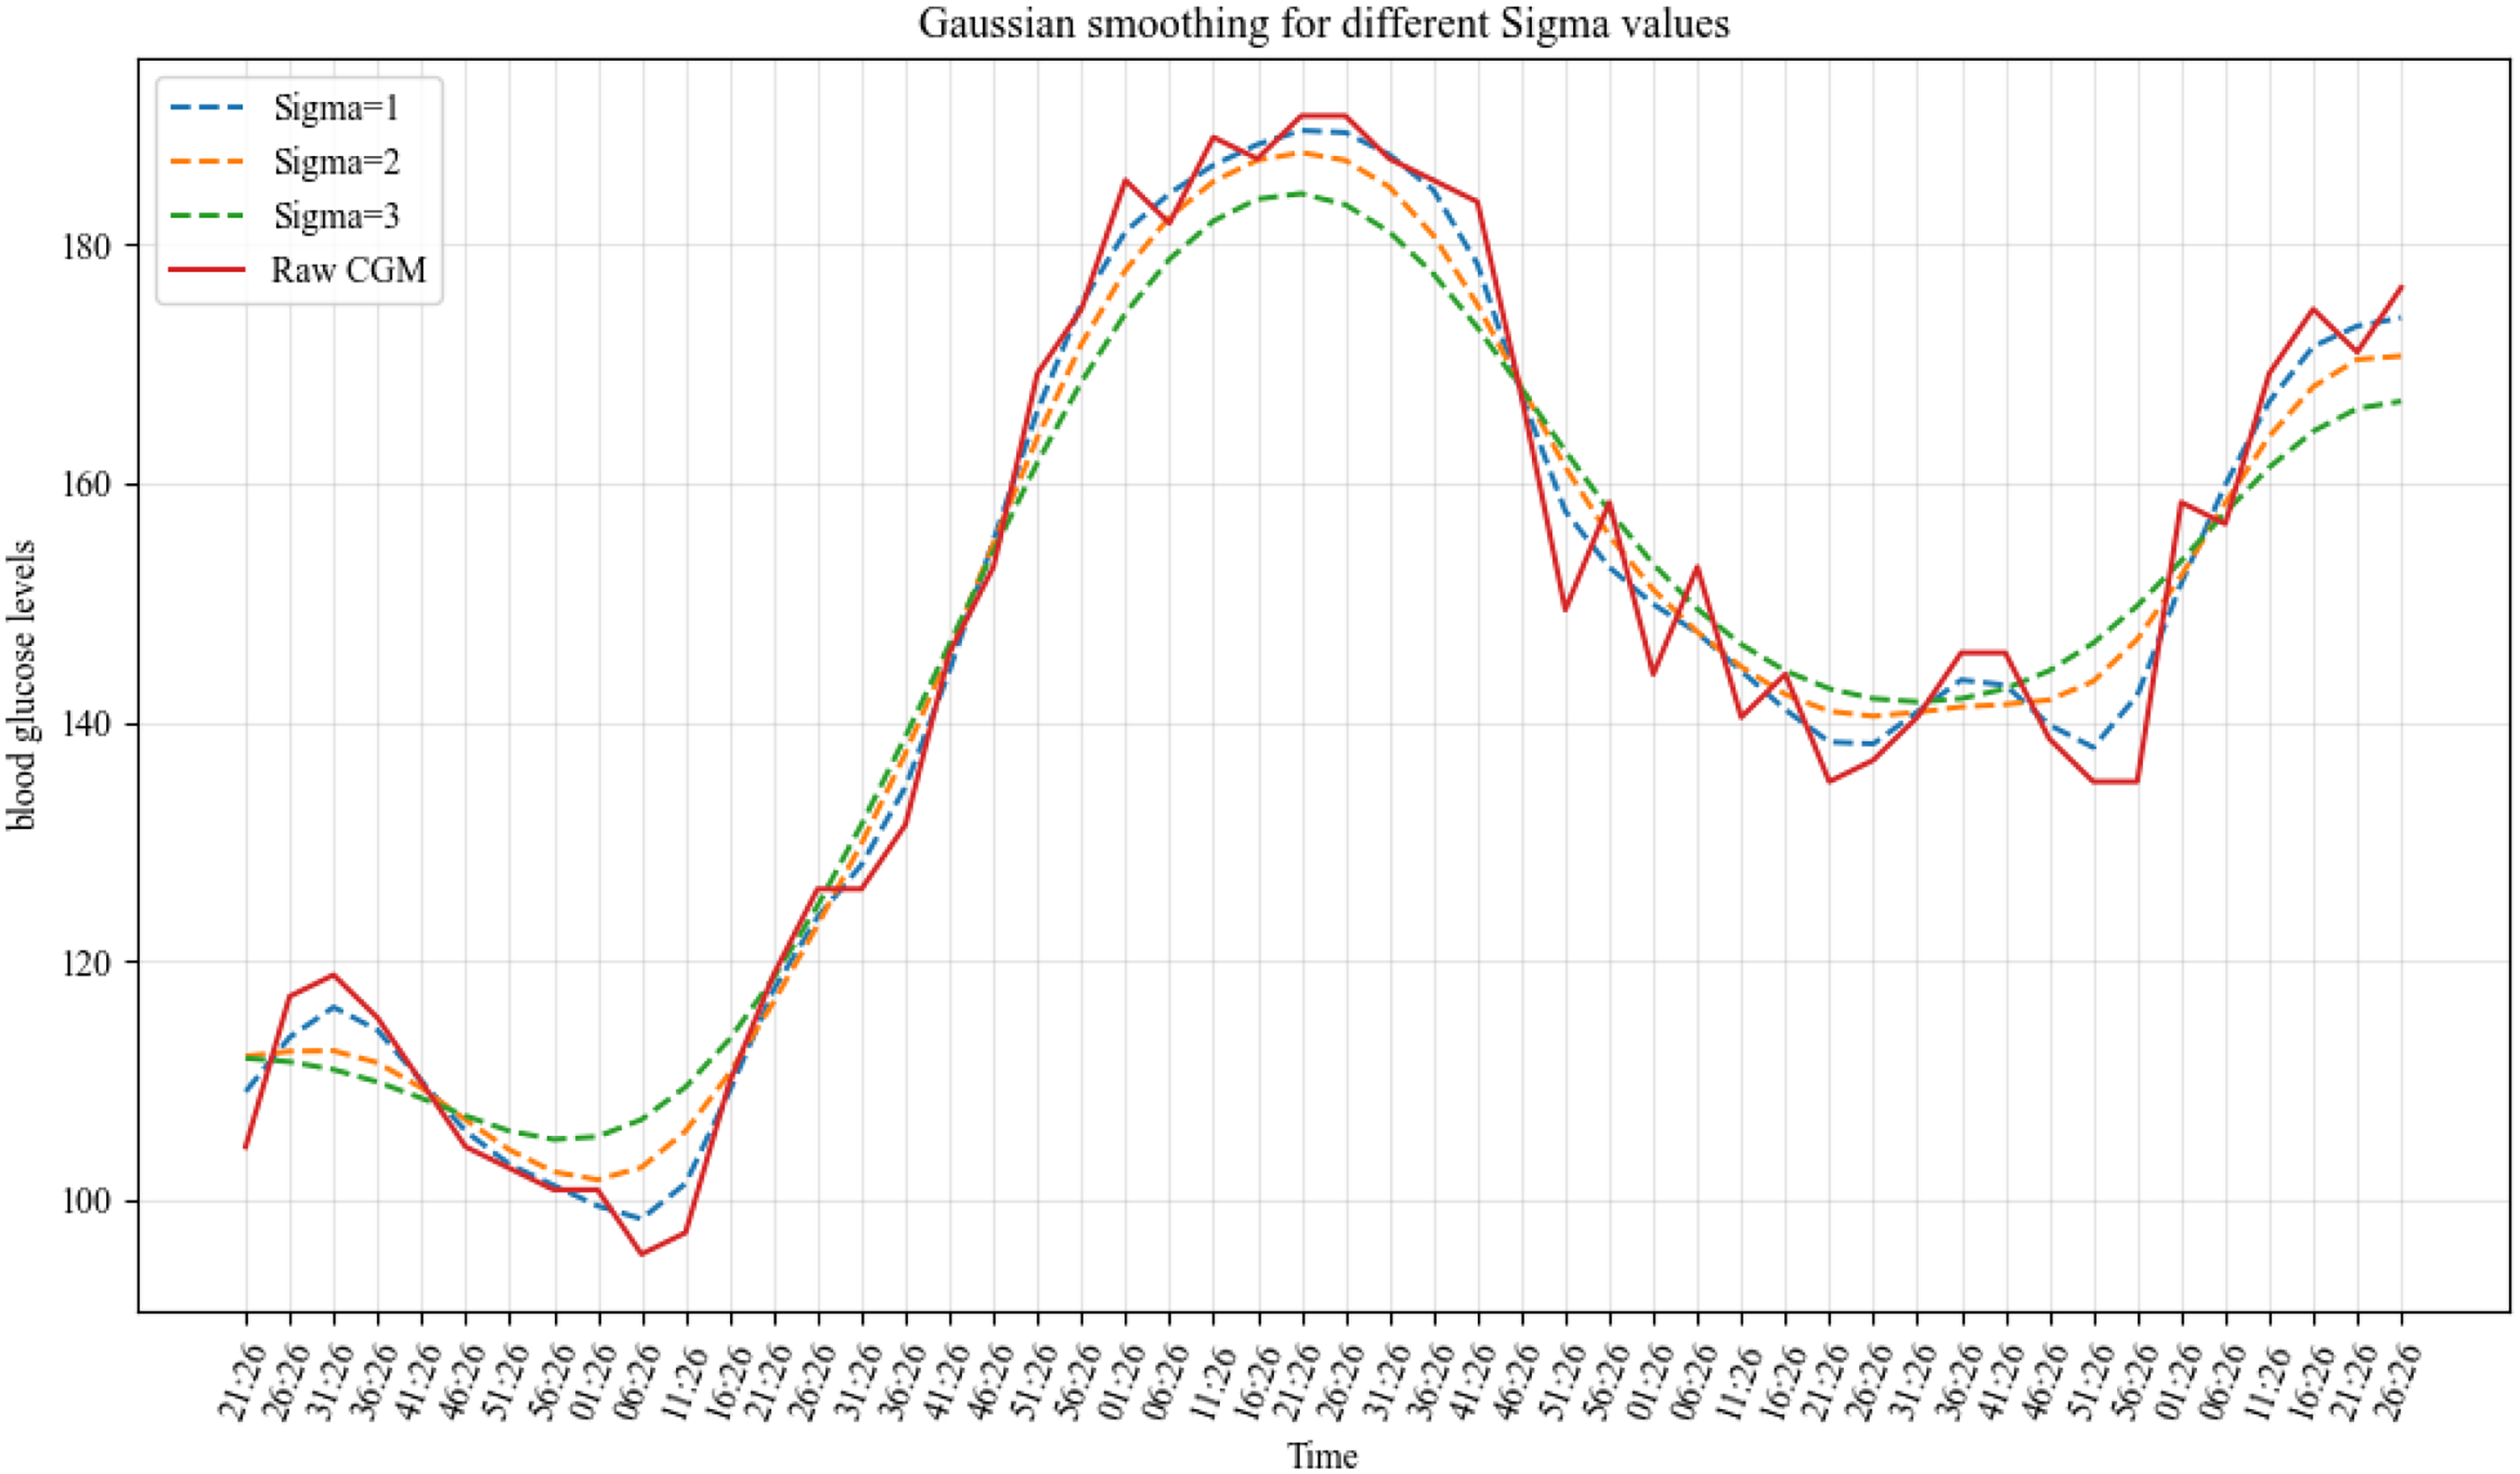
Gaussian smooth comparison of different sigma values.
Time feature extraction
Converting temporal information into features such as year, month, day, week, hour, and minute enables the model to discern patterns in time series data more effectively. By transforming these temporal features into radians and subsequently applying sine/cosine transformations, time information can be encoded as continuous periodic signals. 20 This approach aids the model in comprehending the periodic fluctuations within time series data more accurately and facilitates the capture of continuous temporal variations. Consequently, the model can represent temporal information as abstract features rather than mere specific dates or timestamps.
Data normalization
When handling personalized patient feature data, the first step involves normalizing the features to the [0,1] range. This step aims to eliminate the differences in scales between features, ensuring that they are within the same numerical range. This mitigates the risk of certain features disproportionately influencing model training, thereby enhancing model stability and reliability. Normalized data also accelerate the convergence speed of the model and reduce its susceptibility to noise interference. 21
Window partitioning and dataset splitting
The data provided by the hospital include blood glucose data, insulin bolus doses, and meal records for 13 T1D patients. Initially, the blood glucose, insulin, and meal data are aligned based on time to ensure completeness at each time point. Subsequently, a sliding window approach is applied to partition the data sequences for each patient. The window length is set to 48 with a step size of 1. The input features for each window consist of a 48-length time series, with the target value being the blood glucose values at n time steps after the window ends. In this process, data from past time steps are used as inputs, while data from future time steps are used as target values, transforming the time series prediction problem into a standard supervised learning problem.
Specifically, each sample consists of a 48-length input sequence and a n-length label sequence, denoted as ([x1, x2, x3, …, x48], [y1, y2, …, yn]). For a blood glucose value sequence of length L, it can be divided into L – 48 – n + 1 samples, where n represents the prediction range. Subsequently, all samples are split into training and testing sets in a ratio of 8:2.
Main_feat represents the main features, Time_feat represents the time features (sine and cosine transformations of year, month, day, hour, minute, and second), and BaseInf represents the personalized features. The neural network model for blood glucose prediction is illustrated in Figure 3.

Diagram of the proposed deep learning model.
Evaluation indicators
Analysis and evaluation
Based on previous research, in this study RMSE and mean absolute error (MAE) are selected as evaluation indicators. The RMSE calculation formula is:
The MAE calculation formula is:
Clinical evaluation
Error grid analysis is widely recognized as a clinical interpretation in blood glucose prediction tasks. 22 Therefore, in this study EGA is used to evaluate the severity of errors in clinical aspects. The measured BGC and predicted values are depicted on a scatter plot with five significant regions. Based on these assumptions, the grid is divided into five different regions representing varying degrees of accuracy and inaccuracy in blood glucose estimation, as illustrated in Figure 4.
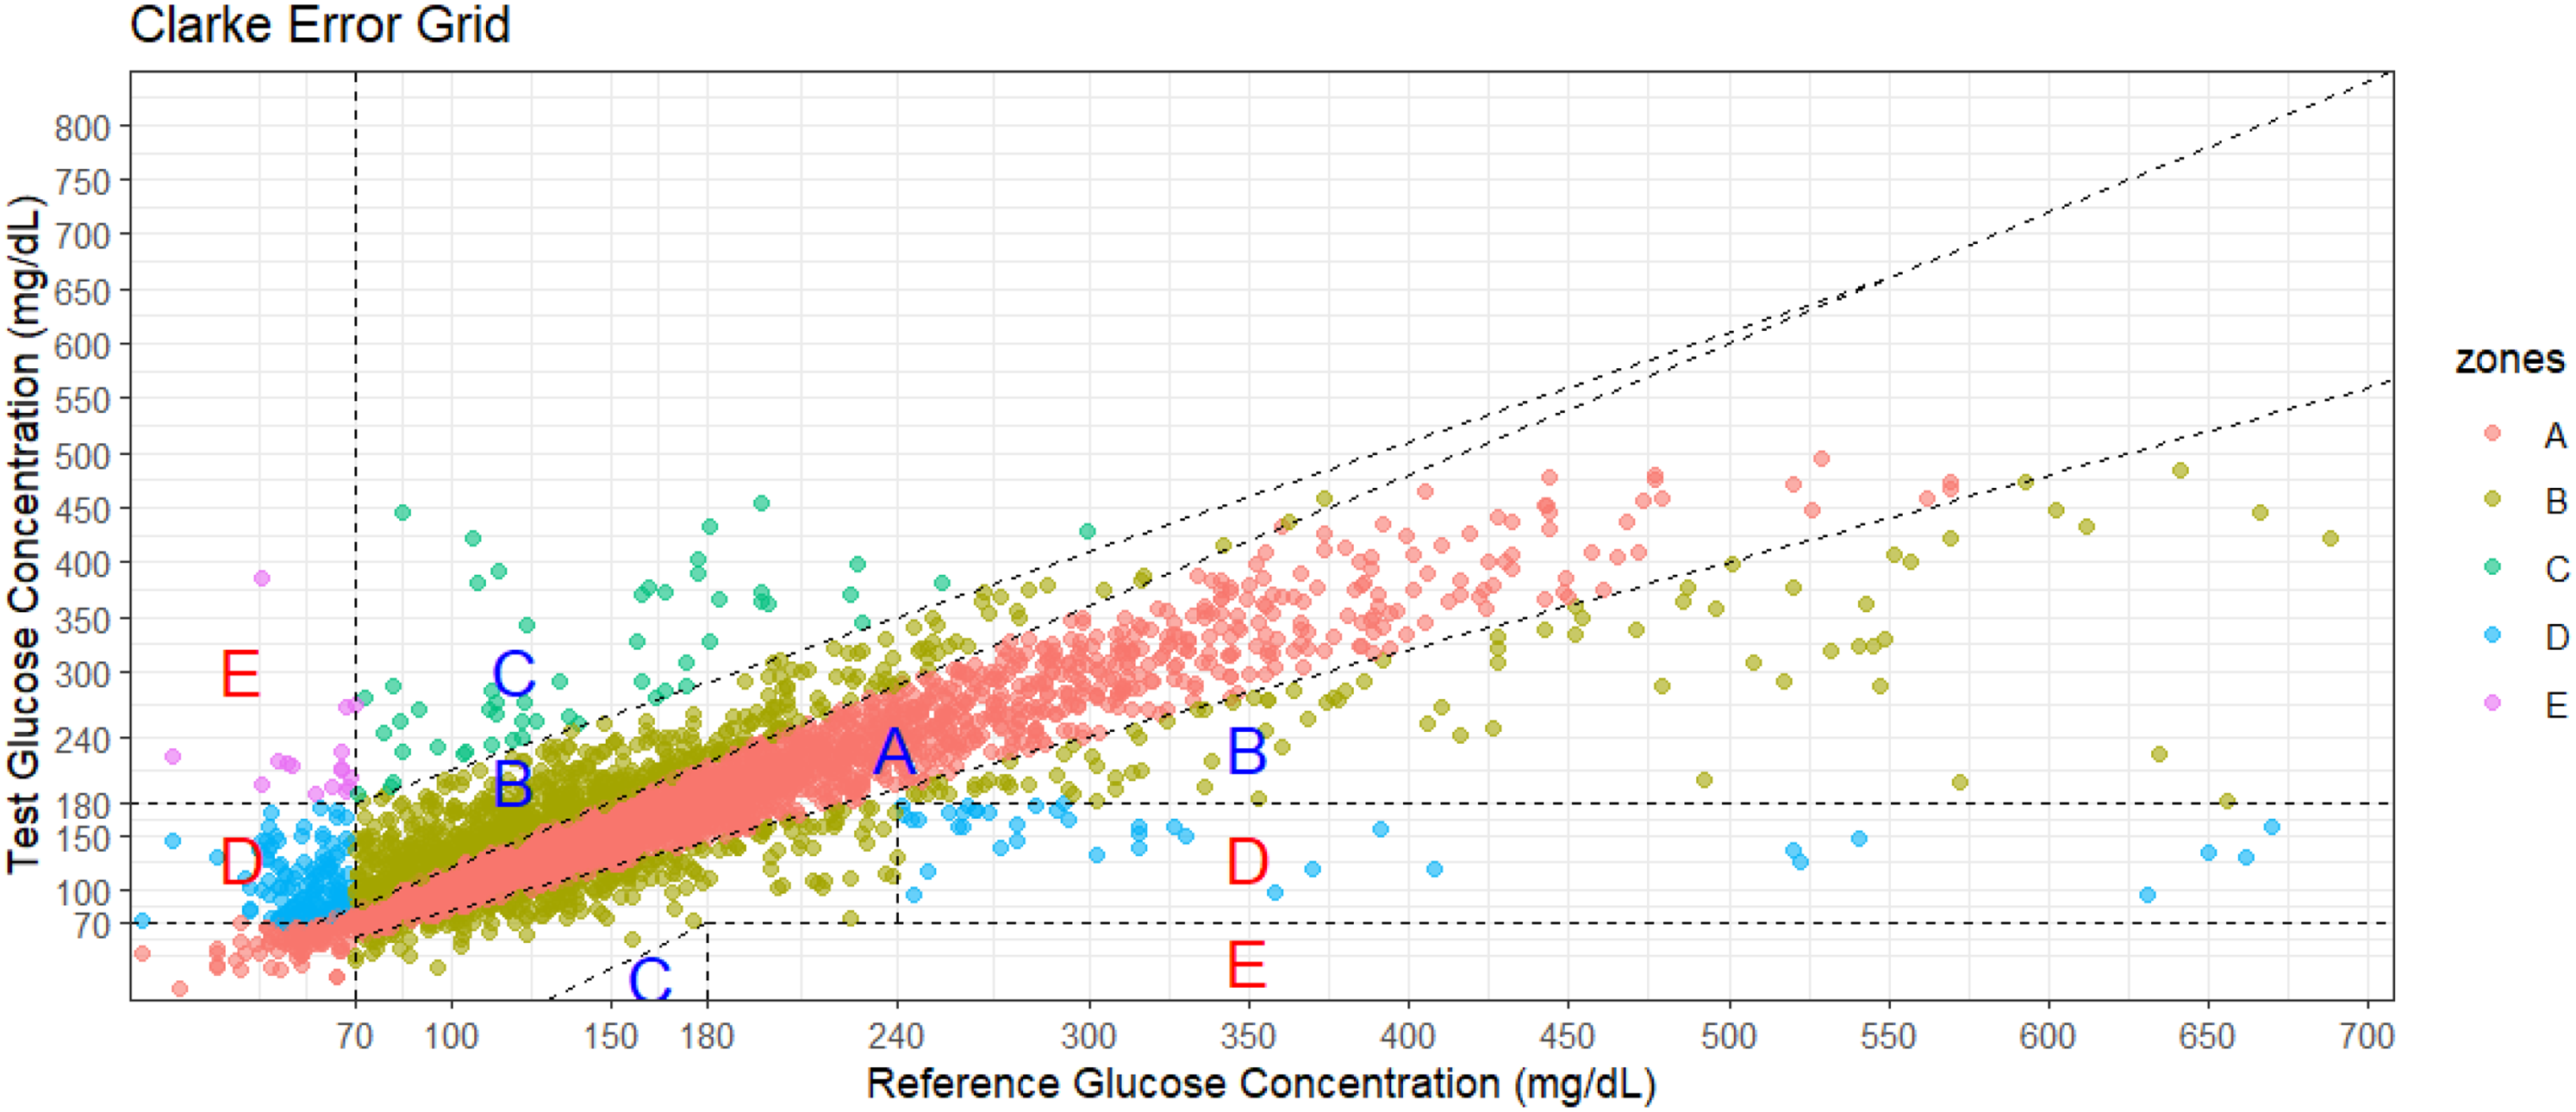
Error grid analysis diagram example.
Zone A represents the range where the deviation between predicted values and reference values does not exceed 20%, or when the reference value is below 70 mg/dL, the blood glucose value falls within the hypoglycemic range (<70 mg/dL). Blood glucose values in this range are considered clinically accurate as they aid in making appropriate treatment decisions. 22
Upper and lower parts of Zone B represent values deviating from the reference by >20%, which, according to assumptions, would result in benign treatment or no treatment. 22
Zone C values would lead to excessive correction of acceptable blood glucose levels, potentially causing actual blood glucose to fall below 70 mg/dL or rise above 180 mg/dL. 22
Zone D represents errors of “dangerous failure to detect and treat.” Actual blood glucose values are outside the target range, but the patient-generated blood glucose values fall within the target range. 22
Zone E is the “mistreatment” zone. Values generated by the patient in this area are opposite to the reference values, thus resulting in treatment decisions opposite to those required. In summary, values in Zones A and B are clinically acceptable, while those in Zones C, D, and E pose potential risks and are therefore significant clinical errors. 22
Results
Experimental setup
Both the clinical dataset and the simulated dataset consist of two independent files for model training and testing. The training set is used for model construction, training, and hyperparameter tuning. After each training epoch, the model undergoes validation on the validation set. This validation process includes computing the total validation loss and the model's prediction accuracy on the validation set. Performance evaluation metrics are calculated based on the predicted results obtained from the test set. The model undergoes five training runs, each comprising 300 epochs, utilizing early stopping with a patience value of 10. The best-performing model on the validation set is saved after each run.
The initial learning rate is set to 0.0001. Adam optimizer is chosen, which adapts the learning rate for each parameter based on the first and second moments of the gradients, leading to more efficient parameter updates and accelerated convergence. Additionally, different parameters have different learning rates, enhancing adaptability. 23 During each iteration on the training set, the model simultaneously processes 128 samples and updates its parameters based on the average loss of these samples. Python 3.10 is used as the programming language, and PyTorch 2.0.0 + cu117 framework is employed for model construction and training. PyTorch 2.0.0 + cu117 is a stable version of the PyTorch deep learning framework built on CUDA 11.7, enabling efficient GPU utilization for computational acceleration. The hardware resources utilized for training and performance evaluation consist of a computer equipped with an Intel Core i5 13490F processor and Nvidia GeForce RTX 3060Ti graphics card, with 16GB of memory.
Experimental results
Comparison of prediction ranges for different patients
Table 3 presents the RMSE and MAE of the model for each patient on the test set. Each column displays the RMSE and MAE at different PHs. Comparatively, the prediction performance is better for a 30-min PH than for extended PHs. This behavior is evident as increasing the PH adds complexity. The decrease in prediction performance resulting from the expansion of PHs may also be attributed to increased opportunities for activities such as exercise, insulin dosing, and/or meals. 24
RMSE and MAE with different prediction ranges for each patient.
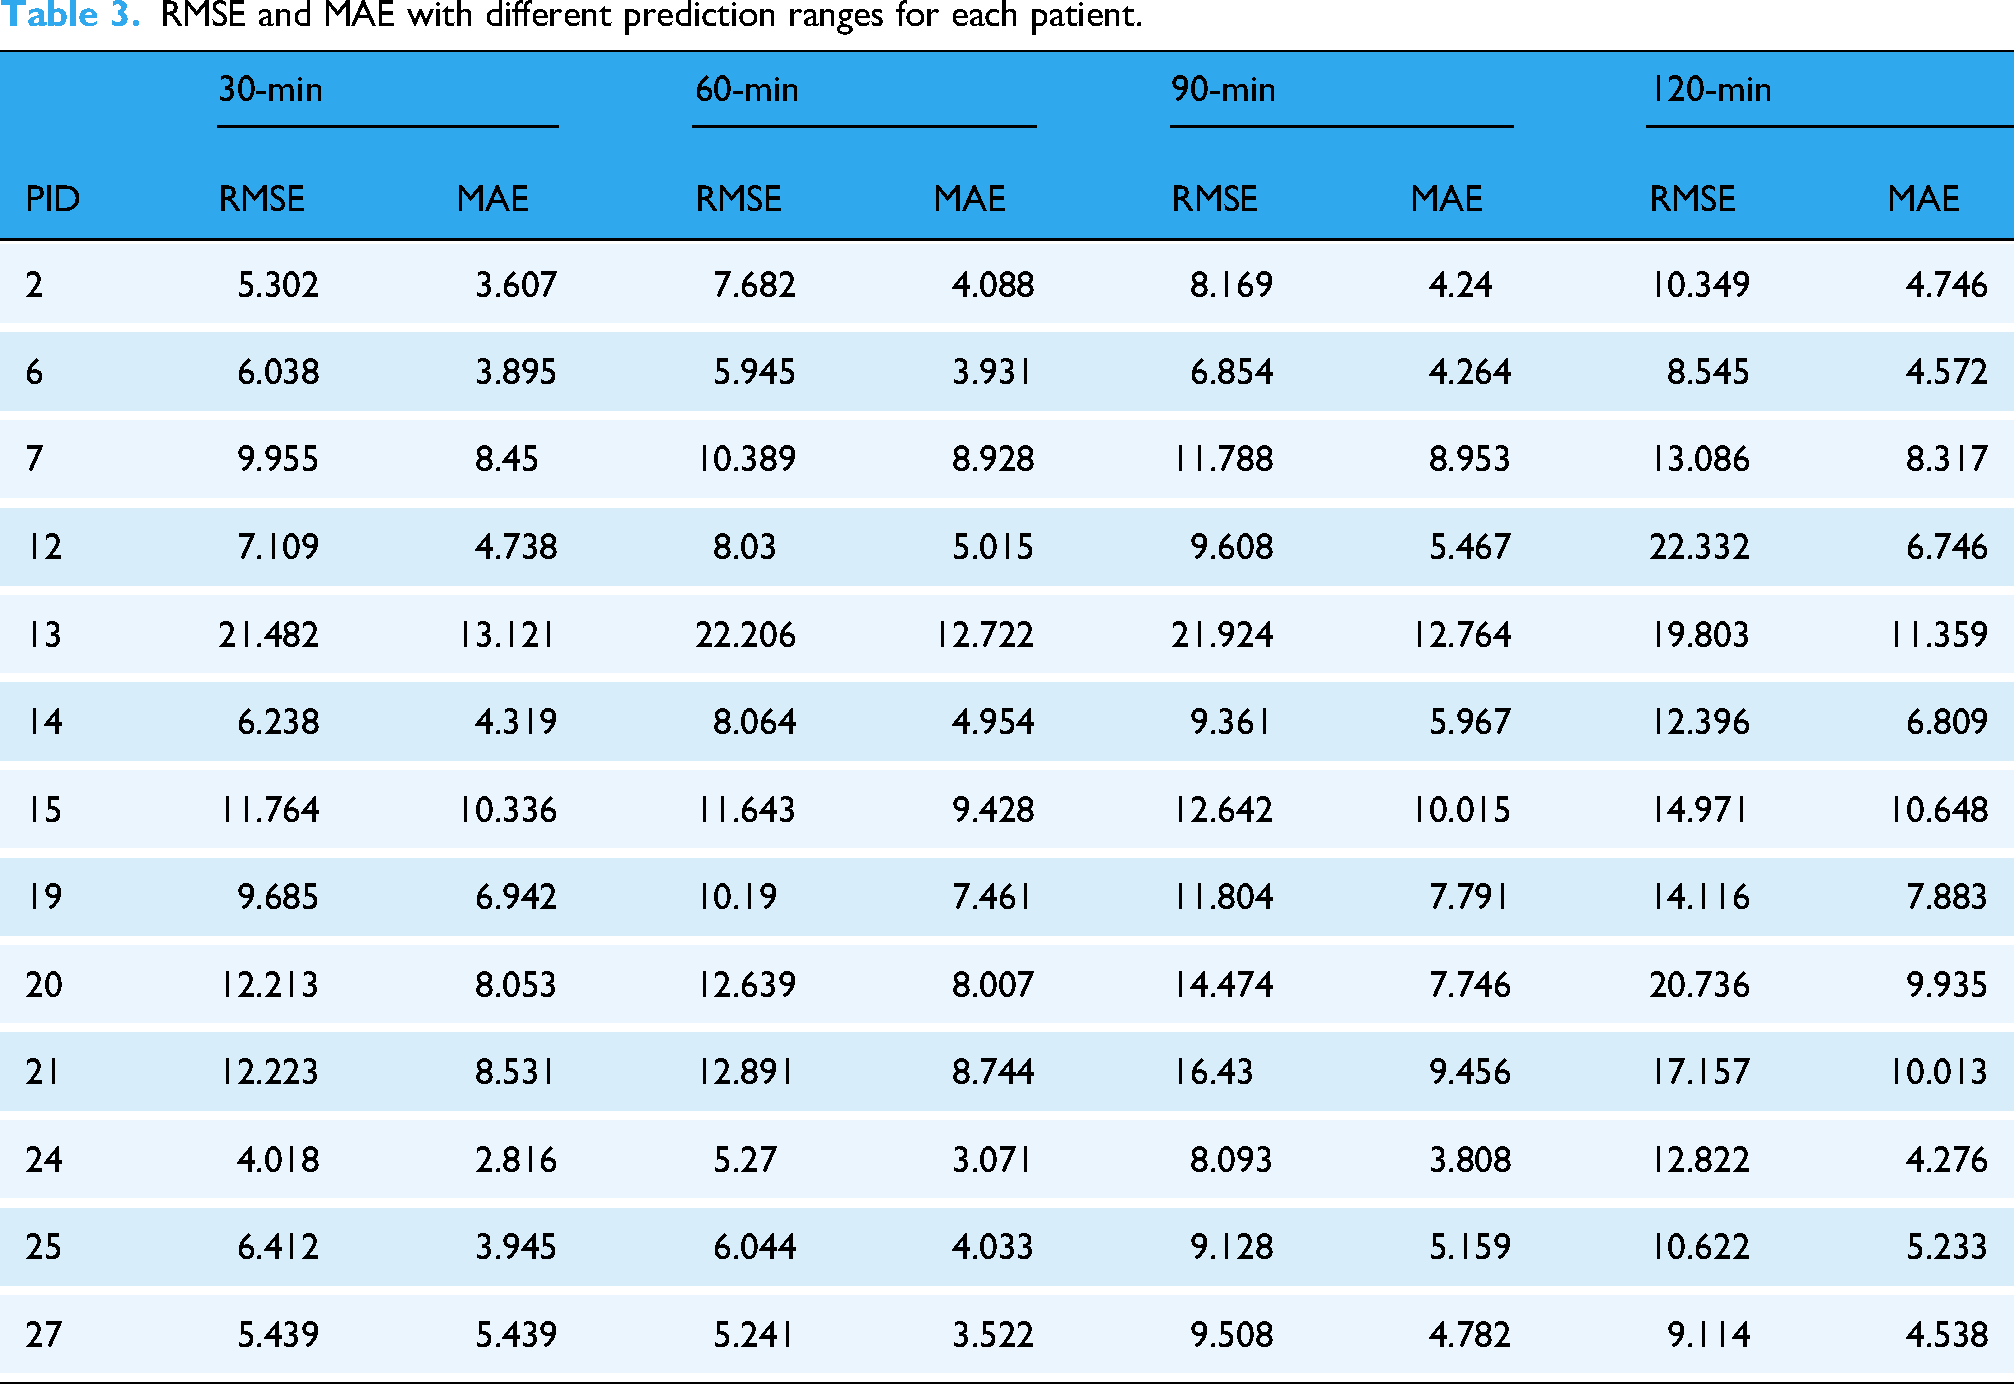
As the PH increases, errors generally grow due to accumulated inaccuracies, leading to instability in long-term predictions. Patients 13 and 20 in Table 3 show the highest errors, mainly due to discontinuities in their blood glucose data, where gaps between data points disrupt the linear interpolation process.
Surprisingly, the RMSE for patient 13 decreases with longer horizons (e.g., 120 min, RMSE = 19.803). This could be because the model captures the overall blood glucose trend better over longer periods, smoothing out short-term fluctuations and improving prediction accuracy.
The model's Clarke EGA plots for different PHs on the test set are shown in Figure 5. As the PH values increase, the predicted results become more dispersed. However, it is encouraging to note that even when the PH value reaches 120 min, the majority of predictions still fall within the clinically accepted boundaries of zones A and B. Table 4 summarizes the clinical assessment of the EGA on the clinical dataset, indicating that the model's performance remains at an acceptable level even under higher PH conditions.
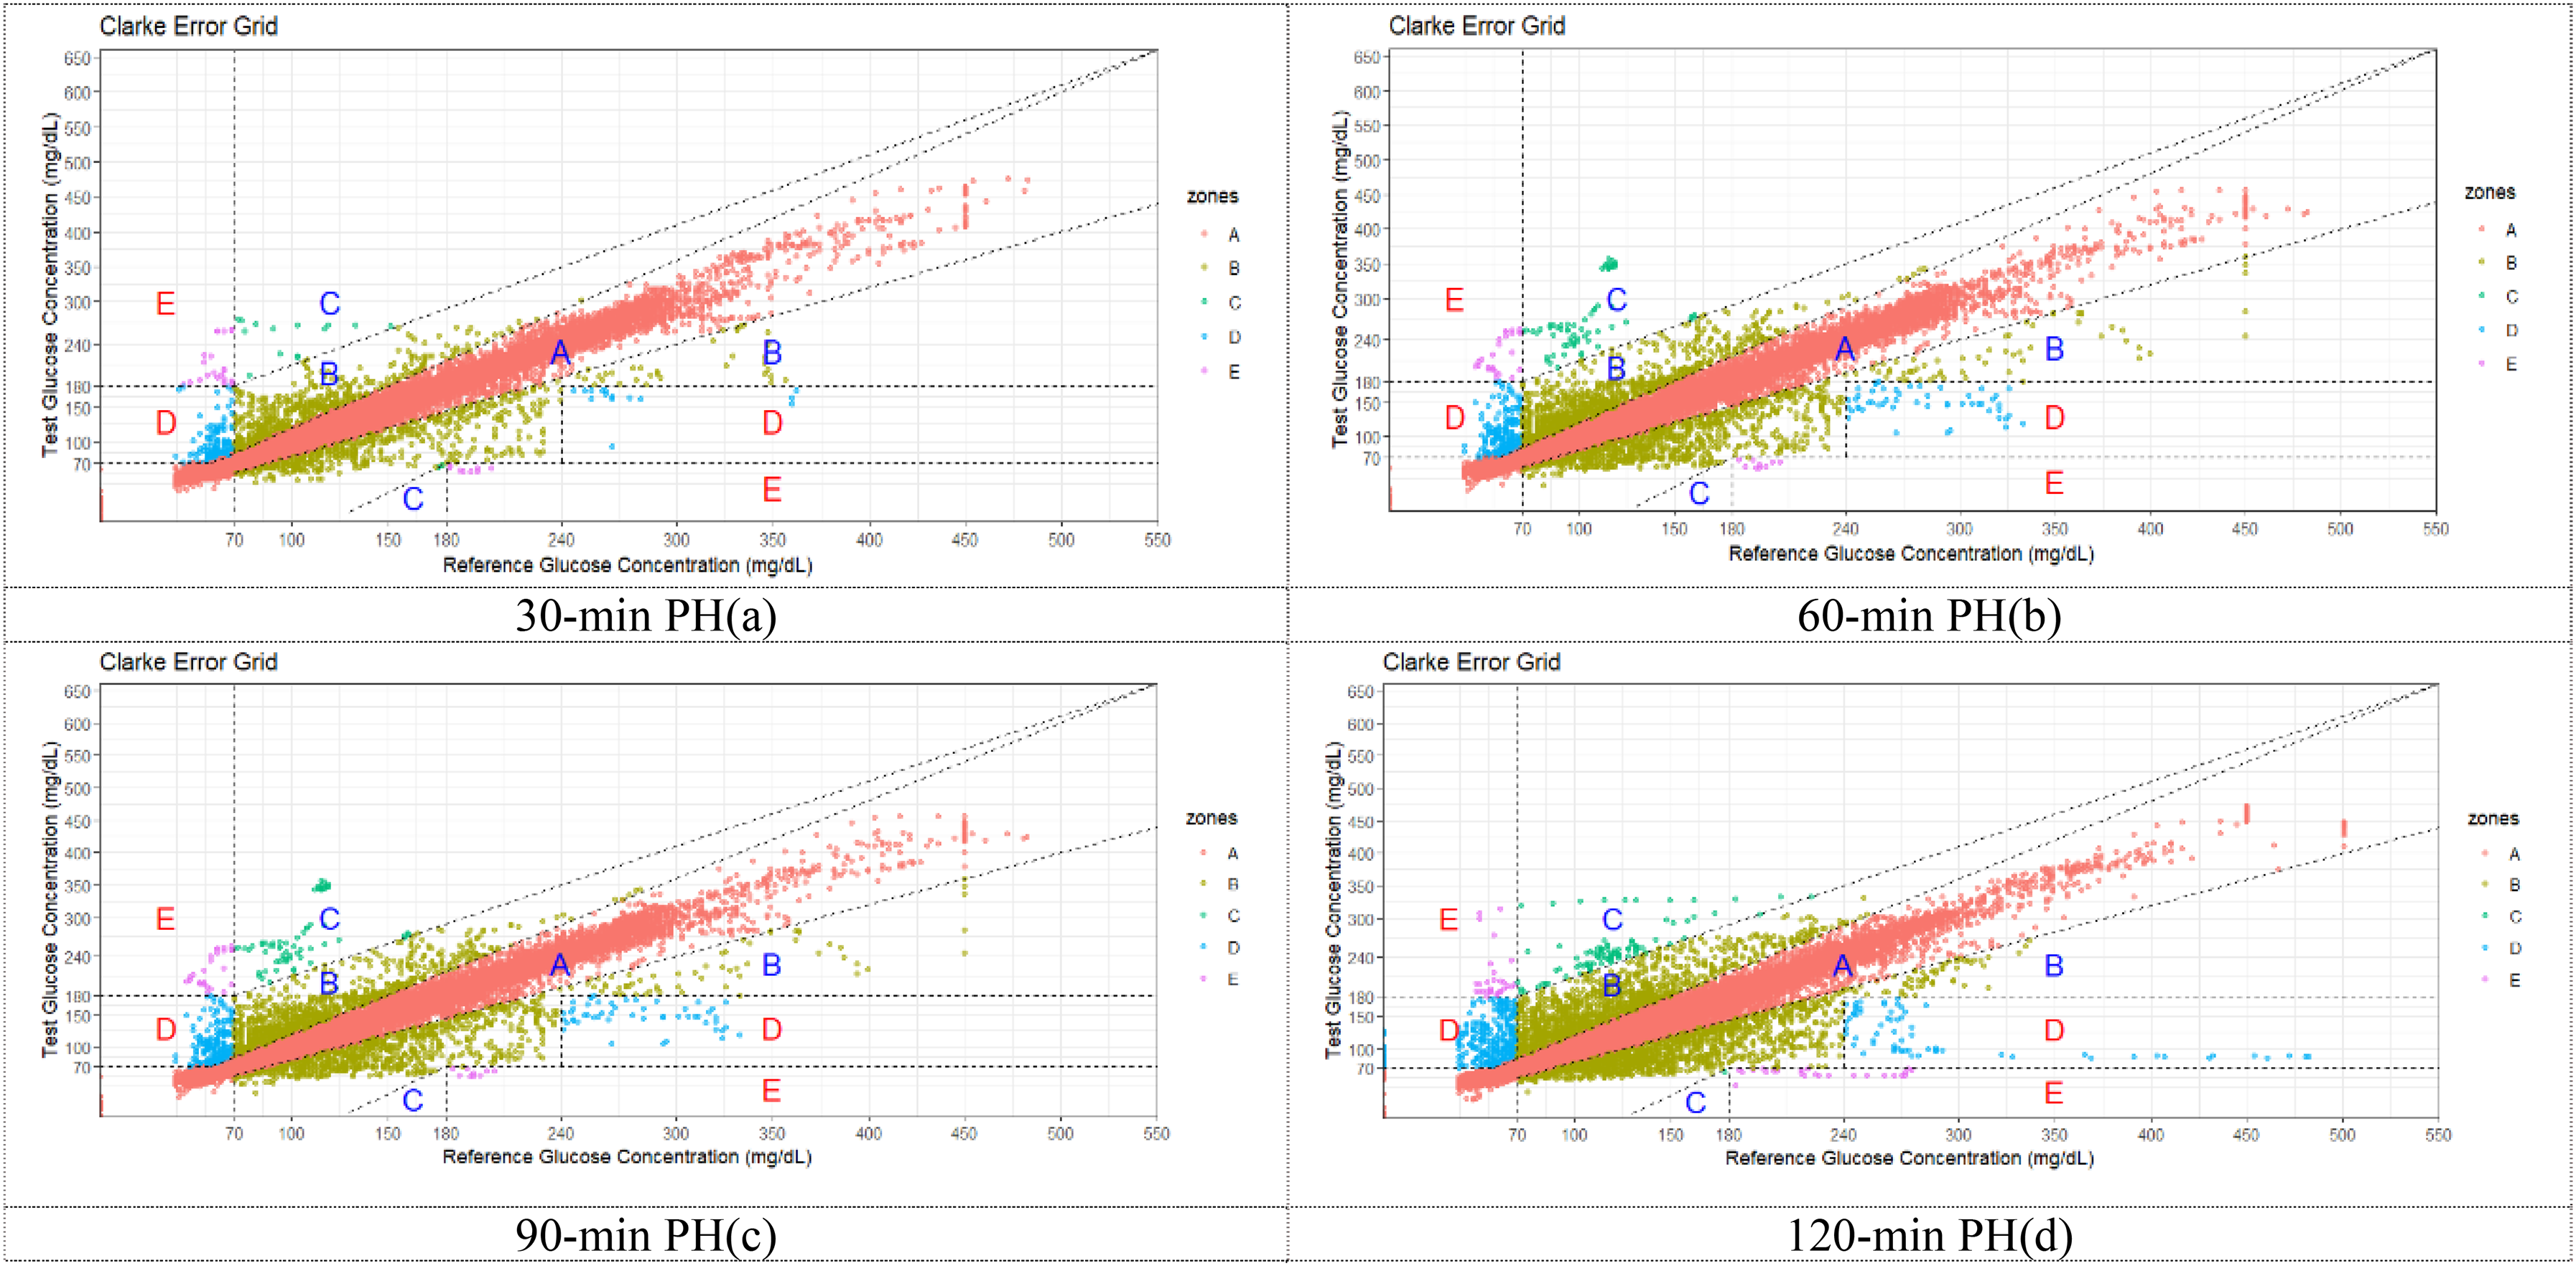
Error grid analysis (EGA) plots for different prediction ranges on the test set.
Summary of Clarke error grid analysis for different PH.

Note. “A + B” represents the combination of regions A and B, representing clinical safe predictions. “C + D + E” represents the combination of regions C, D, and E, collectively representing clinically unsafe predictions.
Additionally, for qualitative assessment, Figure 6 presents the 24-h blood glucose predictions and reference trajectories for patient ID 12 at 30, 60, 90, and 120 min PHs, respectively. The cyan solid line represents the reference BGC values obtained from CGM devices, while the red solid line denotes the predictions made by the proposed model.

Comparison of predicted values and reference values in different prediction ranges for patient 12 in one day. (a) The deviation between the predicted values and the actual values is relatively small. (b) The deviation between the predicted values and the actual values begins to increase. (c) The deviation between the predicted values and the actual values becomes more pronounced. (d) The deviation between the predicted values and the actual values is the greatest.
Comparison with other methods
Through the same procedure, the simulator-generated data underwent preprocessing and integration before being input into our model for prediction. Table 5 presents the prediction errors (RMSE and MAE) for different PHs using the UVa/Padova simulator dataset, comparing our model with others. The results of all these comparison methods are taken from the corresponding papers, and all models used the same dataset. Our model (Ls-Encoder) outperforms others with significantly lower RMSE and MAE across all horizons, particularly at 30 and 60 min. Overall, the Ls-Encoder model demonstrates superior performance in both short- and medium-term predictions, reducing errors and surpassing most existing methods.
Summary of prediction errors for different models at various pH levels in the simulated dataset.

Note. Bold values indicate the best performance algorithm for each PH.
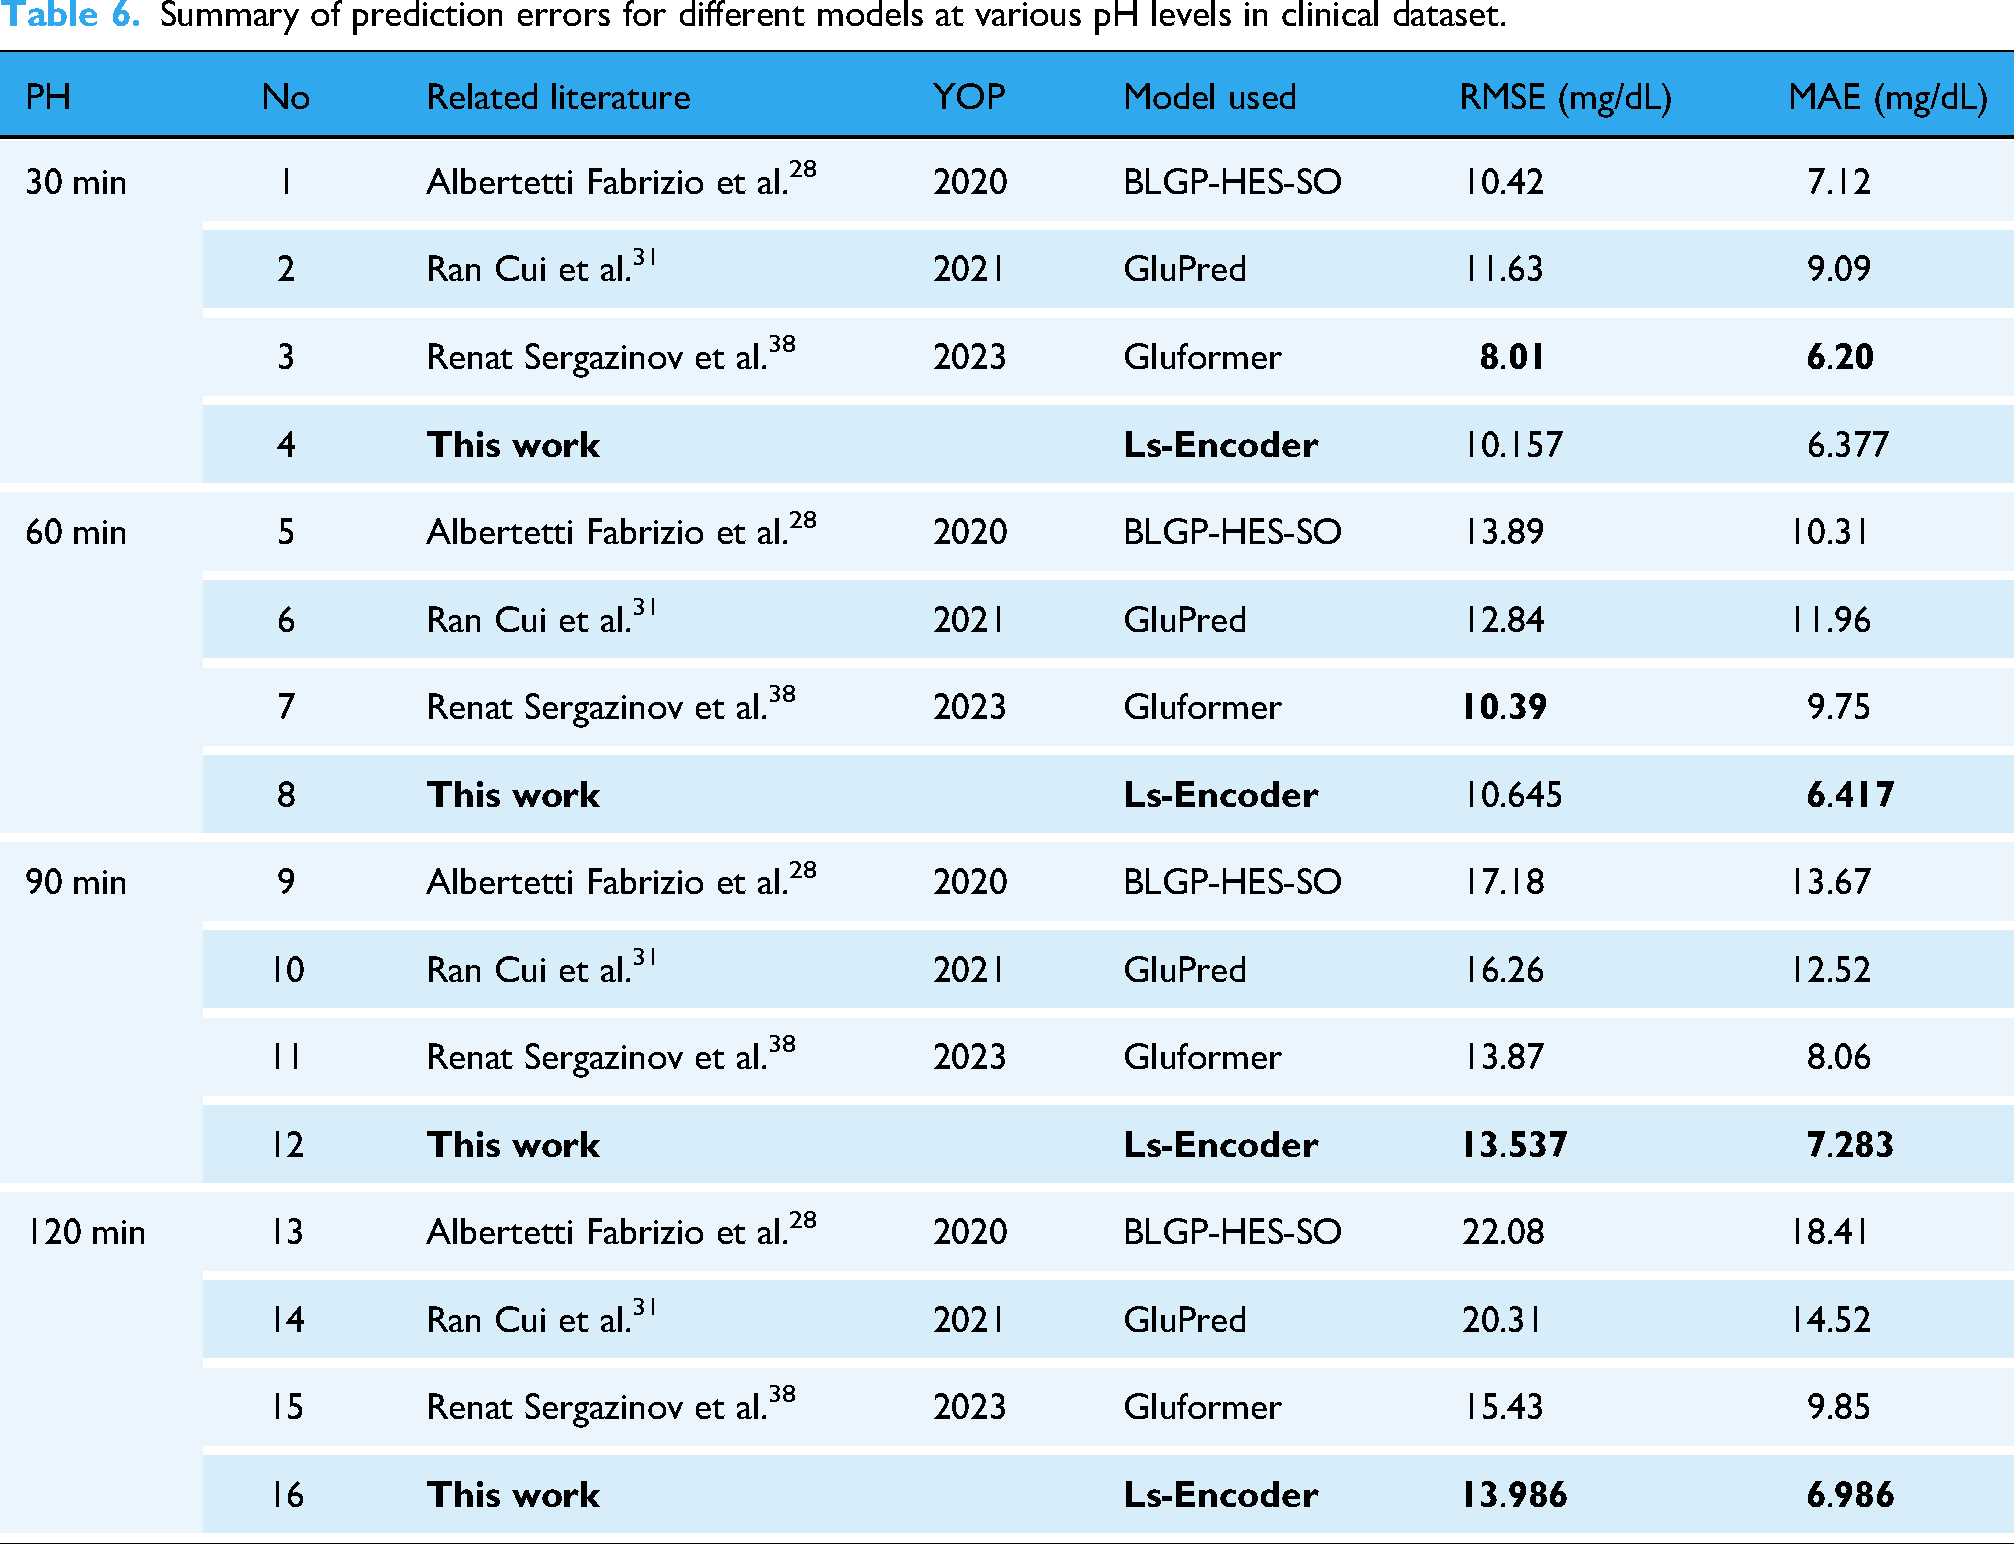
Table 6 summarizes the performance of different models in blood glucose prediction on the clinical dataset, comparing RMSE and MAE metrics. For the 30-min prediction, Gluformer achieved the best performance (RMSE 8.01, MAE 6.20), while Ls-Encoder showed slightly inferior results (RMSE 10.157, MAE 8.87). In the 60-min prediction, Ls-Encoder demonstrated competitive performance close to Gluformer (RMSE 10.645 vs. 10.39, MAE 10.11 vs. 9.75). For the 90-min and 120-min predictions, Ls-Encoder exhibited significant advantages, achieving the best performance in the 120-min prediction (RMSE 13.986, MAE 6.986). Overall, Ls-Encoder outperformed other models in long-term predictions.
Summary of prediction errors for different models at various pH levels in clinical dataset.
Discussion
In this study, our proposed model exhibited strong performance in blood glucose prediction tasks, particularly in the long-term prediction scenarios (90 min and 120 min), where it outperformed other recent approaches. Error grid analysis results also show that our model performs well in clinical accuracy, providing predictions within clinically acceptable ranges. The error generally increased with the extension of the prediction range, a typical challenge in long-term glucose prediction due to the accumulation of inaccuracies over time.
When comparing the results of our model with other recently proposed methods (as shown in Table 6), our hybrid model, which integrates Bidirectional LSTM and Transformer Encoder layers in parallel stands out by simultaneously capturing both short-term and long-term dependencies. Existing models often face limitations, such as reliance on short data durations, computational complexity, and sensitivity to data quality. For instance, approaches such as ANN and RNN models are constrained by short-term data, limiting their ability to capture long-term glucose trends. Additionally, models that separate LSTM and Transformer layers often lose valuable information when processing features individually. These methods also tend to overfit, especially when trained on small datasets or noisy data.
Our hybrid model integrates Bidirectional LSTM and Transformer Encoder layers in parallel, enabling the simultaneous capture of both short- and long-term dependencies, which improves prediction accuracy. By combining richer features, such as personalized patient data and meal information, and incorporating dropout layers to prevent overfitting, our model is more robust and adaptable, even in the presence of noisy or incomplete data. Experimental results demonstrate that this innovative integration and enriched feature set significantly enhance the accuracy and robustness of blood glucose prediction, providing a more comprehensive and reliable framework for long-term glucose forecasting compared to other state-of-the-art methods.
In parallel, by incorporating glucose data, insulin dosages, and meal composition, our model can help predict and manage diabetes onset or worsening in post-COVID patients, supporting timely clinical interventions. 32 Integrating metabolomic data could also improve the early identification of patients at risk for severe outcomes, enhancing personalized T1D management. 33 Our model analyzes real-time glucose data and clinical indicators to provide personalized predictions, helping mitigate risks similar to those in hypertension-related brain damage. 34 Additionally, incorporating immune response parameters can enhance predictions of T1D patients’ responses to immunotherapy, optimizing treatment plans. 35 Finally, while some studies focus on insulin transcription, our model offers a long-term perspective by predicting blood glucose levels and insulin–glucose interactions. 36
Despite promising results, the internal mechanisms and decision-making processes of the model remain unclear. In clinical practice, model interpretability is crucial for gaining the trust of healthcare professionals and patients. Although this study demonstrated a favorable performance, future research must prioritize enhancing the model's transparency to provide clearer insights into how predictions are made. Additionally, the dataset used in this study was limited to T1D patients from specific regions, which could restrict the generalizability of the model. Future research should focus on diversifying the dataset by including data from different regions and ethnic groups, which would enhance the model's applicability to a broader population.
Moreover, while the current model has demonstrated its potential in laboratory settings, further optimization is necessary to improve its performance and efficiency. Input from clinical experts is crucial for developing practical models that can be integrated into real-world clinical practices.
In conclusion, this study demonstrates the promising potential of combining Transformer and LSTM models for blood glucose prediction in T1D patients. The findings serve as a solid foundation for future research aimed at improving diabetes management. However, it is critical to recognize the current limitations, including the generalizability of the model, the interpretability of its predictions, and the potential biases introduced by dataset limitations. Future work should focus on optimizing the model's structure, expanding the dataset, and collaborating with clinical experts to refine the model's real-world applicability. Ultimately, these efforts will help improve the quality of life for T1D patients by providing more accurate, personalized diabetes management solutions.
Footnotes
Acknowledgements
This work was supported by Special Project for “Famous Doctor” of Yunnan Ten Thousand Talents Plan (grant numbers YNWR-MY-2019-020).
Guarantor
XX
Ethical approval
The study was conducted in accordance with the Declaration of Helsinki, and approved by the Institutional Review Board (or Ethics Committee) of Yunnan First People's Medical Ethics Committee (protocol code KHLL2022-KY165, and date of approval: 18 October 2022).
Informed consent
Informed consent was obtained from all subjects involved in the study.
Contributorship
Conceptualization, Xin Xiong and JianFeng He; methodology, Xin Xiong and Yunying Cai; software, Yuxin Xue; validation, Xin Xiong, Yunying Cai, and JianFeng He; formal analysis, Xin Xiong and JianFeng He; investigation, Xin Xiong and JianFeng He; resources, XinLiang Yang; data curation, XinLiang Yang; writing—original draft preparation, Yunying Cai; writing—review and editing, Yuxin Xue and JianFeng He; visualization, Heng Su; supervision, JianFeng He; project administration, XinLiang Yang; funding acquisition, XinLiang Yang. All authors have read and agreed to the published version of the manuscript.
Funding
The authors received no financial support for the research, authorship, and/or publication of this article.
Conflicting interests
The authors declared no potential conflicts of interest with respect to the research, authorship, and/or publication of this article.
Data availability
The datasets generated and/or analyzed during the current study include two datasets: 1. The dataset collected from T1D patients in the First Renmin Hospital of Yunnan Province is not publicly available due to privacy concerns. 2. The second dataset was generated using the UVa/Padova simulator. This dataset is not directly available, but interested researchers can generate similar data using the UVa/Padova simulator, which can be downloaded from [![]() ].
].