
Abstract
Background
Current glucose monitoring user interfaces (UIs) are problematic for people with Type 1 Diabetes Mellitus (T1DM) in maintaining recommended blood glucose levels effectively. However, there is a lack of in-depth investigation into this problem when these individuals interpret and make real-time decisions based on the glucose monitoring devices they use daily.
Objectives
We aim to investigate problems associated with glucose monitoring UIs by observing users’ interpretation and decision-making while reading their Continuous Glucose Monitoring (CGM), Flash Glucose Monitoring (Flash) or Self-monitoring of Blood Glucose (SMBG).
Methods
A mixed-method study was conducted. The Think Aloud protocol was used to capture participants’ decision-making process while reading various device UIs. Their responses were evaluated using standard clinical guidance to assess their accuracy. Additionally, a survey was distributed to gather their perceptions of self-management practices.
Results
Twenty-seven participants (17 patients and 10 carers) were recruited. Interpretation accuracy averaged 38.0% ± 11.1% for CGM, 39.5% ± 8.8% for Flash, and 33.3% ± 7.8% for SMBG group. Treatment action accuracy was 21.5% ± 15.6% for CGM, 21.2% ± 14.0% for Flash, and 18.0% ± 13.2% for SMBG group. Despite this, 75.0% of all participants expressed very high confidence in their self-management.
Conclusions
Interpreting and making decisions using glucose monitoring UIs remains significantly challenging for people with T1DM despite their self-perceived performance. Improving such UIs is crucial to reduce misinterpretation and help these individuals make better treatment decisions without relying on their potentially inaccurate interpretations.
Introduction
Continuous Glucose Monitoring (CGM), Flash glucose monitoring (Flash), and Self-Monitoring of Blood Glucose through glucometers (SMBG) are the primary glucose monitoring devices used by people with Type 1 Diabetes Mellitus (T1DM) to monitor their glucose levels. 1 Both CGM and Flash devices involve the attachment of sensors subcutaneously, facilitating the real-time tracking of glucose levels through mobile applications. Regarding SMBG, it requires manual blood sampling, with glucose levels displayed on a glucometer, as depicted in Figure 1. Monitoring glucose levels is paramount for people with T1DM due to the unpredictable nature of glucose fluctuations. 2 Excessively high glucose levels (hyperglycaemia) and excessively low glucose levels (hypoglycaemia) can lead to severe medical displayed in CGM. 9 Previous studies have shown that users face challenges and feel overwhelmed when reviewing and interpreting CGM data. 10 The major issues reported were caused by the unsuitability of commercially available data visualisations,11,12 detail of data and amount of information that causes information overload.13,14 Moreover, different levels of numeracy across individuals with T1DM make interpretation more difficult. 15

Glucose monitoring UIs components annotations: (1) glucose number shows the current glucose reading; (2) trend arrow suggests the predicted trend and rate of change in glucose level: increase, decrease or stable; (3) graph shows historical glucose data; (4) alert banner indicates any potential upcoming scenarios which require timely attention. It appears when the device detects rapid changes in glucose levels.
Given the heavy reliance of people with T1DM on glucose monitoring, the misinterpretation of readings can lead to serious medical situations and result in erroneous decision-making with regard to the administered treatment. 16 For instance, injecting excessive amounts of insulin can lead to hypoglycaemia, while inadequate insulin can cause complications. Consequently, people with T1DM must make additional safety-critical decisions approximately 180 times per day 3 to maintain their blood glucose within the clinically recommended range of 3.9–10.0 mmol/L. 4
Over the past decade, advancements in CGM and Flash technologies have yielded significant improvements in accuracy and user-friendly data presentation.5–8 However, their shortcomings have often been reported in research studies, especially problems associated with interpreting data hyperglycaemia. Both of these scenarios can result in short- and long-term health complications. 17
Related work
Recent research has investigated the interpretation of glucose data in people with T1DM. However, there is limited research that closely examines how people with T1DM review and make decisions in real-time based on their glucose monitoring devices they used on a daily basis.
A recent study observed difficulties in using CGM among people with T1DM. The findings indicate that while most participants consider the trend arrow, glucose readings, and alarms provided by CGM to be useful, the glucose graphs are perceived as less or not useful. 18 Another study found an over-administer insulin issue among patients with T1DM. They highlighted that CGM trend arrows caused the issue as participants tended to over-rely on glucose rate of change when calculating the amount of insulin. As a result, they opted for excessive insulin amounts rather than clinical recommendations. 19 These findings revealed various difficulties faced by people with T1DM in using CGM. However, these results are based on self-reported data and cannot accurately reflect their actual performance and uncover underlying problems.
While some attempts have been made to explore the use of glucose monitoring apps, they did not employ the commonly used CGM mobile applications that were most used by people with T1DM.13,20,21 Therefore, a deeper understanding is required to understand how people with T1DM interpret and make treatment decisions in real-time based on the usual glucose monitoring devices they use in daily management.
The aim of this study was to investigate challenges in glucose monitoring UI interpretation among people with T1DM by conducting a qualitative interview and survey study. We aimed to explore how they interpreted their glucose monitoring UIs in real-time and determine discrepancies between their perception of self-management and actual performance.
Methods
A mixed-method study was conducted involving qualitative interviews and a survey. Participants were asked to verbalise their interpretation and decision-making process toward glucose monitoring UIs. Subsequently, we deployed a survey to gather their perceptions of their diabetes self-management practice.
Participants recruitment
A total of 27 participants (17 patients and 10 carers) were recruited by convenience sampling (Table 1). Eligibility criteria were as follows: clinically diagnosed with T1DM for more than 2 years or have provided care for a person diagnosed with T1DM, ≥18 years old, used a CGM, Flash or SMBG device and were able to speak and read in English. We recruited participants from online diabetes communities and through physical poster distribution on the University of Manchester campus.
Participant demographic information.

All participants received compensation in the form of a £25 gift card. This study received an official ethical exemption approval from the Research Governance, Ethics and Integrity Department and the University Research Ethics Committees at the University of Manchester (Reference number: 2023-17960-30585). No identifiable data was collected in either the qualitative interviews or survey studies.
Study setting
Qualitative interview: A Think Aloud protocol22,23 was applied to understand participants’ interpretive processes and decision-making mechanisms while reading their real-time glucose monitoring UIs. This protocol was chosen due to its ability to connect participants’ thinking processes with their immediate impressions, allowing us to understand their comprehension process while interpreting the UIs. It also allows participants to talk about problems they encounter during the interview.22,23
We manually developed glucose monitoring UIs to present to participants using a photo editor tool to mimic various glucose patterns that people with T1DM face in everyday life. All UIs we developed were assessed by a clinical diabetologist at the Manchester Royal Infirmary. To cover a comprehensive range of glucose monitoring devices, we included the UIs of three major glucose monitoring devices: Dexcom G6 (CGM device), FreeStyle Libre 2 (Flash device) and Contour Next One (SMBG device), which are clinically prescribed by the National Health Service (NHS) in England.24,25 Each participant was presented with the set of UIs representative of their currently used device to minimise bias and confounding factors from the lack of familiarity that could impact their performance. 26 Consequently, the participants were divided into 3 groups: CGM group (Dexcom G6 users), Flash group (FreeStyle Libre 2 users) and SMBG group (SMBG users).
A total of 28 UIs were developed, which will hereafter be referred to as ‘tasks’. Ten tasks were created for the Dexcom G6 and 10 tasks for the FreeStyle Libre 2. Regarding the Contour Next One, 8 tasks were created due to its limited features relative to those of the CGM and Flash devices. In addition, the final three tasks of each set of UIs were presented to participants along with a contextual situation to assess whether it could improve their interpretation. Please refer to Table 5 in Appendix 1 for a detailed description of all tasks.
The one-on-one interview session was conducted by the first author. Prior to the interview, all participants were required to review the consent form displayed on the screen and provide verbal consent. The researcher ticked the consent box on their behalf after receiving explicit permission. Demographic information (age, gender, glucose monitoring device, insulin regimen, duration of diabetes, degree of familiarity with graph/dashboard and Haemoglobin A1C (A1C)) was obtained. The session started by giving participants a short practice session to familiarise them with the interview method. Subsequently, participants were presented with the actual tasks. Following each task, they were asked two questions:
IQ1. Can you tell me what's going on in this screen?
In this question, participants were required to explain what they saw and the meaning of the UI. The aim was to understand their thought process while interpreting the presented UI.
IQ2. What would you do if this screen was yours?
In this question, participants were asked to specify the treatment actions they would take in response to each presented UI.
Questions were open-ended, and participants were allocated unlimited time to answer verbally without the researcher's interference. The role of the researcher was to listen without guiding them toward specific answers and to ask questions for clarification only to limit any potential bias.
Microsoft PowerPoint (version 16.76.1) was used to present each task, with one task per slide. Each slide was inserted with a black slide in between to give participants a moment to reset their attention and focus before seeing the next slide.
Interviews were mainly conducted via Zoom platform (version 5.16.0) with an option to participate in person at the University of Manchester. No video or audio of the participants was recorded in order to comply with institutional ethical regulations. Instead, we opted to use an Artificial Intelligence (AI) tool to automatically transcribe participants’ verbal responses in real-time during the interview. Transcripts were generated using ‘tl;dv’ platform (version 2023). 30 Immediately after the interview, the researcher reviewed the transcript to ensure its correctness, and no personally identifiable participant data was recorded.
Survey study: Post interview, an anonymous survey was sent to the same set of participants to assess their perception of their diabetes self-management practice. The aim was to identify any discrepancy between their perceived and actual performance in interpretation and decision-making. The survey was delivered using a Qualtrics platform (version before December 6, 2023). 31 The list of survey questions is shown in Table 2.
List of survey questions.

Data analysis
In order to evaluate participants’ response accuracy, standard clinical guidance was obtained from a clinical diabetologist at the Manchester Royal Infirmary, which is primarily based on the National Institute for Health and Care Excellence (NICE)
32
(Outlined in Table 10 and Table 11 in Appendix 4). The responses were evaluated against this guidance and categorised into four levels:33,34
All correct: the response fully aligned with the standard clinical guidance. Minor mistake: the response contained a minor mistake, partially aligned with the standard clinical guidance. All incorrect: the response was incorrect and did not align with the standard clinical guidance. Not mentioned: the participant did not mention the component.
The accuracy of participants’ responses was assessed by deconstructing them into main glucose monitoring UI components: graph, trend arrow, glucose number and alert banner, as shown in Figure 1, and treatment decision. In the case of the SMBG UIs, we considered the available features: glucose number and participants’ treatment decision. Figure 2 depicts an example of a response evaluation process.

An example of a response evaluation process. (a) presents Task 4 of CGM group. (b) presents a sample response and (c) shows an example of scoring process. The graph component is scored as ‘All correct’ due to its conformity to standard clinical guidance. Next, the number component is labelled as ‘Minor mistake’ as it incorrectly states that the current glucose number is hypoglycaemia. Further, the trend arrow is not mentioned in the sample response; therefore, it is labelled as ‘Not mentioned’. Finally, the response is considered ‘All incorrect’ for the treatment decision as it mentions waiting for the level to be better. However, the guidance states that the correct insulin dose should be administered, and the level should be monitored again.
The overall accuracy of interpretation and treatment decision was analysed using the weighted average. The ‘All correct’, ‘Minor mistake’, ‘All incorrect’ and ‘Not mentioned’ were given the weight of 2, 1, 0 and 0, respectively.
Regarding the survey study, the survey was recorded using the 5-point Likert scale system. 35 A descriptive analysis was conducted to summarise survey results, with data presented in percentages.
Results
This section presents qualitative interview results. Next, survey results are presented. Finally, the analysis of results is discussed. Due to limited space, the complete list of qualitative interview results is presented in Appendix 2 (Tables 6, 7 and 8).
Qualitative interview results
Task with highest misinterpretation rate: The total accuracy of component interpretation (graph, trend arrow, glucose number and alert banner) and treatment decision-making was analysed. The results are shown in Figure 3.

The overall accuracy of participants’ interpretation combined with their treatment decision accuracy. The results are presented by tasks across all device groups.
In the CGM group, Task 4 had the highest misinterpretation rate, at 25.0% with a 13.9% correct interpretation rate. This task represented a high glucose level of 12.6 mmol/L (Figure 4(a)). However, some participants incorrectly stated that this level was not high glucose level, whereas a level of more than 10.0 mmol/L is considered hyperglycaemic. Additionally, some participants mentioned that they would call their healthcare providers for help despite the standard guidance suggesting injecting insulin and indicating that reaching out to healthcare providers is often unnecessary. My glucose levels are not too high. Because for me, a healthy range shouldn’t go beyond 14 (mmol/L) —Task 4 (Flash group), P12 (patient) I’m going to check if the pump is working well and then call the nurses. Pump and call the nurses. —Task 4 (CGM group), P24 (carer)
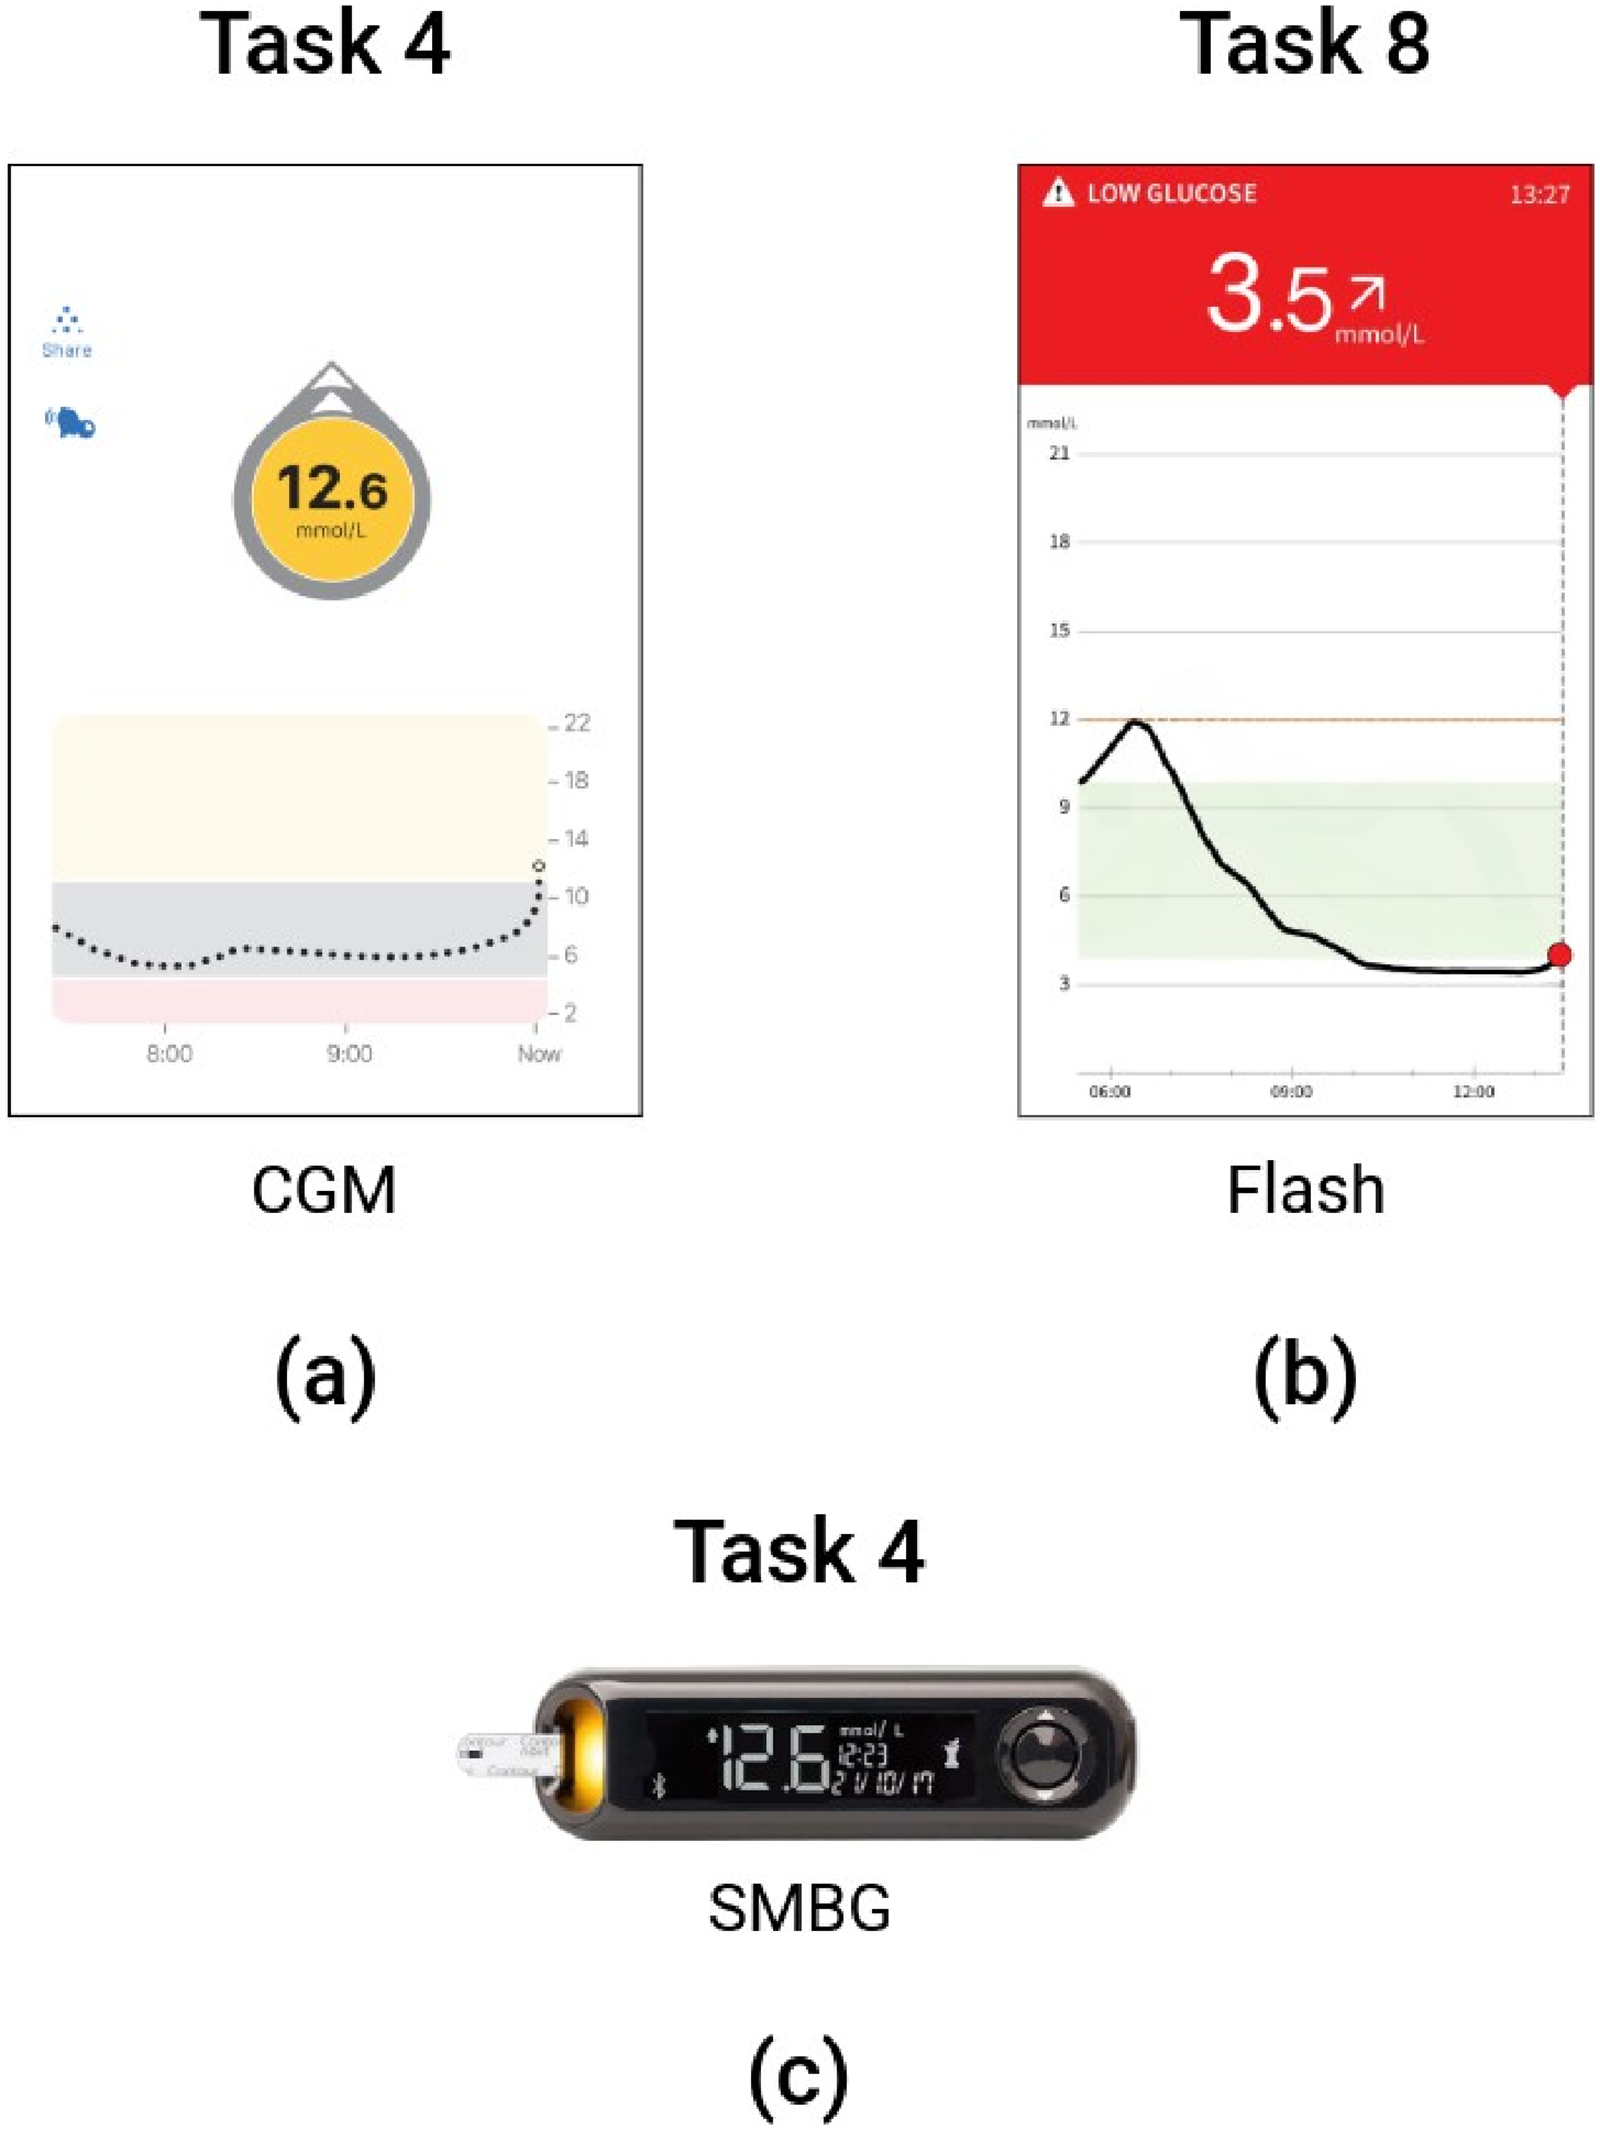
Tasks received highest misinterpretation rate: Task 4 in CGM (a) and SMBG groups (c), Task 8 in ash group (b).'
In the Flash group, Task 8 gained the highest rate of misinterpretation at 11.1% with a 25.0% correct rate. This task represented a low glucose level (Figure 4(b)). A contextual scenario was also provided in which they immediately monitored their glucose level after drinking a glass of sweetened orange juice. Participants incorrectly opted for taking more glucose to raise their glucose levels. However, this was not recommended by standard clinical advice as the orange juice sufficiently increased the blood glucose levels to the target range. Consuming additional glucose could lead to hyperglycaemia.
Finally, in the SMBG group, Task 4 gained the highest misinterpretation rate, at 38.9% with a 38.9% correct rate. This task displayed a high glucose level (Figure 4(c)). The incorrect responses were identified among participants who indicated they would make a phone call requesting help from their healthcare providers.
Graph interpretation: We analysed the total number of participants who correctly interpreted the glucose graph in all tasks. The results are shown in Figure 5. Overall, the results indicated that 56.7% of participants in the CGM group accurately interpreted the glucose graphs, while 73.3% did so in the Flash group.

The overall accuracy of participants' responses. The data are presented by components: graph, glucose number, trend arrow and treatment decision.
A closer observation revealed that Task 8 in CGM and Flash groups (Figure 6(a)) gained the least correct graph interpretation rate, 11.1% and 55.6%, respectively. In this task, participants were presented with a contextual scenario in which they read glucose levels immediately after consuming a glass of sweetened orange juice. Misinterpretations arose, with participants mistakenly assuming that glucose levels would rise immediately after drinking the orange juice. In fact, it takes time for the body to absorb the juice and increase the blood glucose level. I will … quick trip to the hospital to see my GP because that's kind of unusual because if I just had an orange juice you know my glucose levels to be going up not down. —Task 8 (Flash group), P1 (patient)

Glucose graphs in Task 8 for CGM (a) and flash (b) groups.
Based on the demographic data, participants who reported a high degree of familiarity with graphs and/or dashboards did not consistently achieve the highest levels of accuracy. In fact, some participants who reported having slight to moderate familiarity with graphs and/or dashboards outperformed those who reported having a very high familiarity.
We also received some feedback highlighting that the glucose graph in CGM was challenging to comprehend and interpret as it required background knowledge. A participant mentioned that due to their struggles with mathematics, interpreting the graph was difficult for them. I think the numbers are quite understandable for me to just follow down the graph. I wasn’t very good in mathematics back in school, so it's kind of very, I just kind of get more definite understandings from the numbers. —P10 (patient)
Glucose number interpretation
In all tasks across CGM and Flash groups, as shown in Figure 5, we observed a low number of participants mentioning the glucose number. Among those who did, did not provide correct interpretation. Specifically, within the CGM group, 14.4% of participants accurately identified the glucose reading, and 6.7% did so in the Flash group. Regarding the SMBG group, 72.2% of participants interpreted the glucose number correctly.
Following a more detailed analysis, the CGM group had no participants who correctly interpreted the glucose number in Tasks 6, 7 and 9. Also, Task 7 for the Flash group. In case of the SMBG group, Task 8 gained 44.4% correct responses, the lowest rate among other tasks. These tasks represented a variety of glucose readings (Figure 7). It was observed that incorrect responses were from participants’ misinterpretation of high, low, and in-target glucose ranges. Additionally, a prevalent misconception was that healthy glucose levels should not exceed 14.0 mmol/L, whereas the recommended level is less than 10.0 mmol/L.

Tasks received no correct response in glucose number interpretation. For CGM: Tasks 6, 7 and 9. For Flash: Task 7. For SMBG: Task 8.
Trend arrow interpretation
Figure 5 shows that a 7.8% and 6.1% of participants within the CGM and Flash groups, respectively, were able to accurately interpret the meaning of trend arrow. However, the rates of ‘Not mentioned’ responses were relatively high, over 90.0%, for both CGM and Flash groups.
Alert banner interpretation: In Task 6, the UI had an alert message displayed at the top of the screen as the device detected a rapid change in glucose level, requiring timely attention (Figure 8). Regarding the Flash group, none of the participants mentioned this component. Similarly, in the CGM group, one participant mentioned and correctly interpreted it (100.0%). This component obtained the highest ‘Not mentioned’ rate among other components.

Alert banner displayed in Task 6 for CGM and flash UIs.
Treatment decisions
In the CGM group, 43.3% of participants made correct decision on treatment actions, 36.7% in the Flash group and 31.9% in the SMBG group (Figure 5).
Figure 11 shows that the tasks representing the in-target glucose range gained relatively higher correct interpretation rates than other tasks across all device groups. These tasks were Tasks 2 and 5 in the CGM and Flash groups and Task 5 in the SMBG group.
Furthermore, Tasks 1 and 4 (CGM group) had no correct responses from participants, as did Tasks 1, 3, 4 and 6 (Flash group) and Tasks 3 and 7 (SMBG group) (Figure 9). Our observation revealed that incorrect treatment decisions were from participants who mentioned that they would make a call to healthcare providers for help. For example, in Task 4 (Figure 9(b)), representing high glucose level, a carer stated they would call a nurse for help if the glucose level reached 12.0 mmol/L. I would try to calibrate my pump in order to shoot them all … I’m also trying to put a call to my healthcare provider. First, I try to find a way to her But basically I’m going to call first to know, kind of get some advice on what to expect. —Task 4 (Flash group), P2 (patient)

Tasks that received no correct responses in treatment decisions across all device groups.
There were similar responses received in other tasks where participants opted to make a phone call to their healthcare providers. … if it's high you need to ask for help. So, I’ll do what is right by asking for help. —Task 7 (SMBG group), P21 (carer) I will call the nurses because the, it was normal then it like went down and it's very low right now. So I will call the nurses. —Task 1 (CGM group), P29 (carer)
In critical situations, when the device displayed a ‘HIGH’ or ‘HI’ reading (Figure 9(c)), a participant could not recognise the meaning of this reading. While others did not know what treatment actions to take. I don’t understand the reading. I don’t know what to do —Task 3 (SMBG group), P3 (patient) … so probably when I start feeling a bit uncomfortable, I might just, you know, start to dial up for emergency service, you know, to kind of notify them. —Task 3 (Flash group), P2 (patient)
Survey study results
Of the total number of participants (n = 27), we received responses from 20 participants, and the remaining 7 participants did not respond (The full result table is provided in Table 9 in Appendix 3).
Over half (55.0%, n = 11/20) of respondents reported attending a diabetes education course at the time of their diagnosis (SQ1). Participants indicated varying preferences for their comfortable glucose range, with none adhering to the recommended guideline of 3.9–10.0 mmol/L (SQ2).
The majority (70.0%, n = 14/20) experienced hypoglycaemia episodes 1–2 times per week (SQ3), while half (50.0%, n = 10/20) expressed ‘slight’ concern about this issue (SQ4). Additionally, 30.0% (n = 6/20) reported being ‘not at all’ concerned about experiencing hyperglycaemia episodes (SQ5).
Nearly half (45.0%, n = 9/20) felt they understood their bodies moderately less than their clinician (SQ6). A significant majority (85.0%, n = 17/20) stated they ‘strongly follow clinical guidance’ (SQ7), with over half (55.0%, n = 11/20) finding it ‘not difficult at all’ to adhere to these guidelines (SQ8).
Regarding anxiety, most participants (45.0%, n = 9/20) reported ‘slight levels of anxiety’ related to diabetes management (SQ9). Lastly, the majority (75.0%, n = 15/20) expressed being ‘very confident’ in their self-management practices (SQ10).
Result analysis
The total rate of each level of accuracy was analysed and shown in Figure 10. The results suggested that the SMBG group had the highest rate of ‘All correct’ responses at 52.1%. However, this group also had the highest rate of ‘All incorrect’ responses at 18.1%. In addition, the CGM and Flash groups had an equal rate of ‘All correct’ responses, each at 30.1%, while the CGM group had twice as many incorrect responses as the Flash group (10.6% and 5.1%, respectively).

Number of responses categorised by level of accuracy for all three groups: CGM, flash and SMBG. The data are presented in percentages.
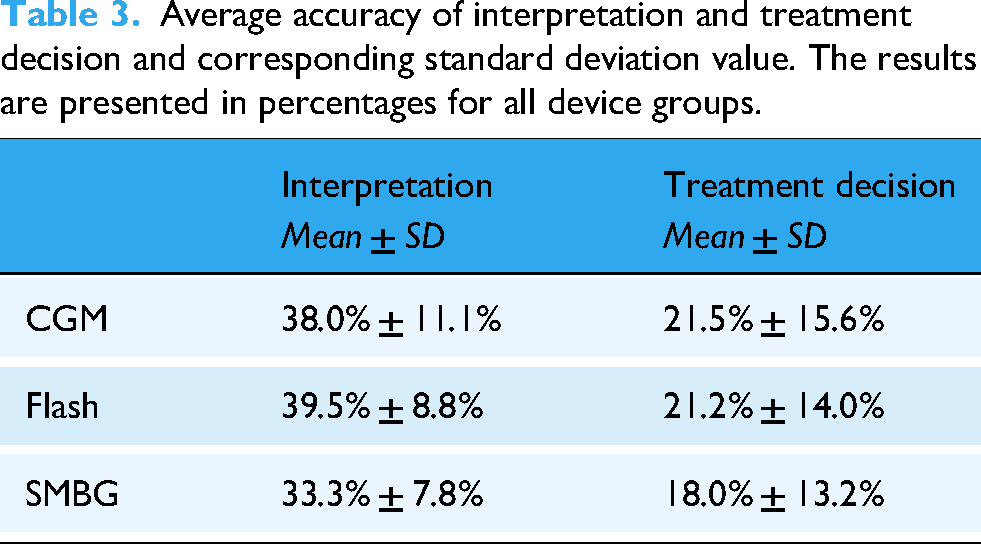
The accuracy of overall interpretation and treatment decisions is presented in Table 3. The results indicated that the average accuracy in interpretation was similar across all device groups. Moreover, the average accuracy in treatment decisions was consistently low and indicated a high variance.
Average accuracy of interpretation and treatment decision and corresponding standard deviation value. The results are presented in percentages for all device groups.
We sought to determine whether higher interpretation accuracy resulted in better treatment decisions. For example, as shown in Figure 11, Task 10 in the CGM group had the highest correct interpretation rate, yet its corresponding treatment decision accuracy was not higher than Tasks 2, 5, 6, 8 and 9. Similarly, in the Flash group, Task 3 had the highest interpretation accuracy, yet it gained the lowest accuracy rate in treatment decisions. In the SMBG group, Task 7 had a 44.4% correct interpretation rate but a 4.9% correct rate in treatment decisions.

Total interpretation and treatment decision accuracies of (a) CGM group, (b) Flash group, and (c) SMBG group.
To further analyse this, Pearson's correlation coefficient (r) was used to determine the correlation between interpretation accuracy and treatment decisions. The results are shown in Table 4.
Correlation score between interpretation and treatment decision. Statistical significance was set at α=.05.

The results suggested that there was no significant relationship between these two aspects among all three groups. Therefore, high interpretation accuracy did not translate to better choices in deciding the treatment actions.
According to participants’ responses, mentioning contacting healthcare providers, it was found that the majority of the responses were made by carers. Across all groups, nine carers and five patients chose to call their healthcare providers in several tasks, resulting in 51.9% (n = 14/27) of the total number of participants.
When analysing the qualitative interview with the survey results, notable discrepancies were found. A total of 75.0% of respondents expressed a very high confidence in their diabetes self-management, and 85.0% reported that they strongly followed the clinical guidance. In contrast, our interview response analysis indicated that treatment decision-making was the part that gained a consistently low accuracy rate among all participants, as discussed earlier. These findings suggest that many individuals may unknowingly perform inappropriate treatment interventions over a prolonged period.
Discussion
In this study, we explored glucose monitoring UIs interpretation and corresponding decision-making in people with T1DM based on their familiar devices. Our findings indicate that these tasks remain challenging for people with T1DM, particularly in making appropriate treatment decisions to keep their glucose levels within the target range. Moreover, we found discrepancies in patients’ perceptions of their own self-management practices and their actual performance observed in this study.
This work reveals that people with T1DM face challenges when interpreting and deciding on treatment actions from glucose monitoring devices, regardless of using the device they are familiar with. It was observed that the highest rate of incorrect responses was in making treatment decisions, particularly within the carers. Surprisingly, many concerning responses were found in the carer cohort, with several participants mentioning the need to call a healthcare provider or ambulance for situations that could be addressed by following clinical guidance. This is not only troubling but also leads to an inefficient utilisation of medical resources and and places further strain on the already overburdened NHS service.36,37 The possible explanation for this might be the fact that almost half of the participants reported not having received diabetes education courses, which leaves them uncertain about self-managing their condition and reliant on healthcare providers for guidance. In addition, some studies have identified that the lack of confidence in self-management is one of the barriers to implementing appropriate treatment actions in people with T1DM.38,39 As a result, individuals might be uncertain about acting independently and may subsequently need to call their healthcare providers for advice.
Furthermore, less than half of the total responses regarding treatment decisions did not fully align with standard clinical guidance or failed to follow relevant recommendations, potentially leading to medical emergencies. For example, in Task 3 in CGM and Flash groups, when the glucose reading was HIGH, one of the crucial recommended clinical guidance was to check ketone levels. However, none of the participants mentioned checking ketone levels, which could increase the risk of developing Diabetic Ketoacidosis (DKA) and potentially result in fatalities.2,40 Further research should explore strategies for encouraging people with T1DM to adhere to clinical guidelines in order to enhance their ability to respond appropriately in critical situations.
In addition, we found that there are some components in the UIs that participants did not mention during the interview session. In Task 6, the alert message on the CGM and Flash UIs was mostly disregarded, followed by the trend arrow. One participant mentioned the alert message in CGM but none in Flash, probably because the one in Flash looks like regular text and does not stand out as a banner at the top of CGM. This finding could suggest that participants either did not mention them or intentionally disregarded these elements. In the latter case, it is worth exploring why these elements were ignored and reassessing their usefulness for people with T1DM.7,41–43
Another finding was the contradiction between participants’ responses and the survey results. Most participants reported that they strongly followed clinical guidance, had very high confidence in their diabetes management, and stated that it was not difficult to follow the guidance at all. However, their interview responses did not align with clinical guidance. Interestingly, our results appear to contradict a study conducted by Alvarado-Martel et al., 28 in which patients reported encountering difficulties in following treatment recommendations and experiencing high levels of anxiety in diabetes management.
One unanticipated finding was that high accuracy in UIs’ interpretation did not correspondingly lead to high accuracy in treatment decisions. Our results suggest that the tasks with a relatively high rate of correct interpretation do not correspondingly receive highly correct treatment actions, except in the tasks that represent in-range glucose levels. Moreover, the level of accuracy of the tasks that we provided with contextual situations did not improve their performance. Therefore, decision-making in glucose management seems to be the major issue among people with T1DM regardless of their level of comprehension of their glucose monitoring device.
We observed that almost half of the participants did not receive fundamental diabetes education courses. This could explain the deviation from standard clinical decision-making guidance, specifically treatment actions. It is reported in a prior study that lack of knowledge and health literacy is one of the biggest obstacles to diabetes management. 27 Alternatively, it could be possible that they had been practising incorrect self-management because they had a wrong perception of their diabetes management. A more recent study 44 observed the Dunning–Kruger effect, a cognitive bias when individuals overestimate their abilities and fail to recognise their lack of knowledge, 45 on people's health literacy and their perceived ability to manage their health condition. They found that participants who had low health literacy showed greater confidence in their health-related knowledge than participants who had higher health literacy, and this also translated into poorer health behaviours. 44 They suggested that this phenomenon could be due to the Better than Average effect, where people tend to evaluate themselves as superior to their average peers. 46 An in-depth analysis of this effect revealed that people who overestimated their actual performance tended to have a lack of metacognitive skills and the ability to accurately judge their own performance, making them miscalibrate their ability. 47
Another theory suggests that people subjectively interpret their risk information based on their values and cognitive biases. Their personal beliefs about their perceived risk act as a reference point through which they view a professional's risk assessment. 48 Therefore, reliance on their own beliefs could be a reason for the deviation from clinical guidelines.
This study has some limitations. First, the small number of participants and the use of convenience sampling due to the low prevalence of this population. This may limit the generalisability of the findings to the broader population. Whilst the demographic presented here is varied, we believe future studies should be run on a larger scale to reflect the T1DM population as a whole. Second, the carer group is connected to the same community and probably received similar training, which could lead to similar responses and sampling bias. Lastly, our calculation of accuracy levels was based on the proportion of mentioned responses, which could result in a high accuracy level albeit one person mentioned a particular component. Future work should consider addressing the issue in treatment decision-making in people with T1DM. There is a need for an intervention to help them manage their condition more appropriately to avoid having medical complications.
Conclusion
This study investigated the challenges faced by people with T1DM in interpreting and making treatment decisions based on their glucose monitoring devices. The notable finding of this study is that there was a high variability in interpretation and treatment action accuracies among CGM, Flash and SMBG groups. Despite this, there was a consistently low accuracy in deciding treatment action to manage their blood glucose level. However, participants reported a very high confidence in their diabetes self-management and strongly believed they adhered to clinical guidelines. These findings highlight the discrepancy between participants’ perception and their actual performance. Therefore, the current glucose monitoring UIs need significant improvement in data presentation to reduce the burden required for interpretation. Future research could explore various approaches for presenting data in a manner that people with T1DM can easily comprehend and enable them to translate the interpretation into more accurate treatment decisions.
Footnotes
Acknowledgements
The authors would like to thank all participants for their time and contribution to this study. This study was funded by the Department of Computer Science at the University of Manchester, United Kingdom. The first author is funded by the Royal Thai Government's scholarships.
Ethical considerations
This study is classed as ethically exempt by the Research Governance, Ethics and Integrity Department and the University Research Ethics Committees at the University of Manchester (Reference number: 2023-17960-30585).
Informed consent
All participants provided verbal consent prior to the interview. To address limitations associated with in-person consent due to remote participation, verbal consent was obtained via Zoom platform (version 5.16.0). Participants reviewed the consent form displayed on the screen, and their verbal agreement was documented. The researcher ticked the consent box on their behalf after receiving explicit permission.
Author contributions/CRediT
All authors contributed to the study design, data interpretation and result analysis. RK also contributed to participant recruitment, qualitative interviews, data collection and manuscript writing. HT provided the standard clinical guidance. HT, BP, and SH reviewed and edited the manuscript and approved the final version.
Funding
The author(s) received no financial support for the research, authorship, and/or publication of this article.
Conflicting interests
The author(s) declared no potential conflicts of interest with respect to the research, authorship, and/or publication of this article.