
Abstract
Background
Smart elderly care faces numerous challenges while aligning with the national strategy of promoting the silver economy. Chief among these challenges is the inconsistent quality of services offered by smart elderly care institutions, which significantly impedes the industry's further development. Therefore, the objective of this paper is to develop a theoretical framework for assessing the quality of smart elderly care services, refine the evaluation index system for these services, and explore strategies to enhance their quality.
Methods
Based on the Structure–Process–Outcome model, this paper has developed an integrated theoretical framework and employed a combination of modified-Delphi method and Decision-Making Trial and Evaluation Laboratory – Analytic Network Process to establish and assign weights to the service quality evaluation system for smart elderly care institutions in China.
Results
This study develops a “Technology + Service” synergistic theoretical framework and an index system comprising four first-tier indicators, 12 second-tier indicators, and 54 third-tier indicators. The most significant indicators identified are service resources, smart elderly care infrastructure, staffing, service empathy, the rate of health file creation, 3S device coverage rate, and average living space per bed.
Conclusion
The results reveal that service resources, especially the information technology infrastructure and smart equipment are the most crucial aspects of smart elderly care institutions. Additionally, institutions should focus on improving the expertise of their staff and providing psychological care for elderly adults.
Keywords
Introduction
The escalating global population of individuals aged 65 and older has triggered heightened awareness worldwide, particularly in developed nations.1 A case in point is the profound demographic shift observed in China, where the natural population growth rate has plummeted to historic lows at −1.48‰ in 2023, leading to a substantial surge in the elderly population. 2 Furthermore, the trajectory of increasing elderly demographics persists, positioning China as the host to the largest aging population globally. The number of individuals aged 60 and above is expected to reach 478 million in 2025, constituting 35.8% of the total population. 3
In response to the escalating demands for social care and the evolution of information technologies, the senior care industry has progressively instituted an innovative form of elderly care service system known as “smart elderly care.” It was first proposed by Unit Trust UK as an “Intelligent older system” that can break the boundaries of time and space to provide high-quality senior care service. 4 The core concept of smart elderly care is building a technological network for service participants and leveraging smart technology to address the diverse, personalized, and convenient requirements of the elderly. 5 The smart elderly care industry in China has experienced remarkable growth recently and is anticipated to continue expanding within the aging care sector. Post-2020, smart elderly care is poised to permeate the traditional aging industry, with the industry scale projected to reach 220 trillion RMB by 2050. 6
Scholars have taken notice of this emerging phenomenon and extensively delved into various aspects of smart elderly care. Prior studies have scrutinized the current status of smart elderly care in China, which has exhibited some notable characteristics: 1) Integration of technology with elderly care service resources.7,8 2) Technology spanning the entire lifecycle of elderly care service recipients.9,10 3) Technology fostering collaboration among multiple stakeholders in elderly care.11,12 4) technology facilitating the organic combination of personalized and human-centered elderly care service.5,13 Other scholarly focus on discussing service models for smart elderly care, and the primary service models can be categorized as: technology-oriented,5,14 medical-care integrated,15,16 and collaborative integrated.17–19 Research on evaluating the quality of smart elderly care service primarily focuses on: 1) Selection of evaluation indicators. The key indicators include the effectiveness of intelligent facilities,20,21 the process involved in smart services, 22 and the adoption of intelligent services. 23 2) Methods for determining indicators. The major methodologies contain the Fuzzy Analytic Hierarchy Process,24,25 the Decision-Making Trial and Evaluation Laboratory (DEMATEL) method, 26 the Modified Delphi Method,27and the DEA method. 28
In summary, existing research has provided valuable academic insights into the mechanisms, evaluation, and optimization pathways of smart elderly care services. However, further advancements are needed in the following areas: (1) Current studies lack comprehensive analyses of different elderly care service models, particularly from the perspectives of integrating technology with services and coordinating the development of the entire industry chain. This limitation hinders the advancement of a personalized, integrated, and intelligent elderly care service system. 3 (2) Research on the evaluation frameworks for service quality of smart elderly care institutions remains insufficient, making it challenging to incorporate such services into a unified measurement system and achieve comparable evaluations. 29 (3) Existing studies often adopt simplified inductive and deductive approaches to explore service quality pathways at macro and strategic levels, without addressing the complex interrelationships among influencing factors. Therefore, a comprehensive and systematic investigation into innovative service quality frameworks for smart elderly care institutions, the development of evaluation systems, and the identification of factors driving quality improvement is urgently needed. These efforts are critical to achieving high-quality development in smart elderly care and addressing the societal challenges posed by population aging.
Therefore, it is imperative to institute a coherent performance evaluation system aimed at pinpointing deficiencies in service quality and elevating the standard of elderly services. The specific research objectives are outlined below:
Develop a “Technology + Service” synergistic theoretical framework to depict and measure the service quality of smart elderly care institutions. Construct a scientific, objective, and feasible service quality evaluation system tailored for smart elderly care institutions. Identify the most crucial indicators via the weight allocation to guide the smart elderly care institutions to enhance service quality.
This paper encompasses both theoretical and applied implications. From an academic perspective, it first introduces the “Technology + Service” synergistic theoretical framework for measuring service quality in intelligent environments. This innovative framework enriches the theoretical foundations and knowledge base for evaluating the serviceability of smart elderly care. Secondly, it examines a new model for smart elderly care services that integrates societal resources, addresses the entire life cycle of the elderly, and consolidates the supply chain of senior care services.
Furthermore, the paper holds practical implications by introducing a strategy to elevate service quality and enhance the development of the smart elderly care industry in China. First, it proposes the development of an evaluation system to assess the effectiveness of service models employed by smart elderly care institutions. This system incorporates dimensions such as equipment intelligence, data sharing, service integration, and service adoption to construct a comprehensive network-based index system. The framework aims to guide governmental departments in enhancing regulatory efficiency and promoting a well-structured blueprint for senior care service systems. Second, the study explores the factors influencing the improvement of service quality in smart senior care. By identifying dynamic and feasible pathways for service quality enhancement, it provides innovative strategies for organizations to strengthen their operational performance. These insights aim to drive sustainable development and inject new momentum into the growth of the smart elderly care industry.
The research is structured as follows: The second part comprises “Literature review,” which provides a theoretical foundation for the proposed frameworks and indicator system. “Research design” section offers a concise description of the methodology. “Results” section presents the analysis procedure and the obtained results, followed by “Discussion” section. Finally, “Conclusion” section addresses limitations and outlines future directions for the construction of indicators.
Literature review
The Structure–Process–Outcome model
The Structure–Process–Outcome (SPO) model, deemed by Donabedian 30 as an effective and efficient management tool for nursing and healthcare quality control, asserts that the structure, process, and outcome of a care service program are interrelated and sequential. Donabedian 31 contends that a well-designed structure increases the likelihood of a smooth process, ultimately influencing positive outcomes. By establishing this relationship, it becomes possible to assess the quality of specific aspects of the structure, process, and outcome of care services at each stage. 32 The SPO model stands as a widely adopted conceptual framework for evaluating service quality in the fields of medicine and healthcare. For example, Moore et al. 33 employed the SPO model to assess the integrated trauma system, aiming to enhance patient outcomes. Liu et al. 34 developed a nursing quality index system based on the SPO model for assisted reproduction hospitals. Consequently, the SPO model holds applicability in senior care research, with several academic papers incorporating it into their investigations. For example, Zhang et al. 35 proposed a service quality evaluation system for elderly care institutions based on the SPO model, applying it to six nursing homes in Xiamen, China. Bhattacharyya et al. 36 explored the satisfaction of nursing home services among older individuals, devising a conceptual framework grounded in the SPO model.
The “Technology + Service” frameworks
The synergistic model of “Technology + Service” originates from the Synergy effect which refers to the study of open systems in physics, especially lasers. 37 Ansoff 38 was the first to introduce “Ansoff Synergy Concept” into the study of business management, believing that synergies may exist in a firm's operations, investments, or management activities. The concept emphasizes the synergy between departments and functions within an organization to achieve more efficient performance and innovation. Therefore, Tu et al. 39 summarizes four major models of technology and service development in China: main categories development model, mechanism class development model, system class development model, and value chain development model. And they provide an innovated comprehensive framework that describes the development logic of technology and service synergy as “The fundamental of technology and service value creation—the process of value creation—the outcome of technology and service value” (Figure 1). Smart elderly care institution can be recognized as integrated, service-centered, technology-enabled care. 40 Consequently, the framework of technology and service synergistic development can be applied in the research of smart elderly care service.
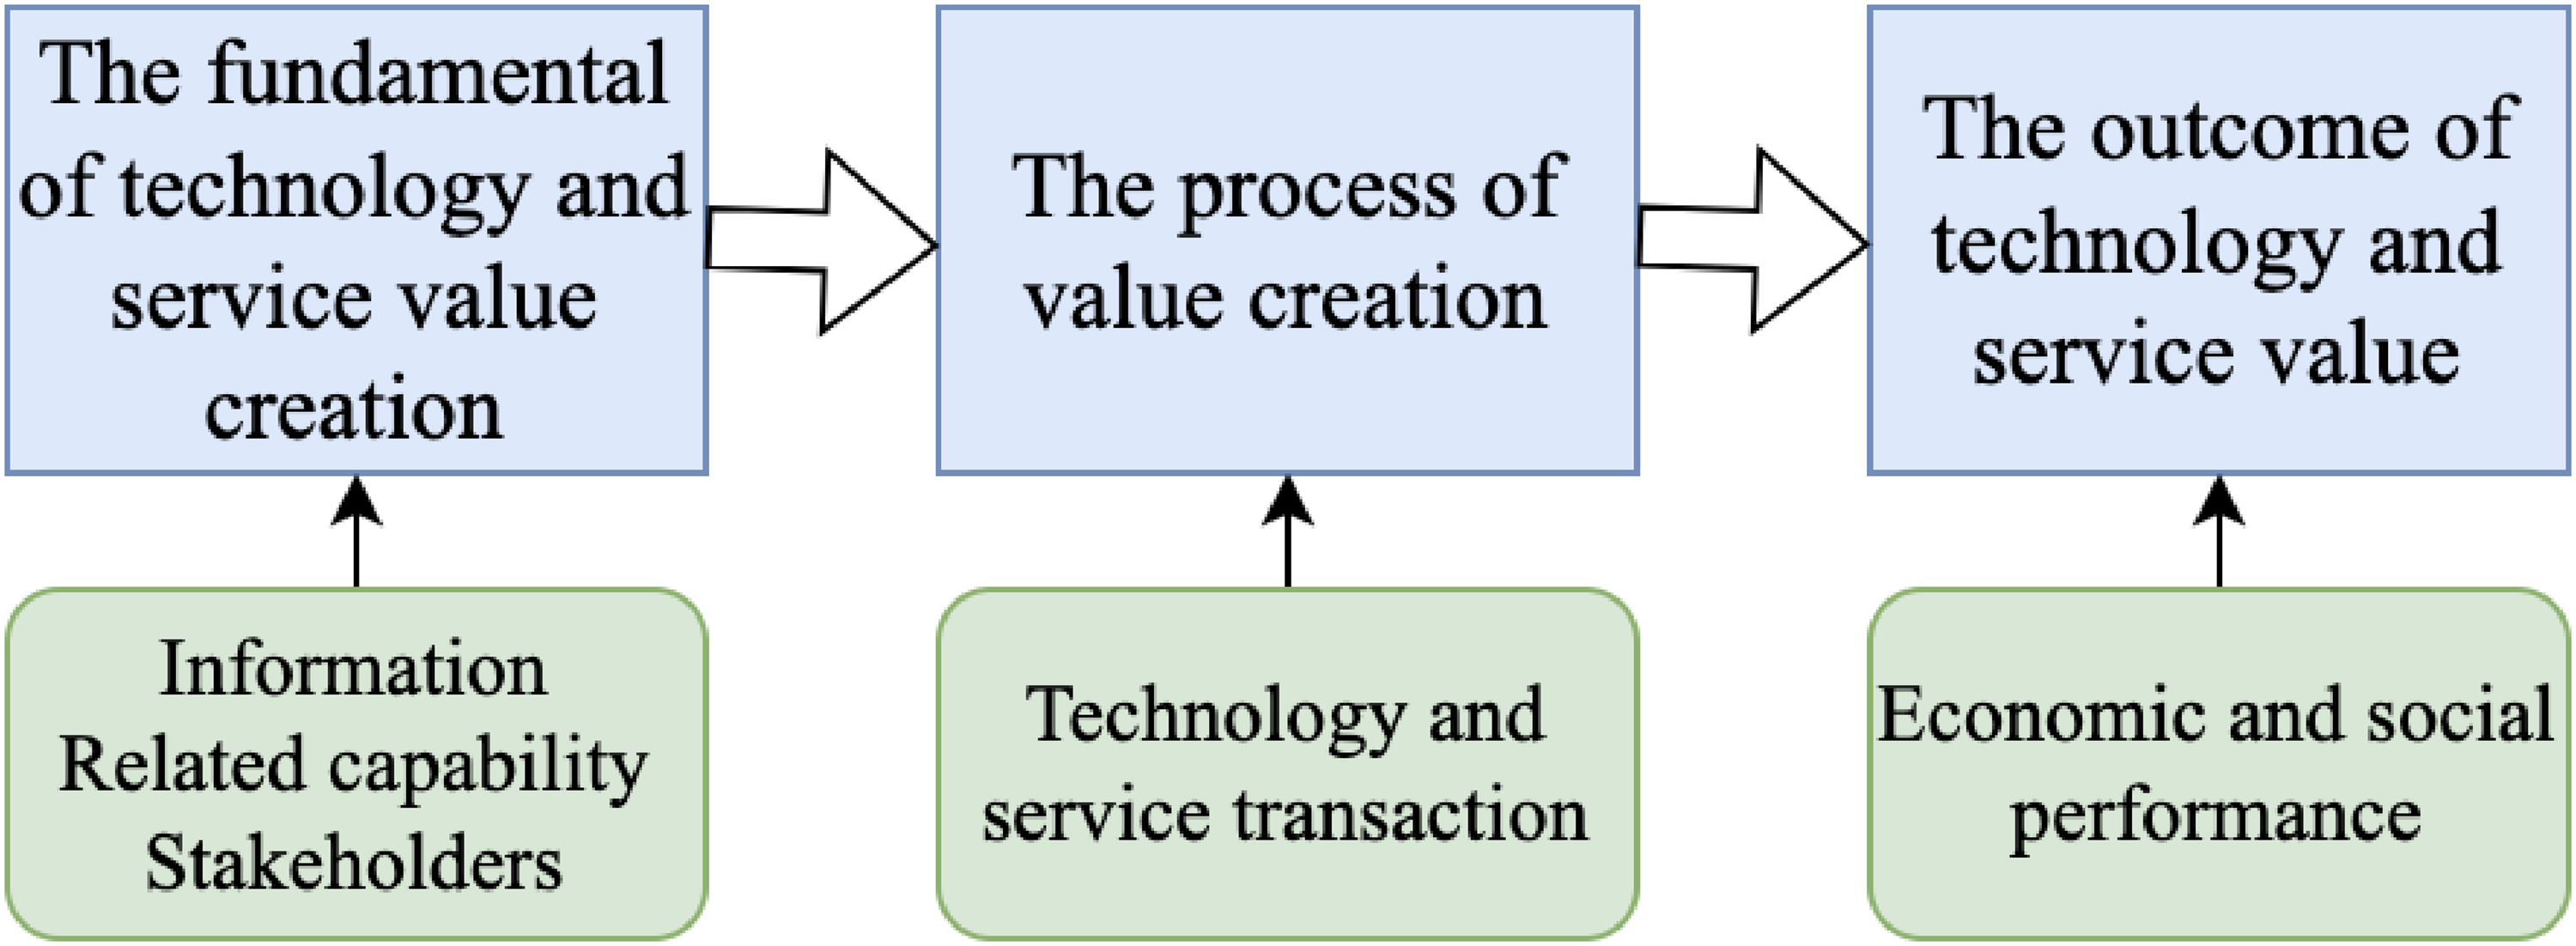
The framework of technology and service synergistic development.
Research design
On the basis of “SPO” service quality model, this study innovated the theoretical framework by integrating factors from interdisciplinary studies. It also applied Modified Delphi and DEMATEL – Analytic Network Process (DEMATEL-ANP) methods to construct the evaluation index system and obtain the weights. The research process is illustrated in Figure 2.

The research process.
Develop the “Technology + Service” theoretical framework
To ensure the complexity and multidimensionality of smart elderly care service quality, this study proposes using the SPO three-dimensional quality theory framework as the theoretical foundation. 41 This framework will be integrated with the Cooperative development Model of Science and Technology Service 42 and social technology theory 11 to initially design the theoretical framework of smart elderly care institutions. This approach aims to support the construction of an innovative smart elderly care service model that is intelligent, integrated, and personalized.
Based on these theories, a new model of smart elderly care is constructed, characterized by an “intelligent information technology structure, collaborative services from multiple perspectives, and high-quality service outcomes” (Figure 3). This model relies on an interactive platform for smart elderly care, integrating the service supply chain comprising suppliers, integrators, and service providers. 10 It considers multiple stakeholders involved in smart elderly care and utilizes societal resources to achieve high-quality service outcomes through the integration of smart devices, platform technology, personalized care scenarios, and a comprehensive service system. 43 This model aims to drive comprehensive innovation and upgrade the service model of smart elderly care organizations.

The “Technology + Service” synergistic theoretical framework.
Define the dimensions of the evaluation system
The selection of the first-tier indicators. The research selects the indicators and constructs the assessment system based on the SPO Model (Donabedian, 1969), the “Assessment indicators system of smart elderly care,”27,44 the “Service quality assessment index system of nursing home,” 35 the “Service quality evaluation system of medical and nursing care institutions.” 45 Thus, it is possible to establish the model of the first-tier indicators as followings: “Infrastructure” indicates the “hard resource” of the smart elderly care institution, such as the network, the fiber, the indoor and outdoor architecture. “Service resource” means the “soft resource” such as the talents, the medical support, and the intelligent equipment. These two dimensions are related to “structure,” which refers to the static matching efficiency and relationship of various resources in health care services. “Service content” refers to nursing content and health care management and can reflect the proceeding of “process.” “Service outcome” refers to the customer perception and matches the “outcome” dimension that focuses on the final output at the end of the health care service.
The selection of second-tier indicators. The structure of the second-tier indicators, smart elderly care infrastructure, and living services infrastructure, which emphasize the foundation of smart elderly care service, can be attributed to infrastructure. 27 Smart equipment, medical care package, and human resources are the sources and talents that belong to service resource. Service reliability, platform intelligence, privacy protection, service responsiveness, and service empathy, which reflect the effectiveness and efficiency of the service project, can be classified as service content. Intention to use and customer satisfaction, which are the service outcomes, are part of service performance. 46
The selection of third-tier indicators. This study draws on a range of research studies, including those examining medical and nursing care service systems,20,22,45 the impact factors of smart nursing service,26,47,48 the evaluation of service quality in smart community or smart home settings,28,49,50 and research on the construction of quality evaluation systems in senior care institutions.27,35,44,51 The factors are then refined and integrated to form the foundation of the third-tier indicators.
Constructing and adjusting the index system
The current study endeavors to formulate a structured service quality evaluation system for smart elderly care institutions through the implementation of the Modified Delphi method. 52 It is similar to the traditional Delphi method, retaining its core principles. However, the key difference lies in the omission of the first round's open-ended questionnaire, which is typically a hallmark of the traditional approach. Instead, the modified version replaces this initial open-ended survey with a structured questionnaire based on relevant findings from past literature, researcher's design planning, or expert interviews. This structured questionnaire serves as the first round of the process. 53
To achieve this goal, the research design employs a third-round Delphi expert process, which builds on a preliminary evaluation system derived from the relevant literature. The study systematically analyzes data collected from Delphi questionnaires, incorporates insights from expert participants, and identifies primary, secondary, and tertiary indicators to establish the foundational version of the evaluation system. Evaluation indices were selected using the cutoff method, 54 and the total score frequency, arithmetic mean, and coefficient of variation were calculated based on the importance scores of each index. The selection procedure followed these criteria: 1) The higher the positive coefficient of experts, the more engaged the experts are, reflecting greater attention to the study; 2) Expert authority was required to exceed 0.70, considered a threshold for high authority; 3) The Kendall's coefficient of concordance (w) ranges from 0 to 1, 55 and the coordination coefficient ranges from 0.5 to 2. 56 The maximum frequency and arithmetic mean were determined by the formula “Cutoff value = Mean—Standard Deviation,” with indicators above this threshold selected. Conversely, the cutoff value for the coefficient of variation was calculated as “Cutoff value = Mean + Standard Deviation,” with indicators selected based on scores below this threshold. Indicators were excluded only if they failed to meet all three criteria; otherwise, retention was assessed based on the principles of comprehensiveness, scientific rigor, and practicality. 54
The Delphi experts who are mainly from nursing care institutions, administrative organizations, and universities are specialized in senior care service or dedicated in relevant fields with more than 10 years’ working experience. A total of 15 experts 57 were selected, with most of them coming from Hunan Province and the Great Bay Area. This decision was made due to the fact that the Great Bay Area is considered the most advanced region in terms of elderly care in China. According to the latest data from the National Bureau of Statistics, 58 Guangdong Province, which is part of the Great Bay Area, has the highest income for the basic pension insurance fund at 611 billion yuan. On the other hand, Hunan Province, located in central China, represents the middle class with an average income of 185 billion yuan for the basic pension insurance fund. 58 The detailed criteria are stated in Table 1.
The criteria of selecting the Delphi experts.

Weight assessment of the evaluation system
After establishing the service quality evaluation system using the Delphi method, the DEMATEL-ANP approach 59 is employed to identify the relationships between the indicators and calculate their respective weights, with the aim of optimizing and finalizing the evaluation system. As a complex system, the construction of the assessment indicator system for smart elderly service quality cannot completely eliminate the correlations between indicators. In fact, these correlations tend to intensify due to the inherent complexity of the system. The ANP model, proposed by Saaty, 60 allows decision-makers to account for the interactions between any two elements in a complex dynamic system. Therefore, using the DEMATEL-ANP model to assign weights to the indicators, in order to assess the quality of smart elderly care services, enables a more comprehensive consideration of these interdependencies, leading to research outcomes that better reflect the real-world context.
Initially, the project utilized the DEMATEL method to create a cause-and-effect diagram that identifies the relationships and correlations between the indicators. After the expert panel completed the questionnaire, the collected data were processed using the arithmetic mean in Excel to generate the direct influence matrix D 


Subsequently, the ANP method was employed to evaluate the system. Using the causality map, a network structure of indicators was developed, and the content of the ANP questionnaire was designed accordingly. Data provided by the experts who completed the questionnaire were organized, and the geometric mean of the relative importance values for each pair of indicators (constructs) was calculated in Excel using the formula (
The unweighted supermatrix was regularized for stability and balance, resulting in the weighted supermatrix. These matrices were integrated, considering their respective influences, to derive the composite weighted supermatrix W∗ which encapsulates the system's interdependencies and preferences. MATLAB was then used to compute the limit supermatrix through iterative self-multiplication of the weighted supermatrix. This process yielded the mixed weights of the evaluation indices, enabling the relative ranking of indicators with higher correlations and weights. This rigorous approach enhances the objectivity and precision of the evaluation results. 59
Results
The quality index of institutional smart elderly care service
The evaluation system's architecture grounded in the theoretical underpinnings of “Define the dimensions of the evaluation system” section, initially featured Layer A with four dimensions, Layer B with 15 indicators, and Layer C with 59 indicators. Subsequent to three iterative Modified-Delphi consultations, the system was refined to encompass four dimensions in Layer A, 12 indicators in Layer B, and 54 indicators in Layer C. The comparative structures of the evaluation system in its original and final forms are presented in Appendices A and B. Due to the page limitation, only the third-round results of Modified Delphi are reported.
The basic information of experts is illustrated in Table 2. Three rounds of expert consultations were conducted in this research, and the Gojump firm circulated the questionnaires over the WeChat platform to the same 15 experts who took part in the first and second rounds of the Delphi process. All 15 of the sent surveys were returned, giving the distribution method a response rate of 100%. All of the surveys gathered were found to be legitimate after a careful verification process. The following is a list of the Delphi third-round results:
The demographic characteristics of 15 experts.

Table 3 reveals that the Kendall coordination coefficient test yielded a significant result (p = 0.00 < 0.05), indicating strong interrater reliability. Layer A's Kendall W value was 0.456, surpassing the 0.2 threshold. Similarly, Layers B and C exhibited coefficients of 0.466 and 0.428, respectively, confirming high correlation and consistency among the 15 evaluators’ assessments.
The coordination coefficient of evaluation system.

It is clear from Table 4 and Table 5 that all the indicators are appropriate. Although the arithmetic means of “Service resource” (A2) is smaller than 4.34, the coefficient of variation is equal to 0.22, and the standard deviation of “service outcome” (A4) is 0.00 which is smaller than 0.15, all the indicators do not meet the deletion scope. In addition, all 12 indicators of Layer B are excluded from the deletion. They all belong to the range of “arithmetic mean >4.03 or standard deviation >0.14 or the coefficient of variation <0.30.” All 54 indicators of Layer C are excluded from the deletion. They all belong to the range of “arithmetic mean >4.08 or standard deviation>0.13 or the coefficient of variation <0.32.”
The standard cutoff value of different layers.

The statistic results of indicators.

According to Zeng, 56 when the coordination coefficient (Kendall's W) fluctuates from 0.400 to 0.500, the coordination is better. The experts’ opinions in the modified Delphi method gradually converge, and the consultation can be stopped. Finally, this study confirms the service quality evaluation system, which includes four basic indicators, 12 secondary indicators, and 54 tertiary indicators.
The weights of the evaluation system
Decision-Making Trial and Evaluation Laboratory is employed to structure the interdependencies between dimensions. Analytic Network Process is adopted to calculate the supermatrix and obtain the weights of the indicators.
The results of the first-tier indicators
Step 1: Construct a direct-relation matrix. Expert discussions and questionnaires were used to determine the relationship between elements on a two-by-two basis. The same 15 experts were invited to participate in each questionnaire. The questionnaire used the 0–9 scale to reflect the degree of influence between the indicators, with higher values indicating stronger impact relationships, and 0 representing no impact. The arithmetic mean method was used to integrate the experts’ preferences from their answers. The values obtained after integration are shown in Table 6.
The statistical summary of expert preferences.

Based on the above values, the initial direct-relation matrix D of the first-level indicators was obtained:

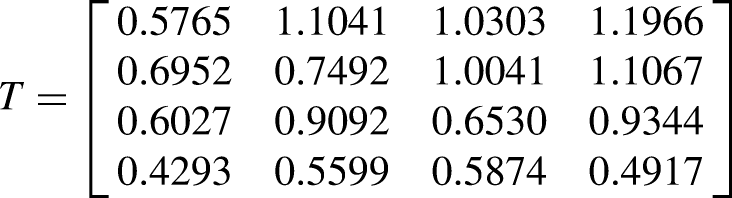

The centrality and causality of the first-tier indicators.

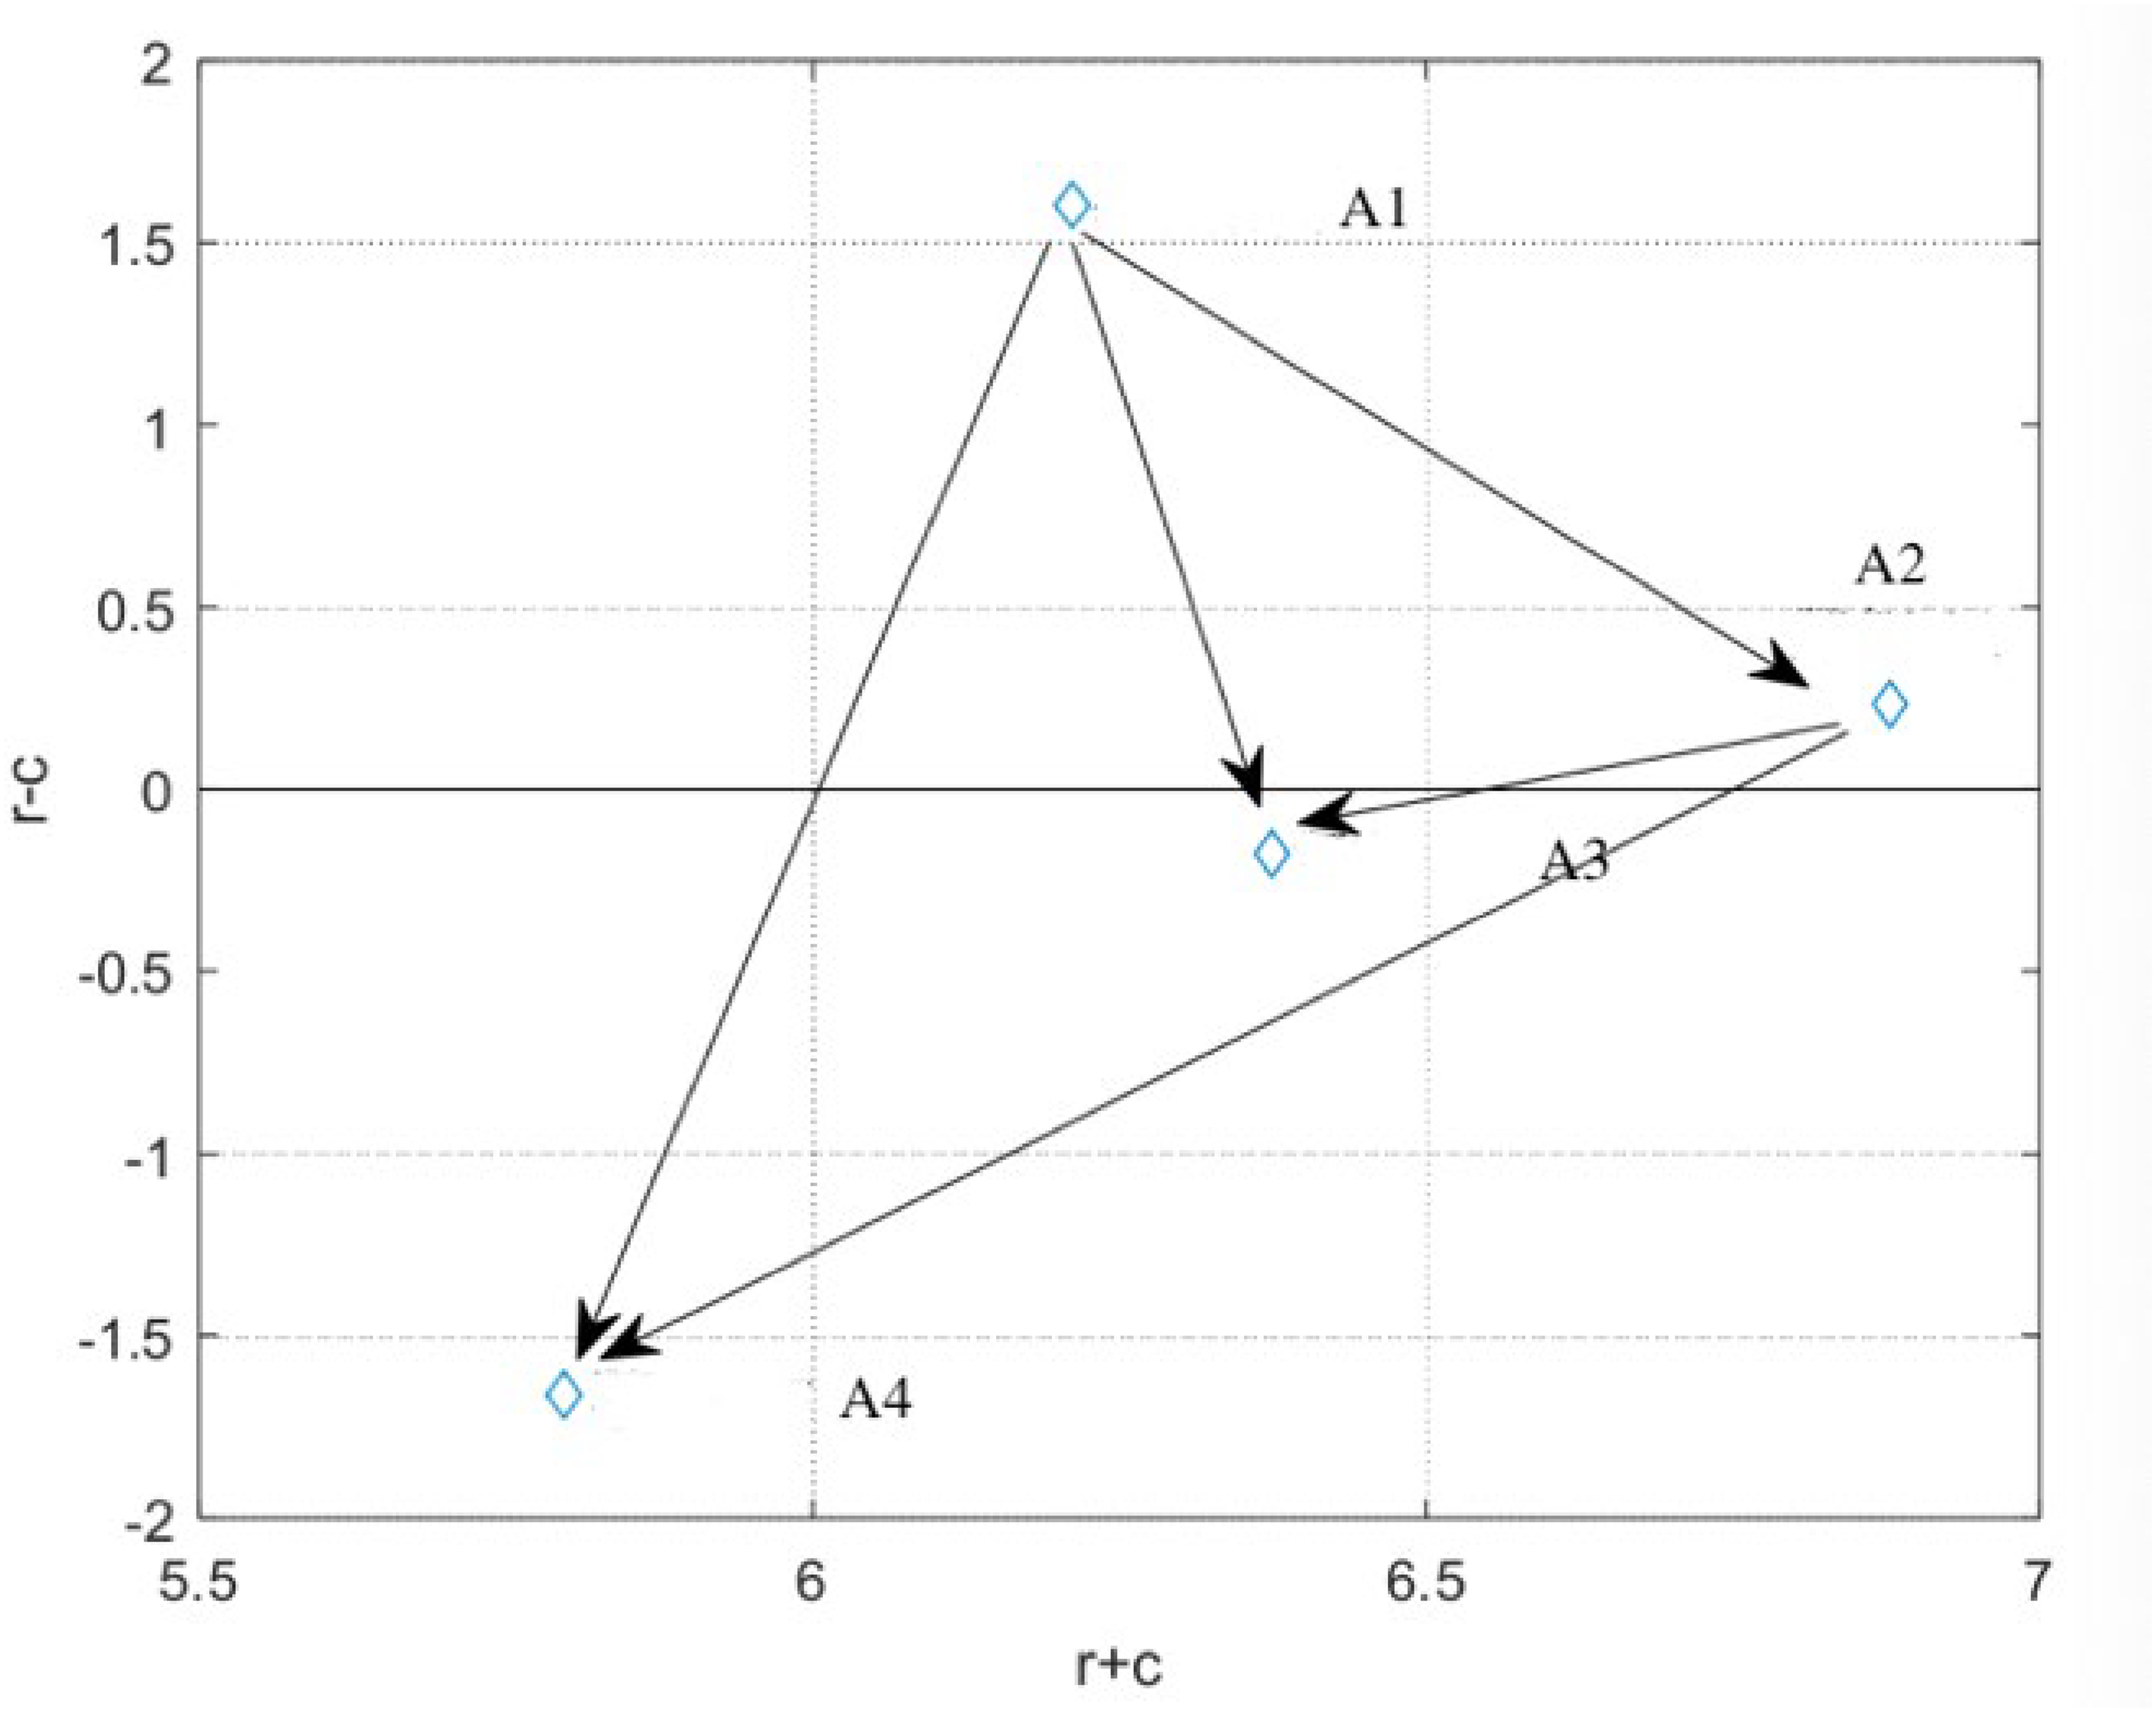
Figure 4 depicts the causal relationship diagram to analyze the relationship between centrality and causality, with the arrows denoting the influence relationship. The horizontal coordinate is the centrality r + c value, the vertical coordinate is the causality r-c value, and the two lines are the mean value of centrality, and the number 0, respectively. The arrows with a centrality value of 0 or less are omitted. 61 And the meanings of the four quadrants are described in Table 8. 62
The causal relationship map of first-tier indicators.
The instructions of four quadrants 62.

According to Figure 4, the ranking of the first-tier indicators based on the centrality value (r + c) is as follows: service resources > service content > infrastructure > service performance. The ranking based on the degree of causality (r-c) is infrastructure > service resources > service content > service performance. Thus, infrastructure (r-c = 1.6042) and service resources (r-c = 0.2328) cause of the other two. Infrastructure is a crucial determinant for evaluating the service quality of smart elderly care, given its impact on the other three indicators.
The results of the second-tier and third-tier indicators
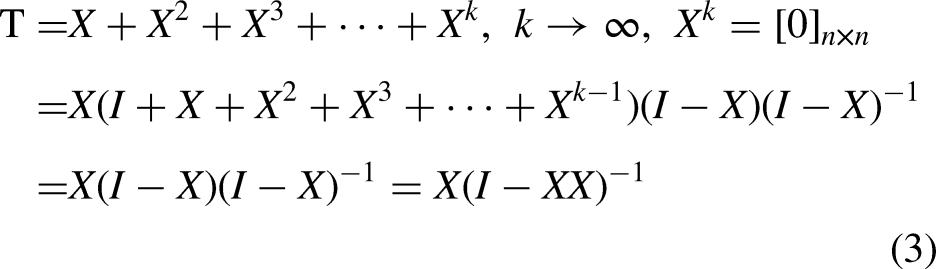
Also, the total-relation matrix T and

The causal relationship diagram of infrastructure.

The causal relationship diagram of service resource.

The causal relationship diagram of service content.

The causal relationship diagram of service outcome.

The causal relationship diagram of smart elderly care.
The causal relationship diagram of living services infrastructure.

The causal relationship diagram of smart equipment.

The causal relationship diagram of medical supporting package.

The causal relationship diagram of staffing.

The causal relationship diagram of service reliability.

The causal relationship diagram of platform intelligence.
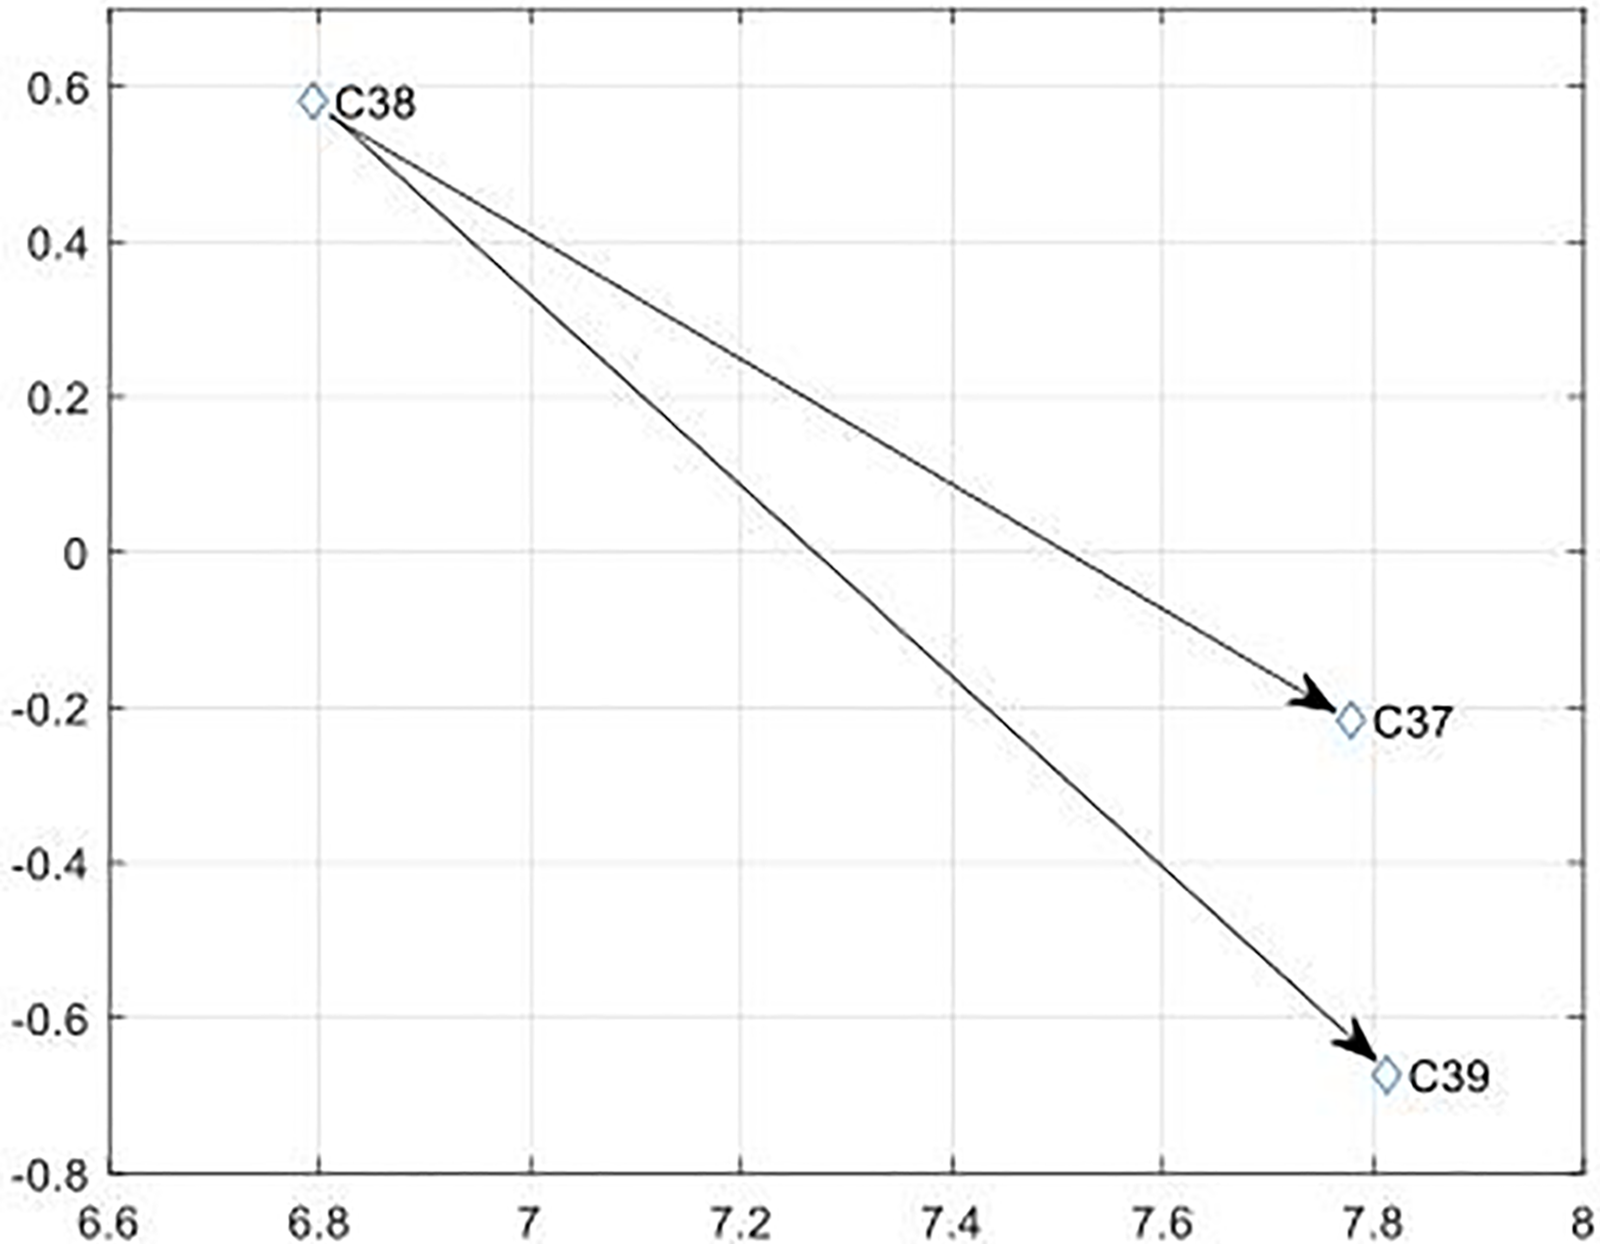
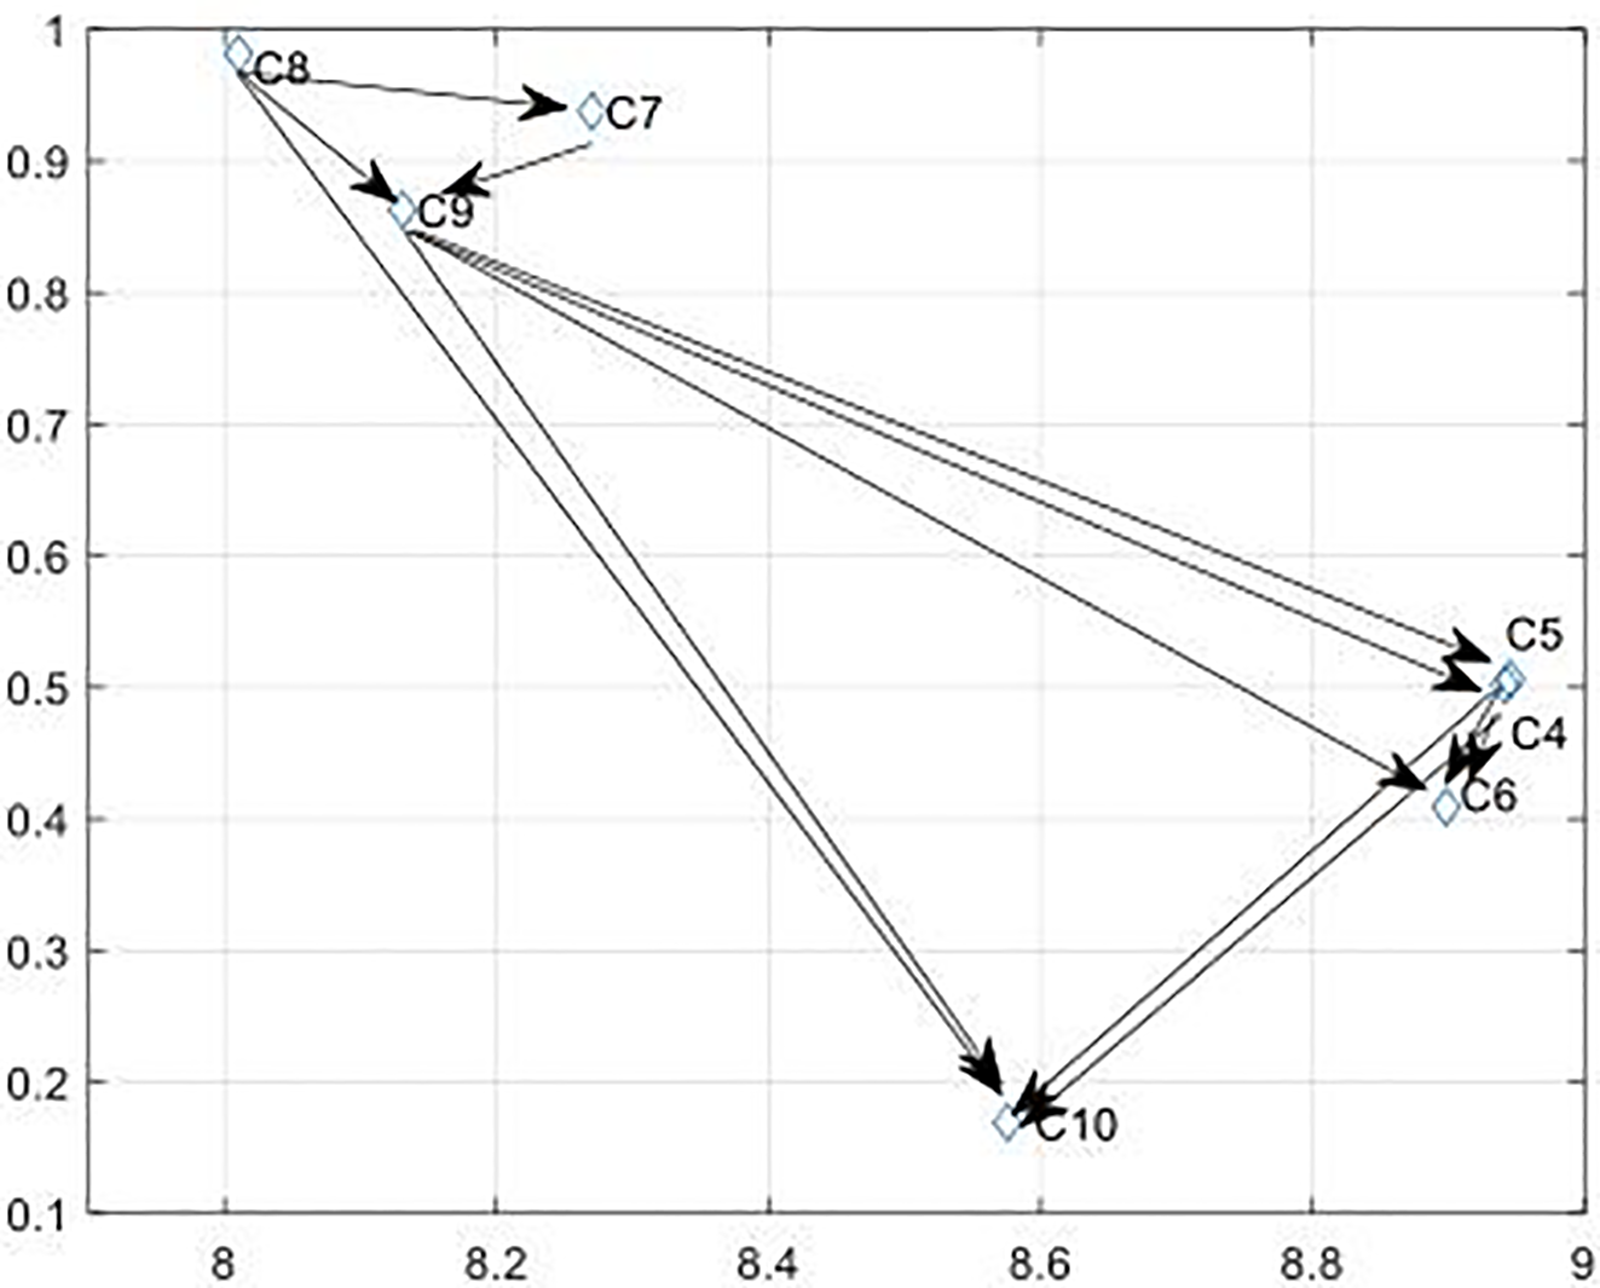
The causal relationship diagram of privacy protection.

The causal relationship diagram of service responsiveness.

The causal relationship diagram of service empathy.
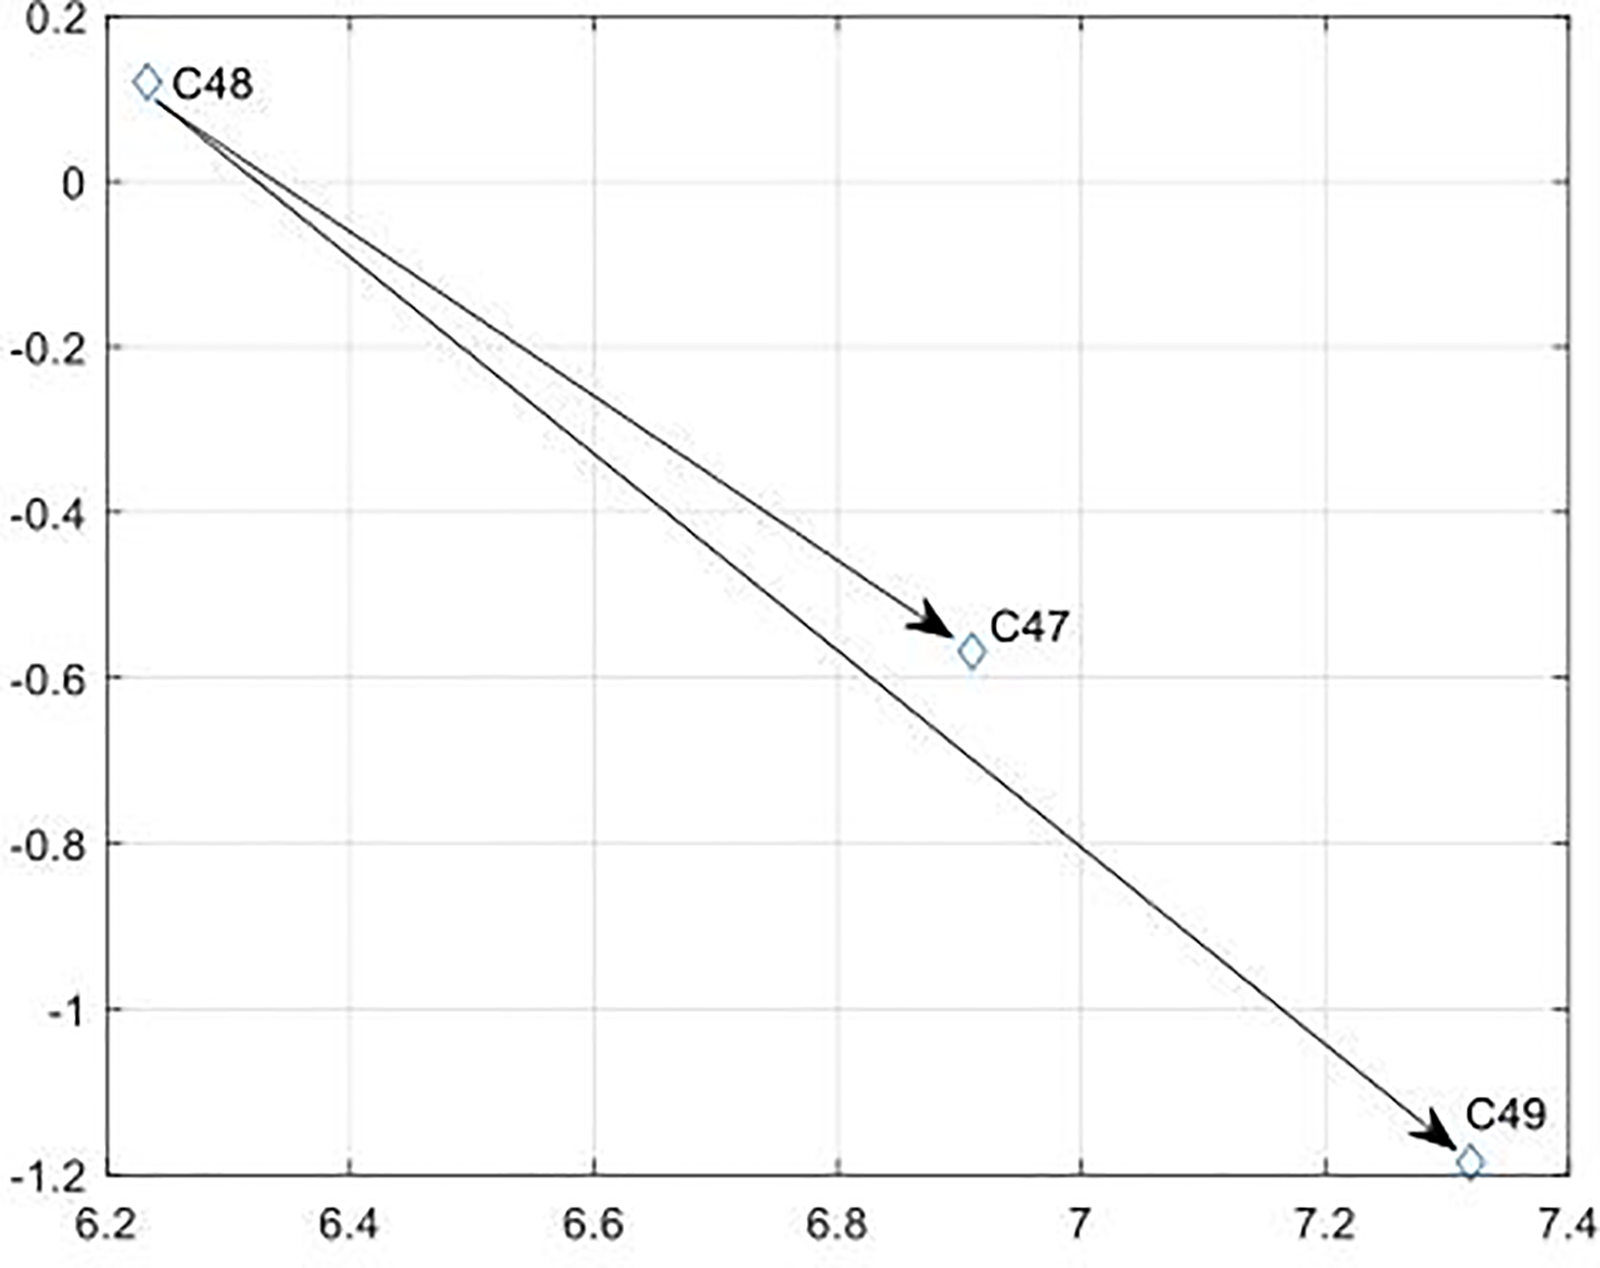
The causal relationship diagram of intention to use.

The causal relationship diagram of customer satisfaction.
The initial direct-relationship matrix of the second-tier indicators.

The total-relation matrix of the second-tier indicators.

The total-relation matrix removed the threshold value of the second-tier indicators (threshold value = 0.15).

The value of Centrality (r + c) and Cause Degree (r-c) of the second-tier indicators.

The initial direct-relation matrix of the third-tier indicators.

The total-relation matrix of the third-tier indicators.
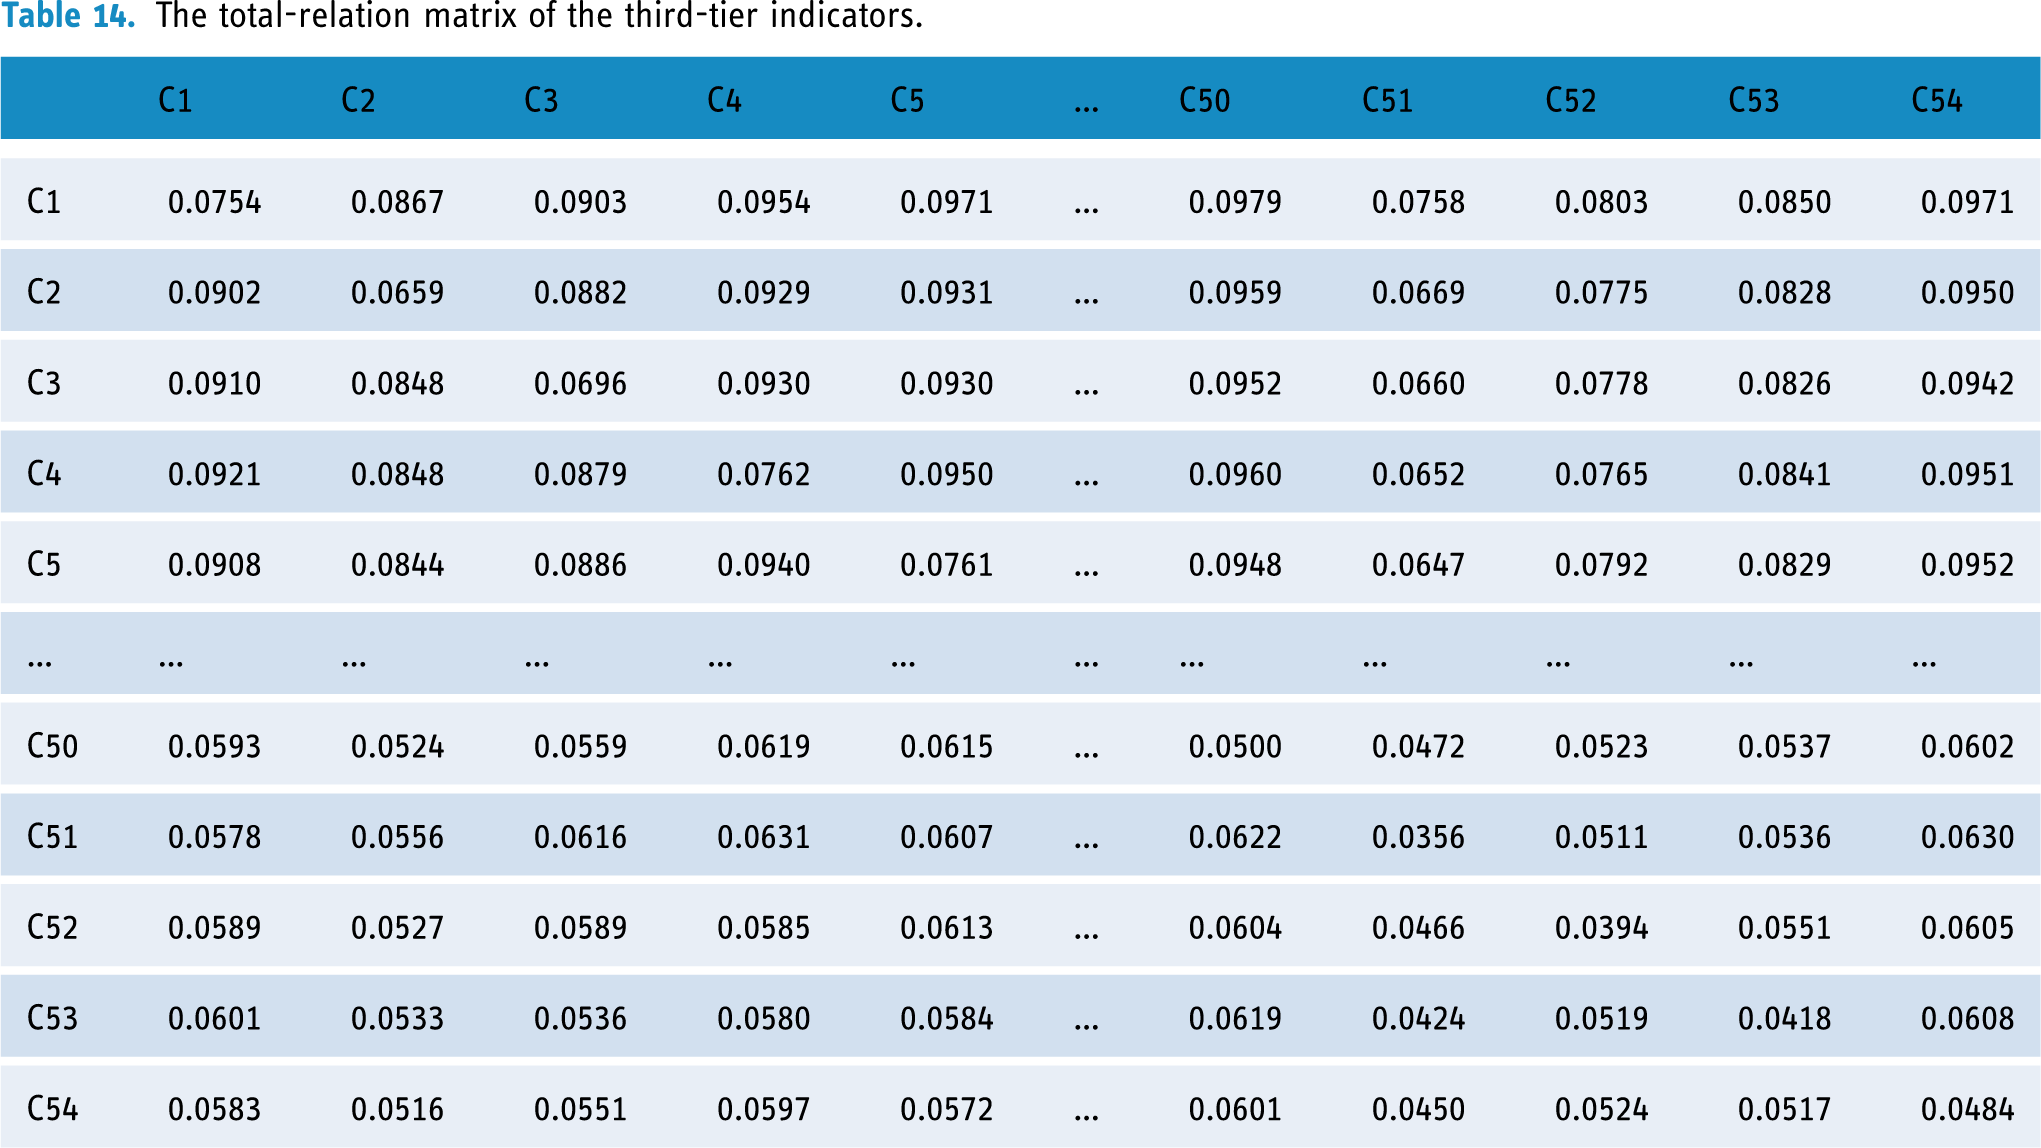
The total-relation matrix of the third-tier indicators with the threshold removed (threshold value = 0.15).

The results of second-tier indicators.

The results of third-tier indicators.

Due to the limited space of paper, the completed tables are presented in the Appendix. And the digital version has been uploaded to the following address: (https://figshare.com/articles/dataset/The_ANP_results_of_third-tier_indicators/22302307)
The Results of Weight Ranking
The integrated relationships generated by the DEMATEL method described above were programmed using MATLAB to create indicators, establish the influence relationships of elements under a certain criterion, select the elements to be compared, apply the ANP assessment scale (Saaty's 1–9 scales) to compare the elements two by two based on the initial direct relationship matrix of the secondary indicators, enter the importance of the two comparisons, form a judgment matrix, and perform consistency of the judgment matrix test. Following the test, it was determined that the CR value of each judgment matrix is less than 0.1, successfully passing the consistency test. The resultant influence relationship was then computed using the judgment matrix, resulting in the generation of the weighted and limit super matrices.
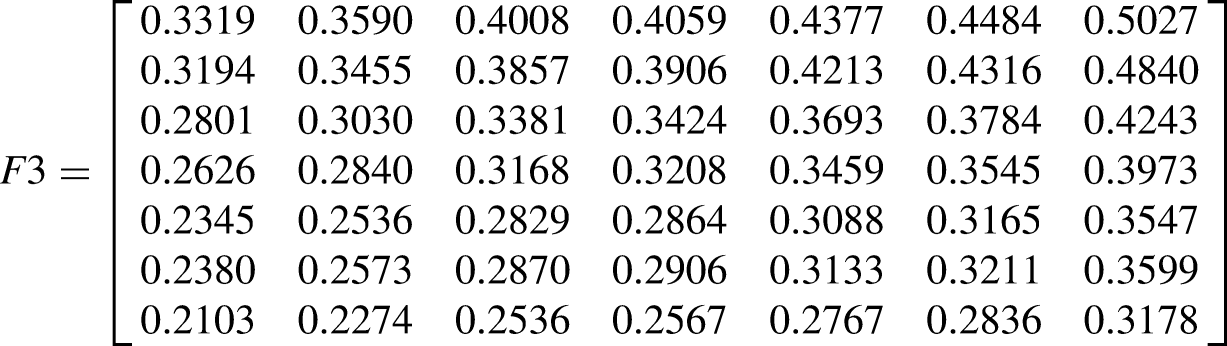
For the reason of space, only the limit supermatrix is listed in this paper.
The limit super matrix of smart elderly care infrastructure F1:


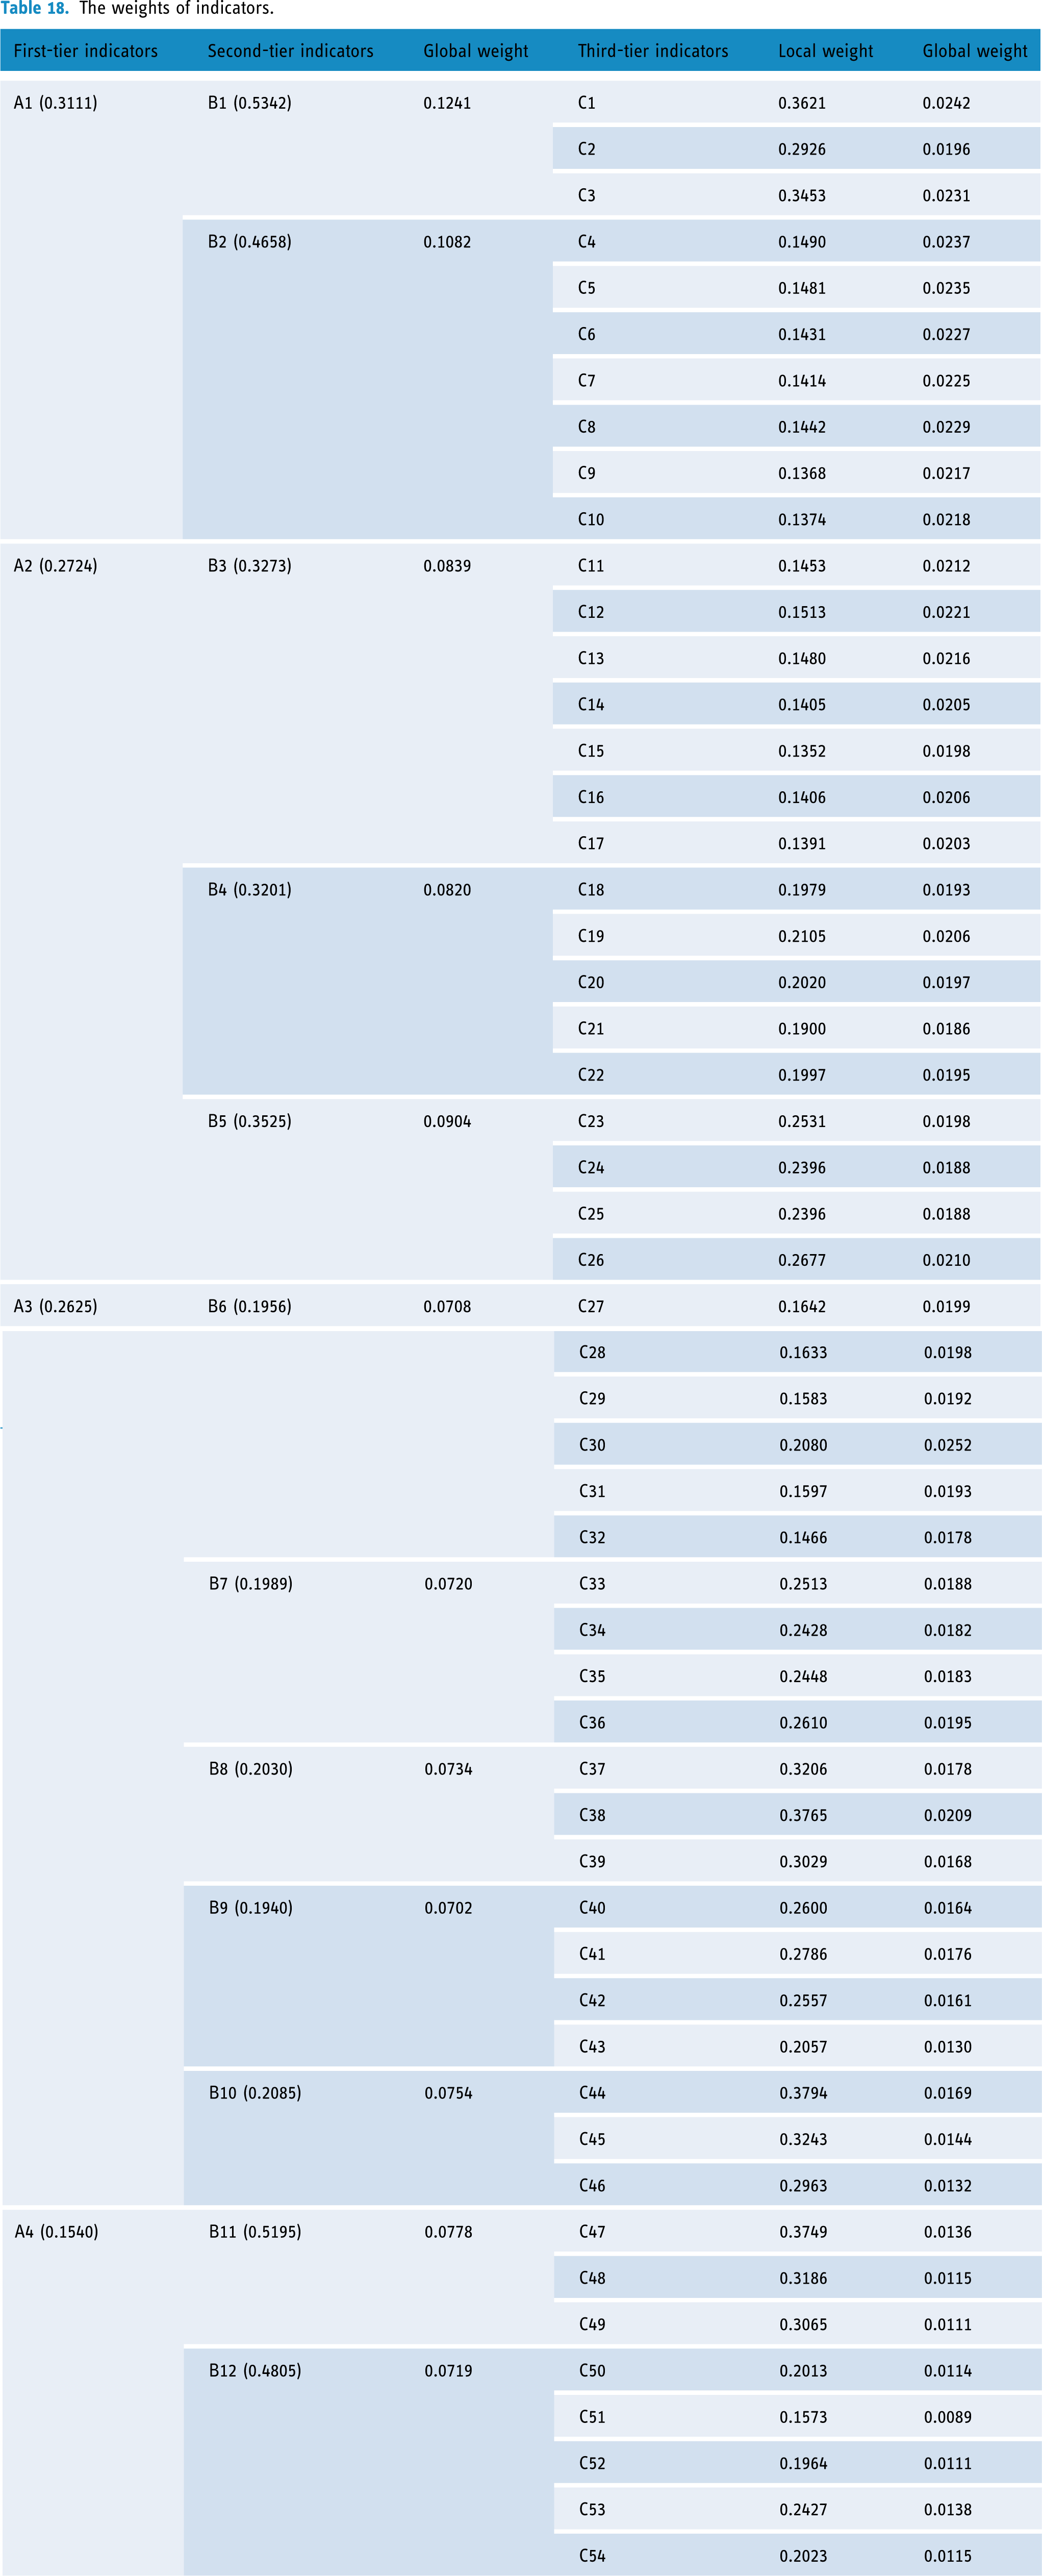
The weights of indicators.
The weight ranking results.
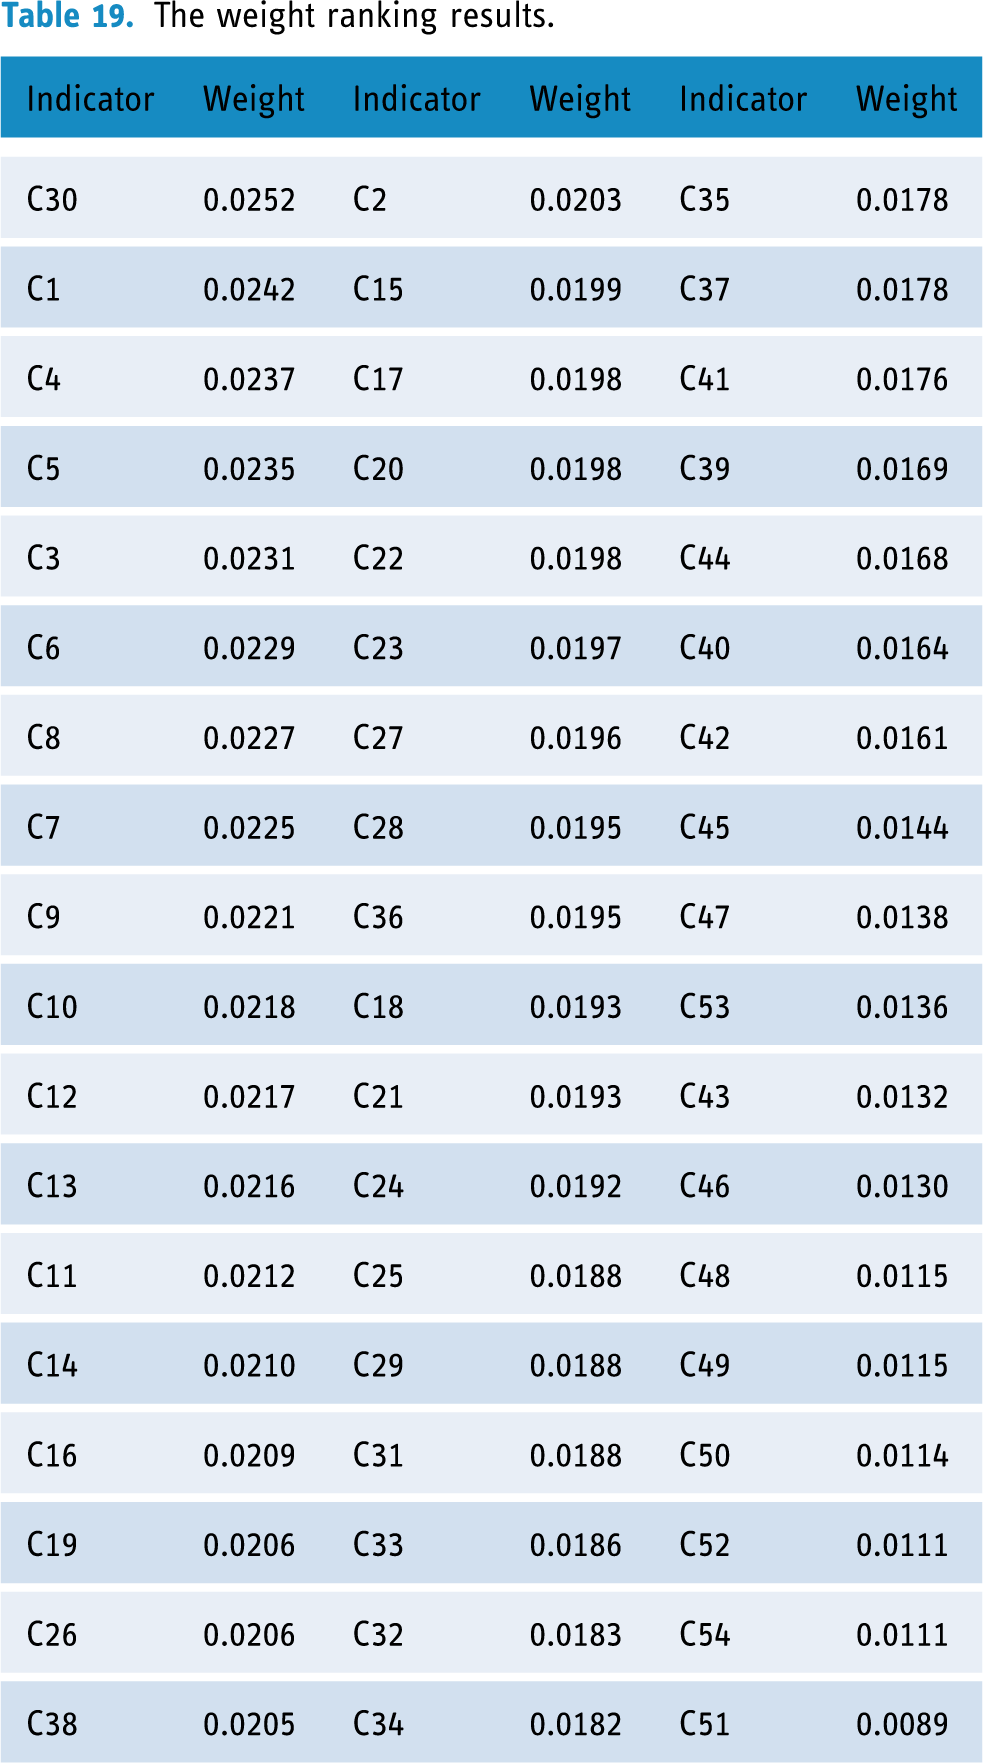
According to Tables 18 and 19, the study calculated and presented the weights of key service quality indicators for smart elderly care institutions. In the first-tier indicators, infrastructure (W = 0.3111) was the most important dimension. In the second-tier indicators, smart elderly care infrastructure (LW = 0.5342, GW = 0.1241), living services infrastructure (LW = 0.4658, GW =0.1082), and intention to use (LW = 0.5195, GW = 0.0778) are the key indicators. While in the third-tier indicators, the rate of health file creation (GW = 0.0252), 3S equipment coverage (GW = 0.0242), average living space per bed (GW = 0.0237), outdoor activity space (GW = 0.0235), ICT investment rate (GW = 0.0231), health room per bed (GW = 0.0229), and availability of cultural and sports room (GW = 0.0227) own a more significant weight, which indicates that primarily improving these indicators can more effectively prompt the service quality of intelligent elderly care institution.
In this scenario, the necessity of sensitivity analysis in the DEMATEL-ANP approach is obviated. Following three iterations of a refined Delphi process, the data sources have been deemed credible, and the concordance of expert opinions is apparent, signifying a substantial consensus in the model's outcomes.63,64 Consequently, the preliminary findings of the model are deemed adequate to inform decision-making processes.
Discussion
This study integrates the results of weights ranking to present a comprehensive discussion and suggestion for smart elderly care institutions to enhance their service quality:
“Service resource” is the core factor
The first-tier indicators contain four factors, and the centrality ranks as follows: service resource, service content, infrastructure, and service outcome. This finding indicates that service resource is the core factor with the strongest influence capacity. Also, the status of causality and weights presents that the service resource ranks in the top two positions. Zhao and Zhao 27 stated that the “hardware application,” mainly refers to intelligence equipment, is the key factor in enhancing the service quality of smart elderly care institutions. Li et al. 26 presented that the “nursing care resource” with the medical service level and smart equipment are the critical quality characteristics. Therefore, this study's results are consistent with those of the above academic works. Thus, we confirm that the Service resource is the core factor among the first-tier indicators. To improve the service quality of smart elderly care, we can solidify the infrastructure and service resources. For instance, leveraging various resources and funds in the field of the big health industry, smart elderly care institutions can vigorously develop elderly companion robots and intelligent interaction platforms to provide personalized spiritual comfort services to elderly users by adding technical functions such as voice interaction, multiperson chat, and video calls. Moreover, institutions can implement Internet of Things (IoT)-based healthcare systems that integrate wearable technologies to monitor clinical health parameters, recognize physical activities, and manage chronic diseases, mental health conditions, and cognitive disorders. 65
Infrastructure and other hard service resources are the key factors
The “Smart elderly care infrastructure” refers to the Wi-Fi, smart network, and 3S (RS, GIS, GPS) building, ranks No.1 of centrality among the second-tier indicators. It is considered the base and foundation of smart elderly care services. Feng and Hei 66 stated that the long-term development of smart aging services is closely related to the level of investment in solid infrastructure. Therefore, investment in smart infrastructure is a key approach to enhancing service quality. The “3S (RS, GIS, GPS) device coverage” ranks second among all the third-tier indicators; it is also an active impact factor that can influence on “Smart network rollout rate” and “ICT capital investment rate.” In modern information technology, the collective term “3S” refers to space technology, sensor technology, satellite positioning and navigation technology, computer technology, and communication technology. It is very well integrated with a multidisciplinary strategy for acquiring, processing, managing, analyzing, expressing, disseminating, and using space data. 67 Thus, it is the technical foundation of IoT, VR, and other information technologies applied in smart elderly care industry. Hence, to improve the service quality, one of the effective ways is to develop smart device coverage. Encouraging and guiding the migration of talented individuals in information technology, big data, IoT, cloud, and other relevant fields to the smart elderly service industry can significantly enhance the knowledge and skills of practitioners in this domain. 68
“Staffing” is the key factor in “service resource”
The quality of employees is always a prevalent issue in the service industry. Moreover, the elderly nursing staffs need basic medical, healthcare management, and nursing knowledge. Chen et al. 51 presented that the “service personnel” is a relatively crucial factor that acquire a weight of 0.392 in their research. Hence, developing a training system for skilled professionals in the big health and elderly service industries can expand the construction of medical and recreational professional technical and service personnel teams. Furthermore, institutions can integrate advanced technologies, including wearable sensors and artificial intelligence, 69 to enhance the quality of nursing care and improve the overall experience of healthcare staff. Additionally, establishing standardized protocols for nursing home staff is essential to ensure the reliability and professionalism of service personnel.
“Service empathy” is the crucial factor in “Service content”
“Service empathy” refers to helpful and caring employees, understanding nurses, and no discrimination. Ko and Chou 70 stated that the dimension of “empathy” acquires a high importance score to measure the service quality of the ICT technology-based nursing home. This finding implies that although technologies are fundamental to smart elderly care, affection, and caring are indispensable factors that can effectively enhance service quality. Smart elderly care systems offer significant convenience and enhance the quality of life for seniors; however, they may inadvertently reduce interpersonal interactions among the elderly. 71 To address this, institutions can leverage the time saved through smart technologies to provide holistic care, ensuring the psychological and physical well-being of seniors while also supporting their spiritual needs.
“Intention to use” is the important factor in “Service outcome”
“Intention to use” ranks number five for centrality, which implies that the willingness to accept smart elderly care service is relatively crucial compared to customer satisfaction. It is a special indicator that focuses on the consumers. Pan 45 emphasized that the propaganda and advocacy of smart elderly care effectively reflect the service quality. Thus, for practical industries, to provide personalized and refined elderly services that can enhance service satisfaction and willingness to adopt, it is crucial to identify and categorize the needs of elderly users. Furthermore, Chan et al. 46 emphasize that trust, particularly concerning data protection, positively influences usage intentions. Therefore, prioritizing data privacy and implementing robust data protection measures can significantly enhance the willingness of users to adopt these services.
Conclusion
In summary, this study has developed an evaluation system for the quality of smart aging services, which identifies the professional competencies that smart aging organizations should possess. By combining Modified-Delphi and DEMATEL-ANP, we can further analyze the relationships and linkages between the indicators of service quality assessment to better understand which indicators are the most critical core competencies for improving the service quality of smart elderly care organizations. These findings will be a reference for future professional competency development and assessment of service quality in elderly care facilities.
This study offers potential innovations in four key areas:
By integrating the SPO theoretical framework, the theory of Cooperative Development Model of Science & Technology Service, and social technology theory, this research expands the theoretical underpinnings of smart elderly care institutions. It creatively proposes a “Technology + Service” synergistic theoretical framework,” enriching the theoretical and knowledge structure of smart elderly care services.
From the perspective of technology-service synergy, this study explores innovative service models tailored to the new scenarios of smart elderly care institutions characterized by intelligence, integration, and personalization. It integrates multistakeholder and societal resources to construct an evaluation system for service quality, incorporating multifactor collaborative effects. This provides a novel research approach for investigating multiple development paths to enhance service quality in smart elderly care.
The practical significance of this study firstly lies in its development of enriching the factors influencing the quality of smart elderly care services. It points out the direction for the high-quality development of smart elderly care institutions. By applying this evaluation system to actual institutions, weaknesses, leaks, pain points, and difficulties in service quality can be identified in a targeted manner.
It contributes to developing standardized policies for services in the elderly care industry. This study can address the issue of standardization in the elderly care industry by providing a reliable and scientific standard or specification for new private enterprises that enter the industry, which can make the silver hair economy a sunrise industry and mitigate the complex problem of China's aging population. Ultimately, this study can promote the healthy and sustainable development of the intelligent elderly care industry.
There are still some limitations which can be improved by the future research: The method is based on expert scoring of the relationships between model criteria and model indicators, but the lack of regional expansion of experts due to resource constraints impacts the research results. It is necessary to consider a multiregional and extensive collection of research in the future, which will increase the generalizability and guiding nature of the research findings. Therefore, a future study could concentrate on testing the evaluation system's accuracy after there are representative smart elderly care institutions.
Footnotes
Acknowledgements
The authors want to thank City University of Macau for supporting and cooperating with our study.
Availability of data and materials
Contributorship
XYL was responsible for the study design and the article's drafting. XXL was responsible for data collecting. YW was responsible for data analyzing and interpreting. KYC was responsible for critically revising. All authors read and approved the final manuscript.
Declaration of conflicting interests
The authors declared no potential conflicts of interest with respect to the research, authorship, and/or publication of this article.
Funding
This research was funded by Hunan Office of Philosophy and Social Science (23YBA265). This research was also funded by Scientific Research Project of Education Department of Hunan Province (24B0868).
Appendix
The Finally Version of Service Quality Evaluation System.

| First-tier indicators | Code | Second-tier indicators | Code | Third-tier indicators | Code |
|---|---|---|---|---|---|
| Infrastructure | A1 | Smart elderly care infrastructure | B1 | 3S (RS, GIS, GPS) device coverage | C1 |
| Smart network rollout rate | C2 | ||||
| ICT capital investment rate (ICT) | C3 | ||||
| Living services infrastructure | B2 | Average living space per bed (≥12.0 sqm/bed) | C4 | ||
| Outdoor activity space greening rate (outdoor activity space ≥ 150 m2 and greening area ≥60%) | C5 | ||||
| Healthcare room per bed (≥3.0 m2 ) | C6 | ||||
| Bathroom and bed for wheelchair users | C7 | ||||
| Room for cultural and sports activities | C8 | ||||
| Psychological counselling room | C9 | ||||
| Availability of a hospice room | C10 | ||||
| Service resources (Structure) | A2 | Smart equipment | B3 | Intelligent health management device penetration rate (blood glucose, blood pressure, body fat and other basic devices) | C11 |
| Intelligent accident monitoring equipment penetration rate | C12 | ||||
| Intelligent elderly care equipment penetration rate | C13 | ||||
| Intelligent rehabilitation equipment penetration rate | C14 | ||||
| Penetration rate of self-help health monitoring equipment | C15 |
| First-tier indicators | Code | Second-tier indicators | Code | Third-tier indicators | Code |
|---|---|---|---|---|---|
|
|
Penetration rate of grassroots follow-up equipment | C16 | |||
| Penetration rate of wearable devices such as watches, bracelets and belts | C17 | ||||
| Medical supporting resource | B4 | Availability of home healthcare services | C18 | ||
| Availability of offline medical care services | C19 | ||||
| Availability of remote medical care services | C20 | ||||
| Number of partner hospitals | C21 | ||||
| Grade of the hospital the company is working with | C22 | ||||
| Staffing | B5 | Percentage of nursing professionals | C23 | ||
| Percentage of medical professionals | C24 | ||||
| Percentage of management staff who have received professional training | C25 | ||||
| Percentage of talents in intelligent facility management | C26 | ||||
| Service content (Process) | A3 | Service reliability | B6 | Reasonable nutritional mix of meals provided | C27 |
| Average daily number of cleaning and nursing services for the elderly with disabilities | C28 | ||||
| Service personnel have professional psychological counselling skills | C29 |
| First-tier indicators | Code | Second-tier indicators | Code | Third-tier indicators | Code |
|---|---|---|---|---|---|
|
|
The rate of health file creation | C30 | |||
| Service personnel have professional first aid knowledge and skills | C31 | ||||
| Whether they can handle general emergencies | C32 | ||||
| Platform intelligence | B7 | Service platform provides personalized information services | C33 | ||
| Service platform stability and access speed | C34 | ||||
| Service platform operation interface is easy to understand | C35 | ||||
| Service platform can share information with children | C36 | ||||
| Privacy protection | B8 | Protection of user information privacy | C37 | ||
| Transaction and payment privacy protection | C38 | ||||
| Platform system privacy protection | C39 | ||||
| Service responsiveness | B9 | On-time delivery of agreed service items | C40 | ||
| Service personnel can respond to your service requests in the first instance | C41 | ||||
| The service staff can give you an exact time for the service that cannot be dealt with immediately | C42 | ||||
| Service staff are prompt to remedy any errors in the service process | C43 |
| First-tier indicators | Code | Second-tier indicators | Code | Third-tier indicators | Code |
|---|---|---|---|---|---|
|
|
Service empathy | B10 | Staff are helpful, careful and friendly | C44 | |
| Caregivers are aware of the needs of the elderly | C45 | ||||
| No discrimination against the elderly | C46 | ||||
| Service performance | A4 | Intention to use | B11 | Customers prefer Smart Aged Care to traditional aged care | C47 |
| Customers are willing to take up Smart Aging services again | C48 | ||||
| Customers are willing to recommend Smart Aging services to others | C49 | ||||
| Customer satisfaction | B12 | Satisfaction with the use of the facility's smart devices | C50 | ||
| Satisfaction with care services | C51 | ||||
| Satisfaction with safety and care services | C52 | ||||
| Satisfaction with services in the area of spiritual well-being | C53 | ||||
| Satisfaction with health care services | C54 |