
Abstract
Objective
Pressure injuries (PIs) pose a significant concern in hospital care, necessitating early and accurate prediction to mitigate adverse outcomes.
Methods
The proposed approach receives multiple patients records, selects key features of discrete numerical based on their relevance to PIs, and trains a random forest (RF) machine learning (ML) algorithm to build a predictive model. Pairs of significant categorical features with high contributions to the prediction results are grouped, and the PI risk probability for each group is calculated. High-risk group probabilities are then added as new features to the original feature subset, generating a new feature subset to replace the original one, which is then used to retrain the RF model.
Results
The proposed method achieved an accuracy of 83.44%, sensitivity of 84.59%, specificity of 83.42%, and an area under the curve of 0.84.
Conclusion
The ML-based approach, coupled with feature aggregation, enhances predictive performance, aiding clinical teams in understanding crucial features and the model's decision-making process.
Keywords
Introduction
Pressure injury (PI) was common clinical medical problems while was an evaluation indicator of critical clinical monitoring and the quality of nursing care. 1 PI was an area of injured skin when force was applied on the surface of the skin. 2 If the wound advanced to a deep or infected that could be life-threatening for patients.3,4 For the intensive care unit and general ward, PI prevalence probability of 16.9–23.8% and 8.5% in the United States, respectively.5–8 PIs increased the average hospital length of stay by 4–10 days with a total accounting of approximately $10,708 per patient for treatment.9–11 Obviously, PIs contributed adversely to patient mortality, hospital length of stay, and healthcare costs, thereby considered severe adverse events.12–14 Most PIs were reasonably preventable. 15 In 2019, 16 the clinical practice guideline with prevention and treatment of pressure ulcers development protocol updated, except that compiling various PIs risk factors, while suggested that clinical guidelines focus on preventive nursing interventions thereafter to identify individuals at risk of developing PIs. Hence, identifying PIs as early as possible was the best way to reduce healthcare resources utilization and advance the patient's safety. Despite accompanying the precise treatment and professional assessment, there still were two challenges with early identification risk of PI. First, existing evaluation of PI risk tools had limited accuracy, including the inability to incorporate diverse types of data, such as unstructured clinical notes and environmental factors. Second, several existing tools rely on manually selected features, which may introduce bias and fail to capture relationships among variables. Moreover, these tools often lack generalizability across different healthcare settings due to patient populations and clinical practice variations, leading to inconsistent performance.17–20 Subsequently, the tools had not been shown to reduce PIs. 21
Artificial intelligence (AI) approaches such as random forest (RF), 22 gradient boosting machine, 23 linear regression, 24 support vector machine (SVM), 25 and deep neural network 26 played an important role in disease prediction. Meanwhile, previous studies suggested that the AI approaches were meaningful for predicting of high risk events. 27 Jin et al. 15 proposed an automatic scheme to assess fall risk and PI based on generally machine learning (ML). In this work, the advantage was proving the degree of agreement between the automated risk assessment systems and the scales commonly used by nurses. Song et al. 21 developed a framework for PI risk assessment for in-hospital and non-hospital patients. In the prediction method, the PI risk assessment used three ML models that used lab tests, medical diagnoses, and nursing flowsheet data in the electronic health record (EHR) for building an automatic early assessment tool to facilitate early prevention and treatment. However, the clinical dataset contained a data imbalance problem likely resulting in model overfitting and miss prediction of positive cases. In addition, laboratory test results and medication information were often incomplete or inaccurately recorded, further complicating the data preprocessing and feature extraction processes. To overcome these challenges, this study proposes an effective automated approach that initially employs expert knowledge to define and extract feature variables during the data preparation. Subsequently, statistical algorithms are utilized in feature engineering to enable automated feature selection. To further reduce false predictions and address imbalanced datasets, a proposed feature aggregation method using feature scaling followed by feature interaction is introduced to generate combined features. Following this, ML techniques are applied to develop a predictive model for PI risk. Moreover, by recalibrating the model's internal weights, the effectiveness of these combined features is improved, ultimately improving the model's early prediction performance for PI risk.
Materials and methods
We developed an AI-prediction approach combining ML and expert knowledge to predict generating PI risk of admission patients. In data preparation, expert knowledge was used to define and extract feature variables. The proposed model was composed of feature engineering and predictive model development. First, for feature engineering, the one-hot encoding was performed on feature normalization, and then the recursive feature elimination (RFE) technology 28 was performed on the initial input feature set to remove non-informative features. Then, for the predictive model development, the RF 29 was applied to classify the admission patient as risk of PI, while using feature aggregation to combine the top five of discrete numerical features and 1 of clinically significant feature to improve predictive model performance. Moreover, the 10-fold cross-validation scheme 30 was used for the stability and effectiveness validation in the training phase of the proposed method. Figure 1 illustrates the flowchart of the proposed ML-based method.

Flowchart of our proposed ML-based method.
Materials
As the dataset, we retrospectively reviewed the EHR of 95,027 adult patients (aged ≥20 years) and without including the PI was determined before admission who admission nursing assessment from August 2018 to June 2020. All personal information was identified at the point of analysis, while the patients were assigned a unique study identification number in the dataset. In addition, each admission of a patient at a different time was considered as a single data point. As a quality control measure, the patients who had hospice care were excluded (n = 363). The abnormal value of height and weight (n = 28), the record of nursing care which had missing value (n = 28), and abnormal assessment data (n = 11). Ultimately, total 94,589 patients which included the 1852 patients were defined as the admission PI and 92,737 patients were defined as the control group (Figure 2). This study was approved by the Institutional Review Board of the Changhua Christian Hospital (CCH) and granted a waiver of informed consent. We random split the data into 80% training/validation dataset (n = 75,672, positive case = 1482, negative case = 74,190) and 20% testing dataset (n = 18,917, positive case = 370, negative case = 18,847) to evaluate the performance of the proposed method. In the training/validation dataset, we applied a 10-fold cross-validation scheme using stratified sampling to ensure that the class distribution remained consistent across each fold. Stratified sampling was employed to maintain the original ratio of positive and negative cases in each fold, thereby preserving the balance of class distribution. This approach allows for a more accurate estimation of the model's performance, especially when dealing with an imbalanced dataset, as it ensures that each fold has a representative sample of both positive and negative cases.
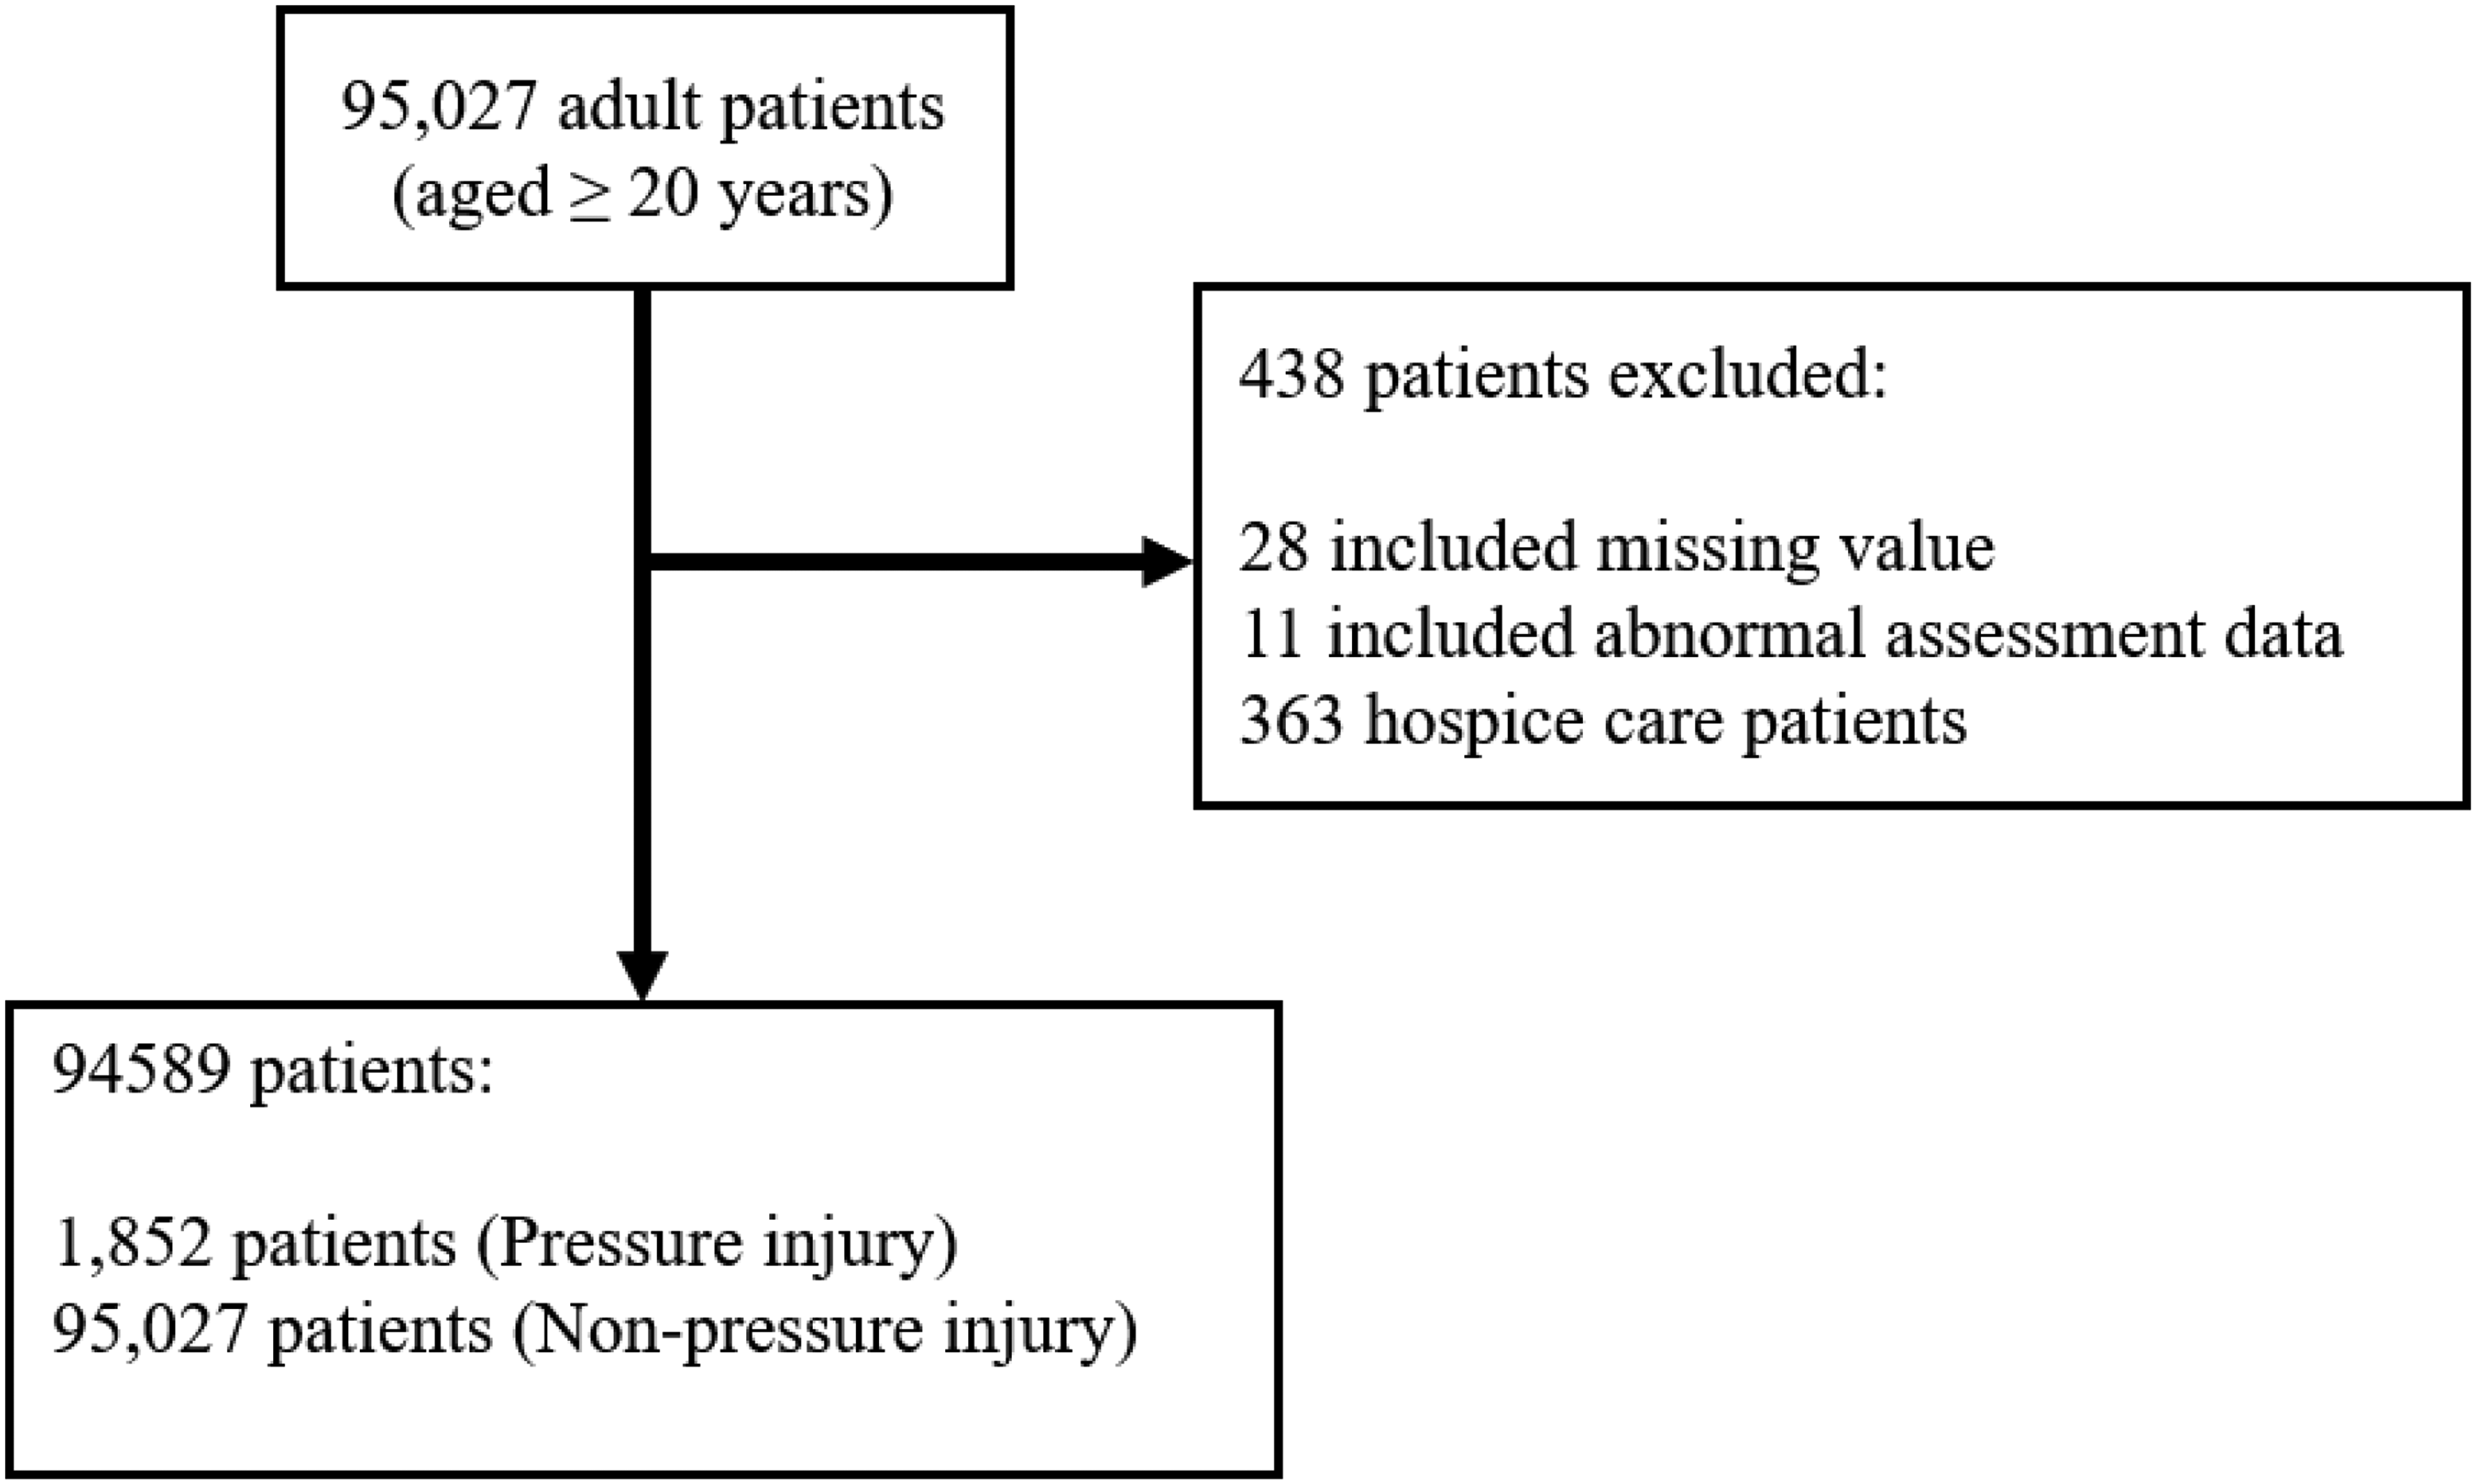
Flowchart of the study population.
Data preparation
Before developing the predictive model, we conducted data preparation, including variable definition and feature extraction. For feature extraction, we performed a literature review to identify relevant features from our defined variables based on previous studies. Clinical experts then reviewed all features obtained from the CCH clinical research database, a compilation of data from CCH EHR systems. We selected 46 features, encompassing demographics, clinical characteristics, nursing assessments, and medical history. The decision to exclude other types of features, such as laboratory results and medication records, was based on several considerations. First, nursing assessments are conducted during the initial admission process, where nursing staff perform a comprehensive evaluation of the patient's condition. These initial assessments are critical as they provide the foundation for patient care, especially in identifying the risk of PIs. The tools used during this process are specifically designed to evaluate PI risk, and the results serve as essential information for nurses working in shifts to ensure continuity of care. Second, laboratory results and medication records are typically generated after admission and thus are not available during the initial evaluation. Since the proposed method aims to predict PI risk immediately following the first nursing assessment, such features would not align with the intended clinical application. Third, while existing nursing assessment tools provide valuable insights, they are often subjective and lack comprehensiveness. To address this limitation, we incorporated features related to demographics, clinical characteristics, and medical history to develop a more objective and robust predictive framework. This integration ensures that the model not only complements existing nursing assessments but also establishes a standardized approach to PI risk prediction.
Feature engineering
Feature normalization and selection
In total, 46 features were defined, and one-hot encoding was applied to normalize all features into initial feature sets. For feature selection, we employed RFE technology to choose the initial optimal subset of features for predicting PI occurrence risk, resulting in 23 selected features. The RFE algorithm used a proposed predictive model as its estimator. RF was chosen due to its ability to handle both categorical and numerical data effectively and its robustness in assessing feature importance by calculating Gini index. 31 During each iteration of RFE, the RF model ranked features based on their contribution to the model's predictive performance, using sensitivity as the selection criterion, which allowed us to systematically eliminate less relevant features while retaining the most informative ones. This process improved model interpretability and enhanced computational efficiency by reducing dimensionality. After evaluating different subsets of features, we determined that selecting 23 features provided the best balance between predictive power and computational efficiency. Descriptive statistics of these selected features for the training and test sets were presented in Table 1.
Proposed features with RFE feature selection in overall cohort and split datasets.

Note. RFE: recursive feature elimination; PI: pressure injury; BMI: body mass index.
Subsequently, the Gini index was applied to rank features based on feature importance. The Gini index calculates node impurity for each feature and sample, representing the impact of each feature on the trained model. For example, consider the feature of PressureInjuryRiskGroup for 0 (low risk), there were 10 cases, with 2 developing PIs and 8 not. The Gini index for 0 is calculated as 0.2 × 2 + 0.8 × 2 = 0.68. For 1 (high risk), there were 20 cases, with 13 developing PIs and 7 not, resulting in a Gini coefficient of 0.65 × 2 + 0.35 × 2 = 0.5. The weighted Gini index for PressureInjuryRiskGroup is then calculated as (10/30) × 0.68 + (20/30) × 0.55 = 0.59.
Feature aggregation
To improve the accuracy and robustness of the predictive model, the proposed feature aggregation method was developed to extract potential interactions between discrete numerical features and the clinically significant feature PressureInjuryBefore. This feature, which reflects whether a patient had a prior history of PIs before admission, is recognized as a key factor in predicting future PI risks. By examining the relationships between PressureInjuryBefore and other discrete numerical features, the method identifies hidden correlations that are not easily captured through conventional feature selection processes. These aggregated features contribute additional predictive value by incorporating clinically relevant interactions, allowing the model to provide more precise and meaningful predictions while addressing the limitations of traditional approaches.
Discrete numerical features with a Gini index of the top five were prioritized and selected for feature aggregation to improve prediction performance and identify potentially correlated features. For example, a pair of features such as feature BarthelIndexTotalGroup (categorized into 1 to 5) and feature PressureInjuryRiskGroup (categorized into 0, 1) might be selected. After determining key features, pairs of these features were created, and the conditional probabilities of PI risk for each feature pair were calculated. These probabilities were defined as new feature values and added to the feature subset, forming a new feature set.
During the feature aggregation, a set of the top five discrete numerical features {X1, X2, …, Xm}, each containing n samples, had been selected. Subsequently, the mean μj and standard deviation σj had been computed for each feature Xj across all samples, as follows:

By applying feature aggregation, the feature space was enriched with interaction terms that captured nonlinear relationships among the standardized features, while improving the model's predictive performance. For example, consider two discrete numerical features, X1 and X2, each containing three samples (n = 3), X1 = {10, 12, 14} and X2 = {30, 28, 32}. First, for X1, the mean (μ1) was (10 + 12 + 14)/3 = 12, and the standard deviation (σ1) was calculated as √[((10 − 12)2 + (12 − 12)2 + (14 − 12)2)/3] = √(8/3) ≈ 1.6329. For X2, the mean (μ2) was (30 + 28 + 32)/3 = 30, and the standard deviation (σ2) was √[((30 − 30)2 + (28 − 30)2 + (32 − 30)2)/3] = √(8/3) ≈ 1.6329. Then, standardize each feature using the computed mean and standard deviation. For
Fifteen features generated by the feature aggregation of the proposed method.

Feature selection and feature aggregation
Model development
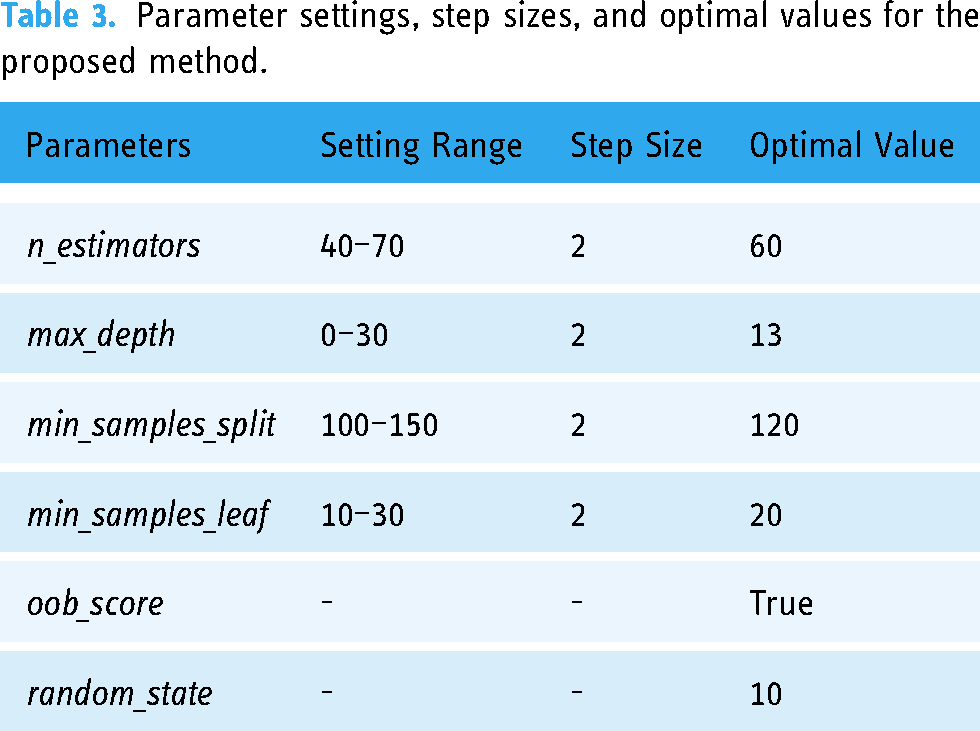
In the development of the predictive model, the proposed model was built upon the RF ML algorithm. RF is an ensemble learning method for classification that constructs numerous decision trees. It addresses overfitting to the training dataset and alleviates the issue of data imbalance. To mitigate data imbalance, class weights were employed by assigning different weights to both the majority and minority classes in the proposed model. The formula for calculating weightj is as follows: weightj = n_samples/(n_classes × n_samplesj), where the j is the signified class, weightj is the weight for each class, n_samples is the total number of samples, n_classes is the total number of classes, and n_samplesj is the total number of the respective class. To optimize the performance of the RF model and reduce issues such as underfitting or overfitting, hyperparameters were adjusted using exhaustive grid search algorithm. In this approach, a specific range of parameter values was manually defined based on prior experience, and step sizes were set to iteratively adjust parameters. For instance, the n_estimators parameter started at n_estimators = 40, and with a step size of 2, the next value was set to n_estimators = 40 + 2 until the entire range was evaluated. The grid search algorithm computed the model performance for all parameter combinations and identified the hyperparameter settings that achieved the highest accuracy on the testing dataset. The best hyperparameter settings obtained in this study are listed in Table 3. The best hyperparameters that included n_estimators, max_depth, min_samples_split, min_samples_leaf, max_features, oob_score, and random_state were set at 60, 13, 120, 20, 7, True, and 10, respectively.
Parameter settings, step sizes, and optimal values for the proposed method.
Comparison
In this study, performance in total, risk of PI was performed by the proposed predictive model and four well-known ML algorithms to estimate the model capability. Additionally, ensemble learning methods were included in the comparison. Four well-known ML algorithms, the RF, light gradient boosting (LGBM), eXtreme gradient boosting (XGBoost), and SVM, were executed for risk prediction after mode training. All parameters and settings were the same as the default for each algorithm. Moreover, each well-known ML algorithm trained with synthetic minority oversampling technique (SMOTE) and SMOTE edited nearest neighbor (SMOTEENN) were also added to our model comparison. All ML models used in this study were trained and tested with the same training, validation, and test sets.
Statistical analysis
There were 10 performance indices, including accuracy (ACC), sensitivity (SEN), specificity (SPEC), precision (macro average), recall (macro average), positive-predictive value (PPV), negative-predictive value (NPV), Matthews correlation coefficient (MCC), F1-score (macro average), and the area under the curve (AUC). In addition, the receiver operating characteristic (ROC) curve was used to compare the trade-offs between sensitivity and specificity by applying ROCKIT software (C. Metz; University of Chicago, Chicago, IL, USA). All performance indices also computed and compared based on the chi-square test and Kolmogorov–Smirnov test whether as normal distribution and 95% confidence interval for odds ratio. Besides, the t-test was used for normal distribution; the Mann–Whitney U-test was applied for non-normal distribution. The p-value was considered to indicate a statistically significant difference if less than 0.05.
Results
All our experiments were conducted using the Python programming language with Python open libraries such as pandas, scikit-learn, SHAP, lightGBM, SVC, etc. We used a machine with the Microsoft Windows 11 operating system, Intel Core i5-9600 3.10 GHz processor, and 32 GB of random access memory with 2400 MHz.
The confusion matrix results are presented in Table 4, where the full names of true negative (TN), true positive (TP), false negative (FN), and false positive (FP), respectively. The estimated experimental results are shown in Table 5, with ACC, SEN, SPEC, Precision, Recall, PPV, NPV, MCC, F1-score, and AUC being 83.44, 84.59, 83.42, 54.44, 84.01, 9.24, 99.63, 24.56, 53.73, and 0.838, respectively. The results demonstrate the proposed method was an efficient method that can improve a relatively accurate result and reduce miss predictions in positive cases. Moreover, the ROC curves of all models are displayed in Figure 3(a) to (c). On the other hand, compared to the proposed method without (W/O) feature aggregation, the performance of the proposed method was better. The ROC curve of the proposed model and W/O feature aggregation performances are illustrated in Figure 3(d). The odds ratios between the other models and the proposed method performance in the predicting risk of PI are listed in Table 6, and the p-values are listed in Table 7.

Receiver operating characteristic (ROC) curve of the proposed method with other different machine learning methods.
TN, TP, FN, and FP of the proposed method and other different models.

Note. TN: true negative; TP: true positive; FN: false negative; FP: false positive; ML: machine learning; RF: random forest; SVM: support vector machine; LGBM: light gradient boosting; XGBoost: eXtreme gradient boosting; SMOTE: synthetic minority oversampling technique; SMOTEENN: SMOTE edited nearest neighbor.
Performance of the proposed method and other different models.

Note. ACC: accuracy; SEN: sensitivity; SPEC: specificity; PPV: positive-predictive value; NPV: negative-predictive value; MCC: Matthews correlation coefficient; AUC: area under the curve; ML: machine learning; RF: random forest; SVM: support vector machine; LGBM: light gradient boosting; XGBoost: eXtreme gradient boosting; SMOTE: synthetic minority oversampling technique; SMOTEENN: SMOTE edited nearest neighbor.
Comparison odd ratio of between other method and the proposed method.
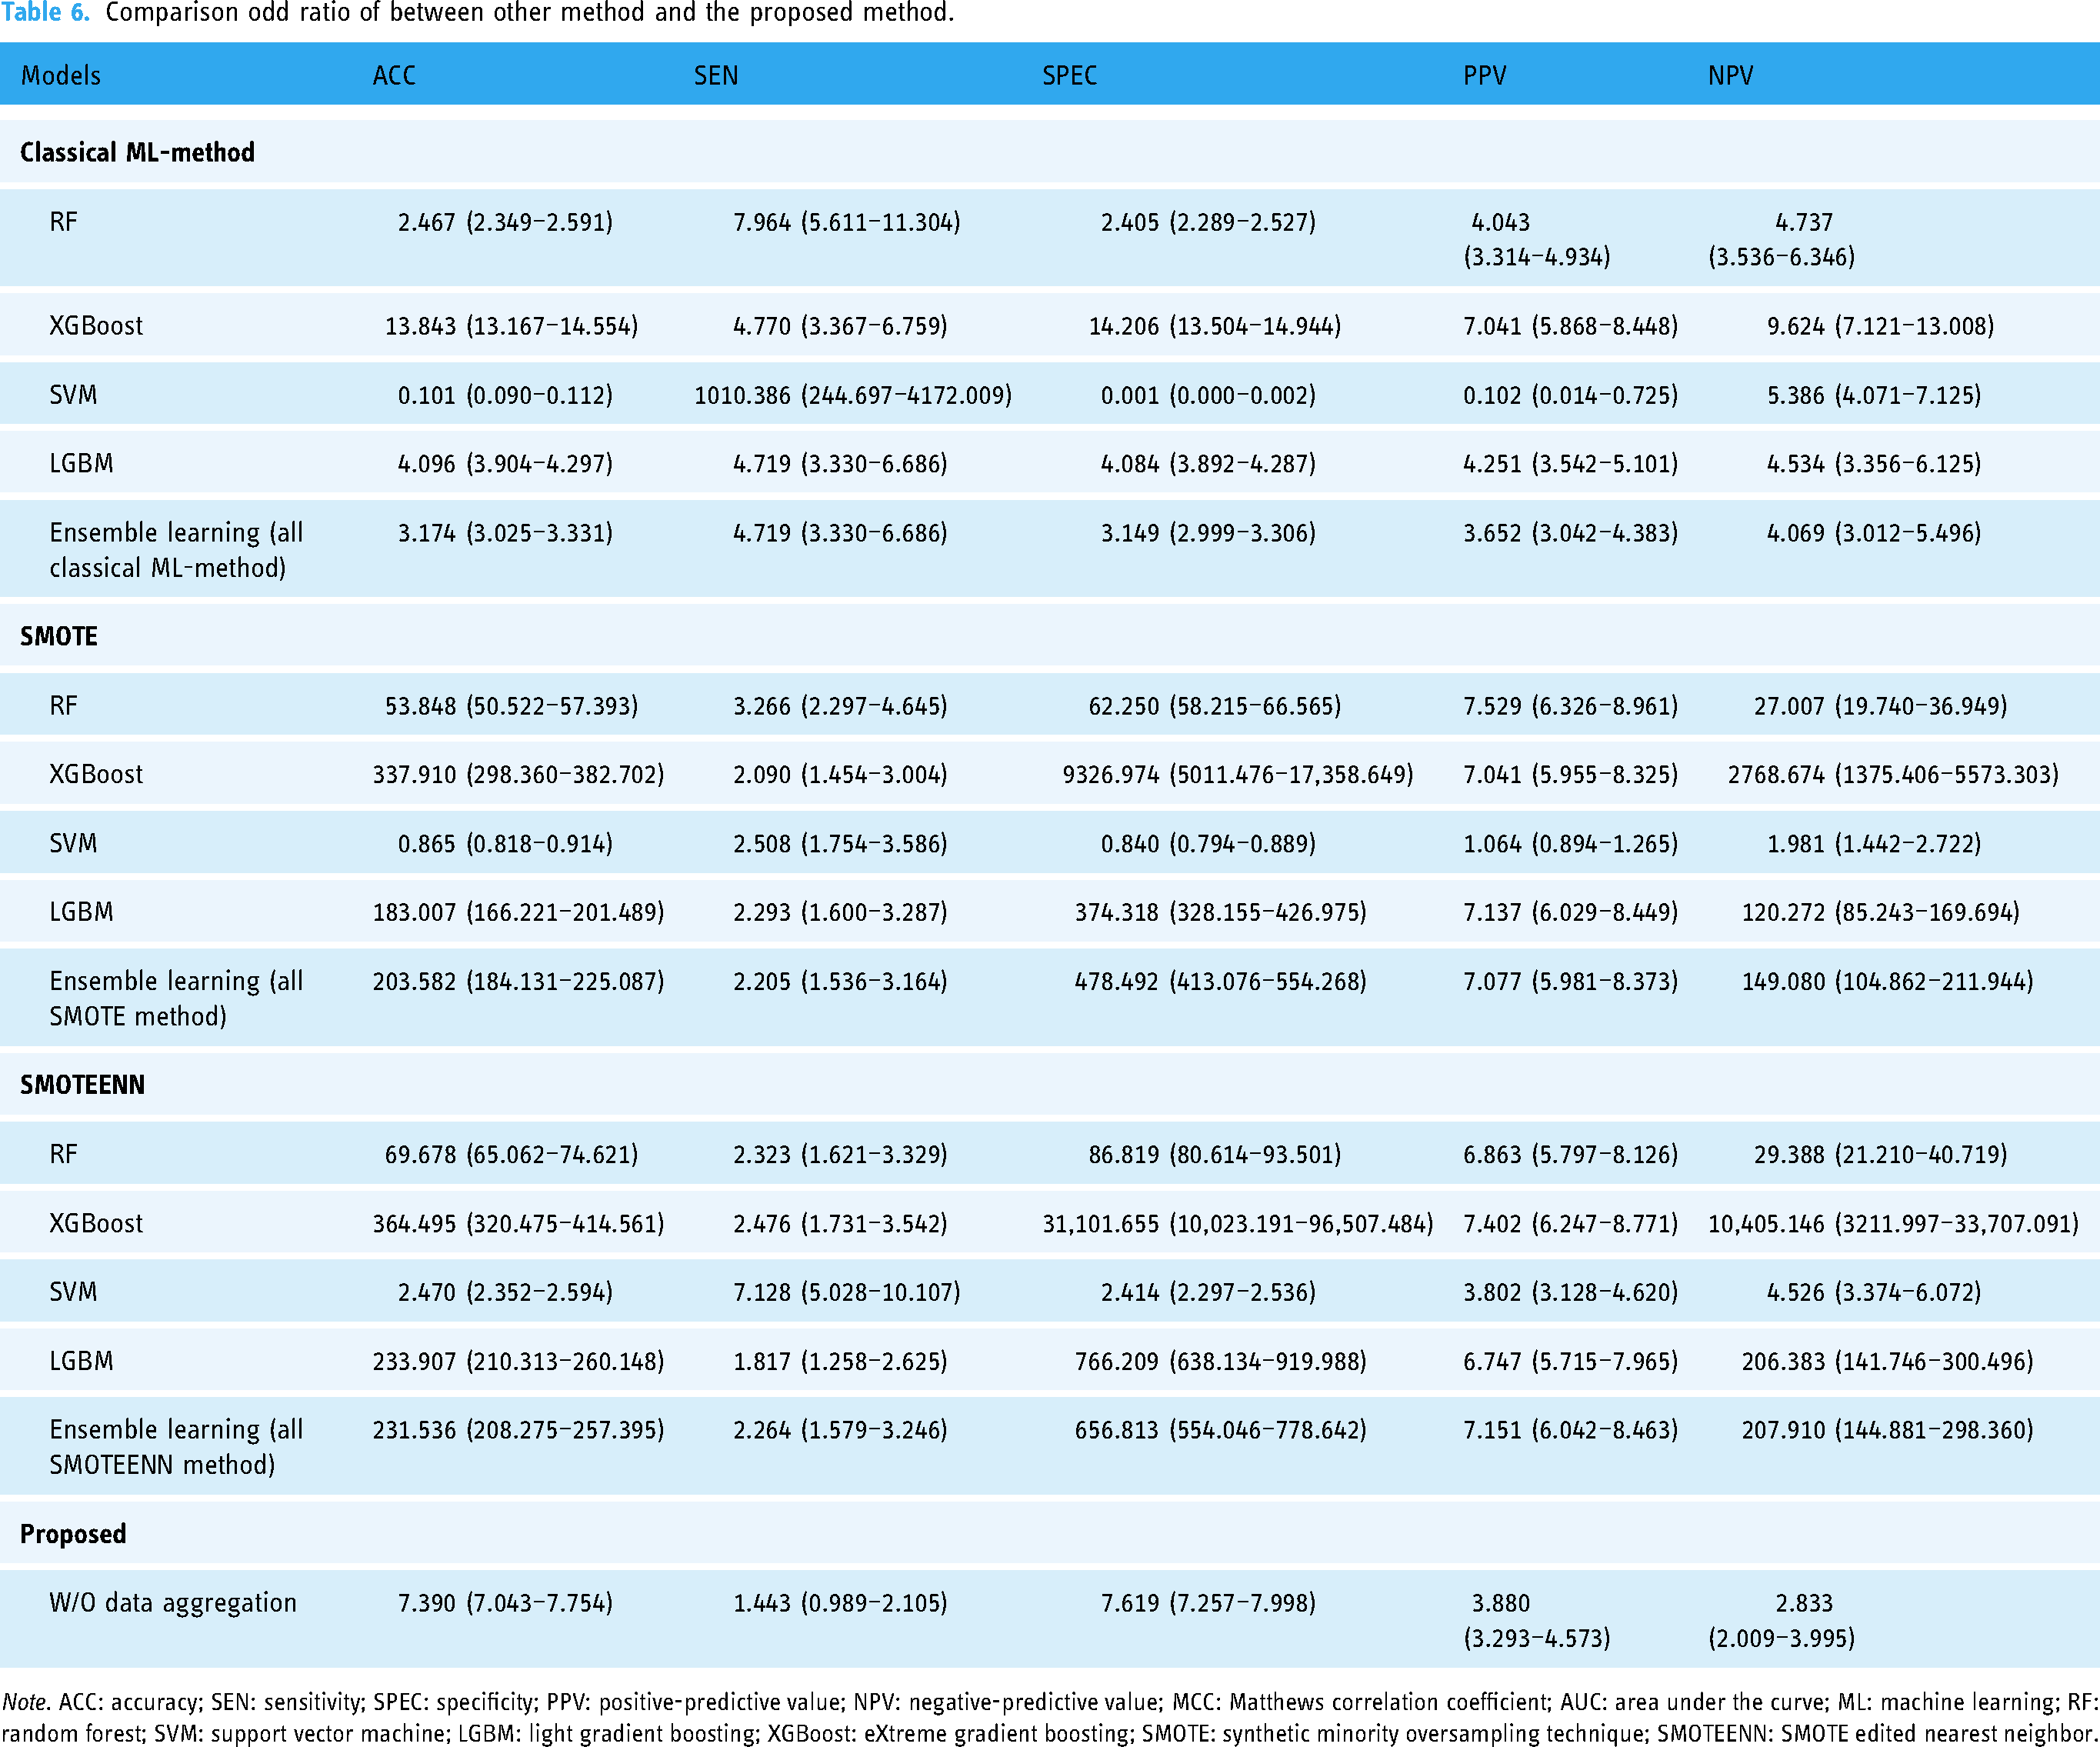
Note. ACC: accuracy; SEN: sensitivity; SPEC: specificity; PPV: positive-predictive value; NPV: negative-predictive value; MCC: Matthews correlation coefficient; AUC: area under the curve; ML: machine learning; RF: random forest; SVM: support vector machine; LGBM: light gradient boosting; XGBoost: eXtreme gradient boosting; SMOTE: synthetic minority oversampling technique; SMOTEENN: SMOTE edited nearest neighbor.
Comparison of the p-value between the other method and the proposed method performance.
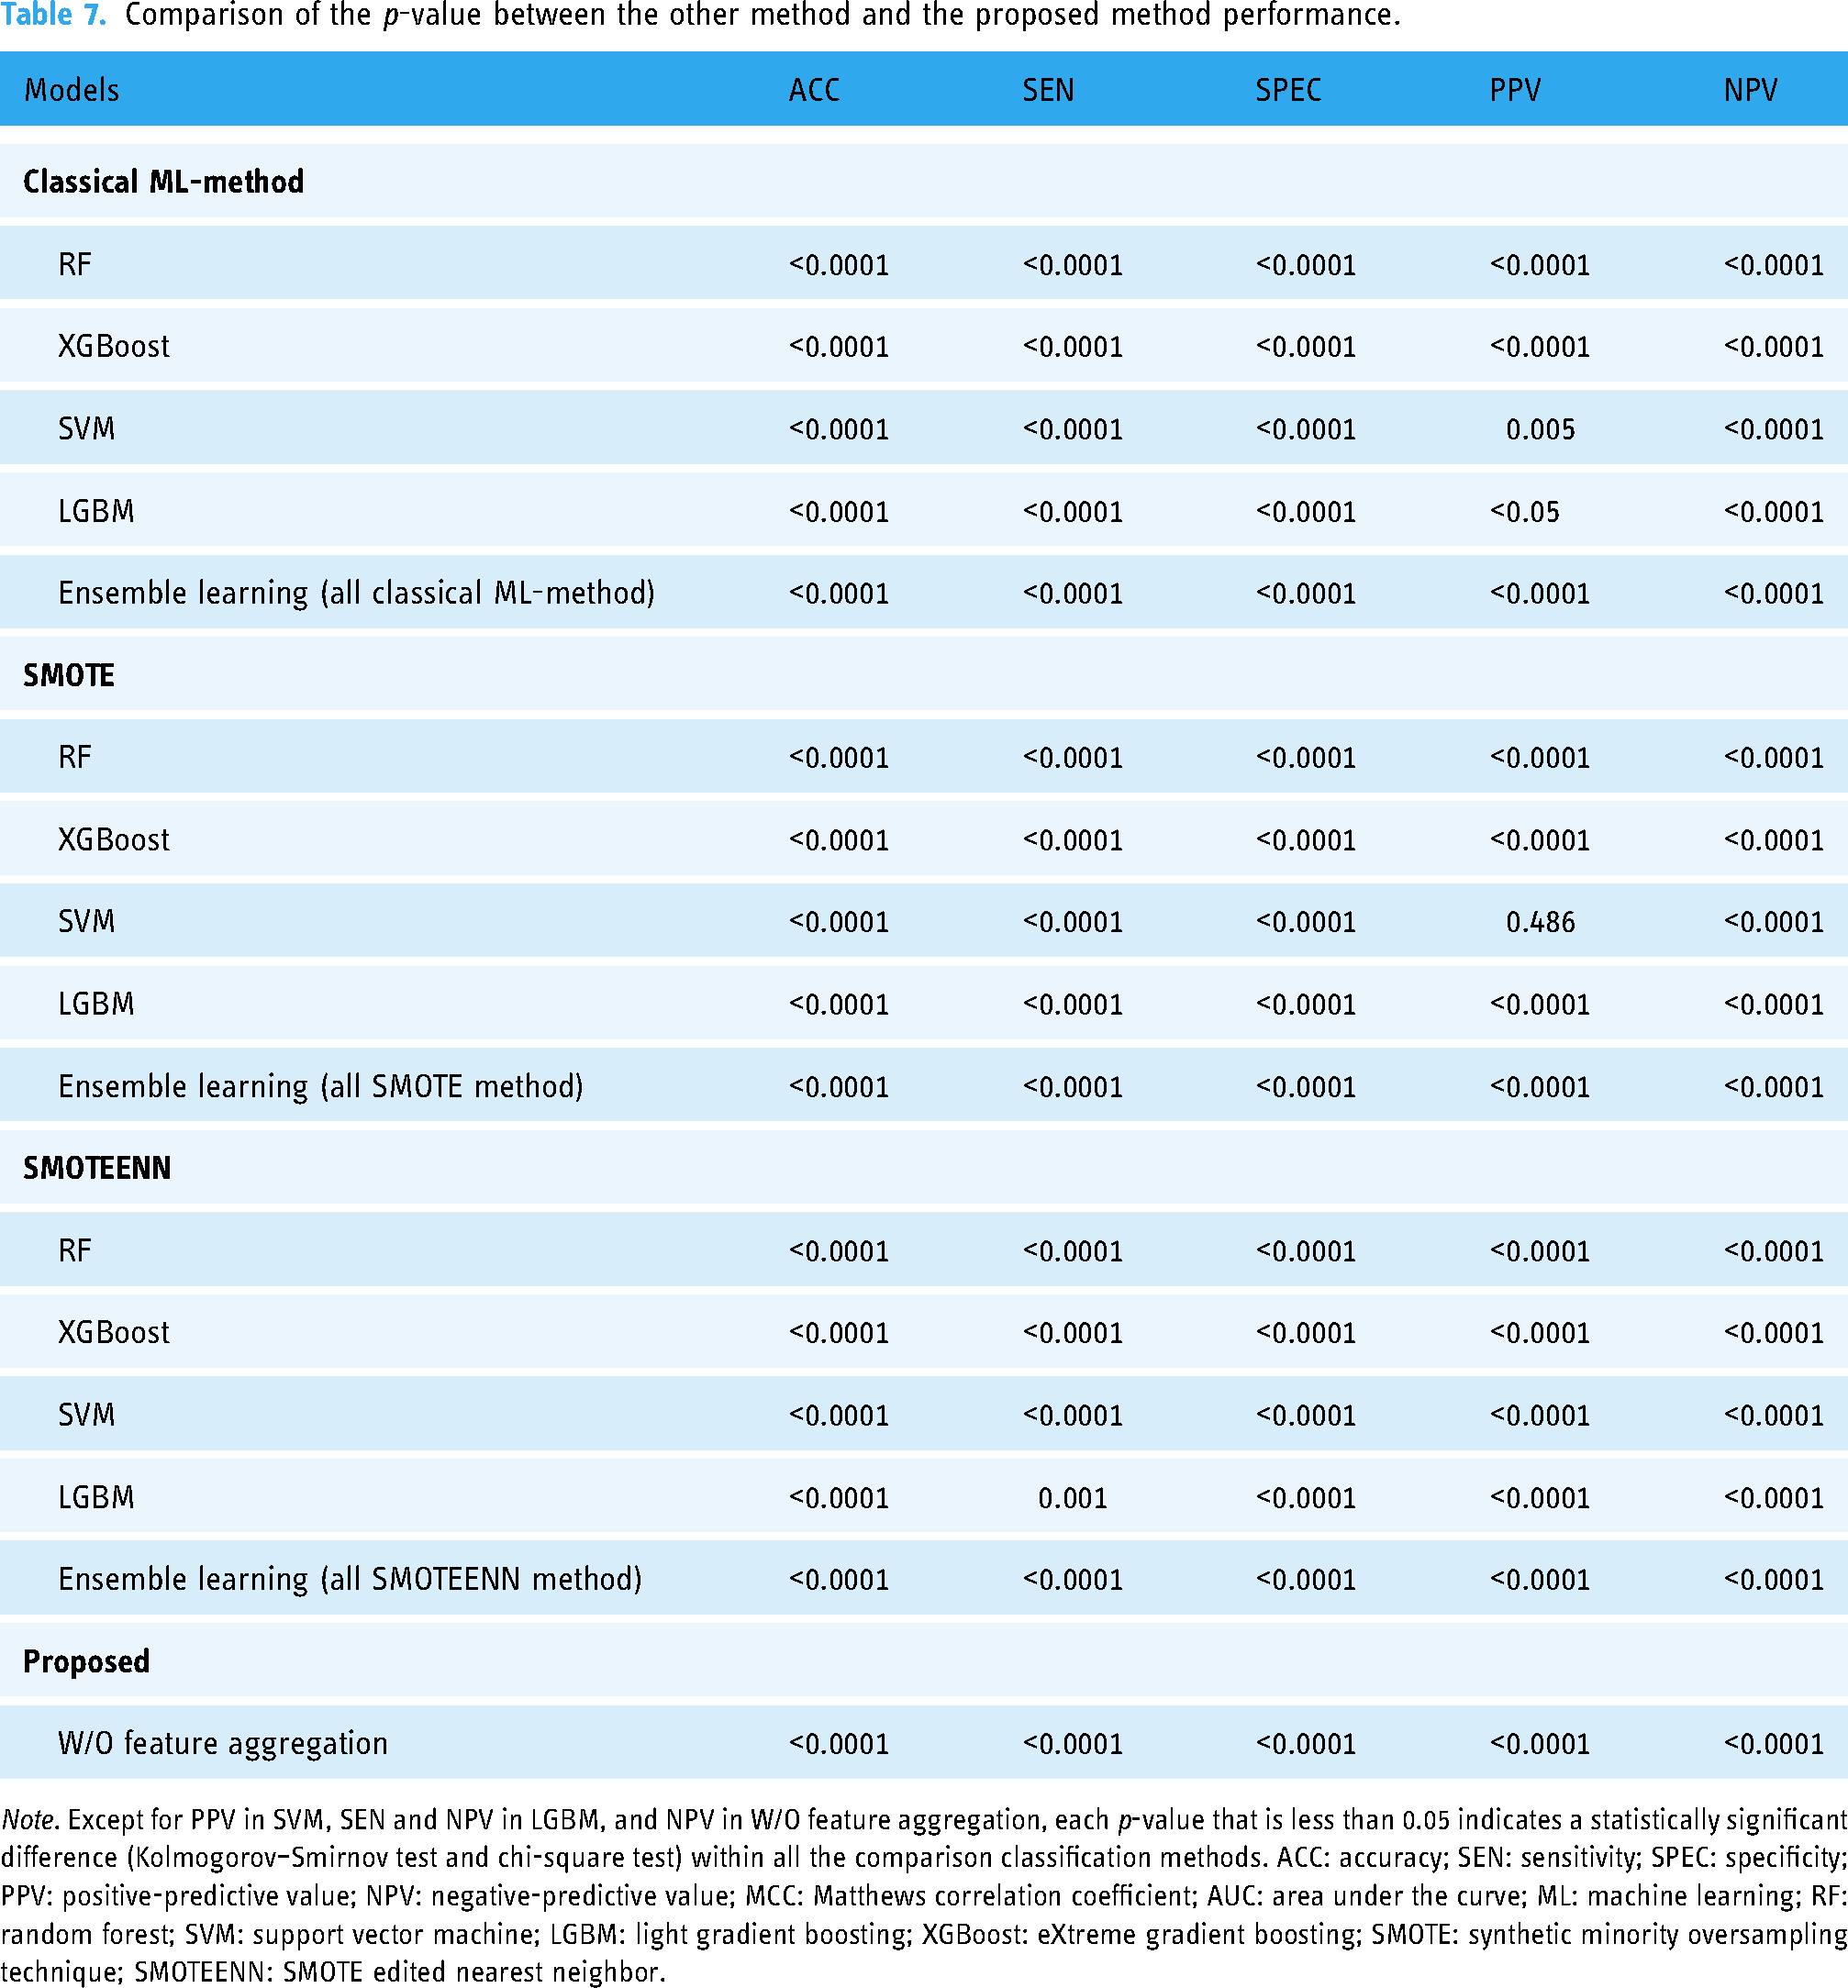
Note. Except for PPV in SVM, SEN and NPV in LGBM, and NPV in W/O feature aggregation, each p-value that is less than 0.05 indicates a statistically significant difference (Kolmogorov–Smirnov test and chi-square test) within all the comparison classification methods. ACC: accuracy; SEN: sensitivity; SPEC: specificity; PPV: positive-predictive value; NPV: negative-predictive value; MCC: Matthews correlation coefficient; AUC: area under the curve; ML: machine learning; RF: random forest; SVM: support vector machine; LGBM: light gradient boosting; XGBoost: eXtreme gradient boosting; SMOTE: synthetic minority oversampling technique; SMOTEENN: SMOTE edited nearest neighbor.
Figure 4 exhibits the results of two pair features ranking with Gini index by using the proposed method and RFE feature selection stage. Figure 4(a) shows the result of the RFE feature selection stage and Figure 4(b) shows the result by executing the proposed method. To demonstrate the effectiveness and interpretability in the clinical relationship of significant features, the SHapley Additive exPlanations (SHAP) algorithm is used in revealing each feature contribution to an individual prediction. All features were ranked depending on their importance for the classification in decreasing order.32,33 Figure 5 provides beeswarm plot to exhibit an overview of the effects of individual features on the prediction of PI risk.

Results of features ranking with Gini index by using the proposed method: (a) the result of the recursive feature elimination (RFE) feature selection stage and (b) the result by executing the proposed method.
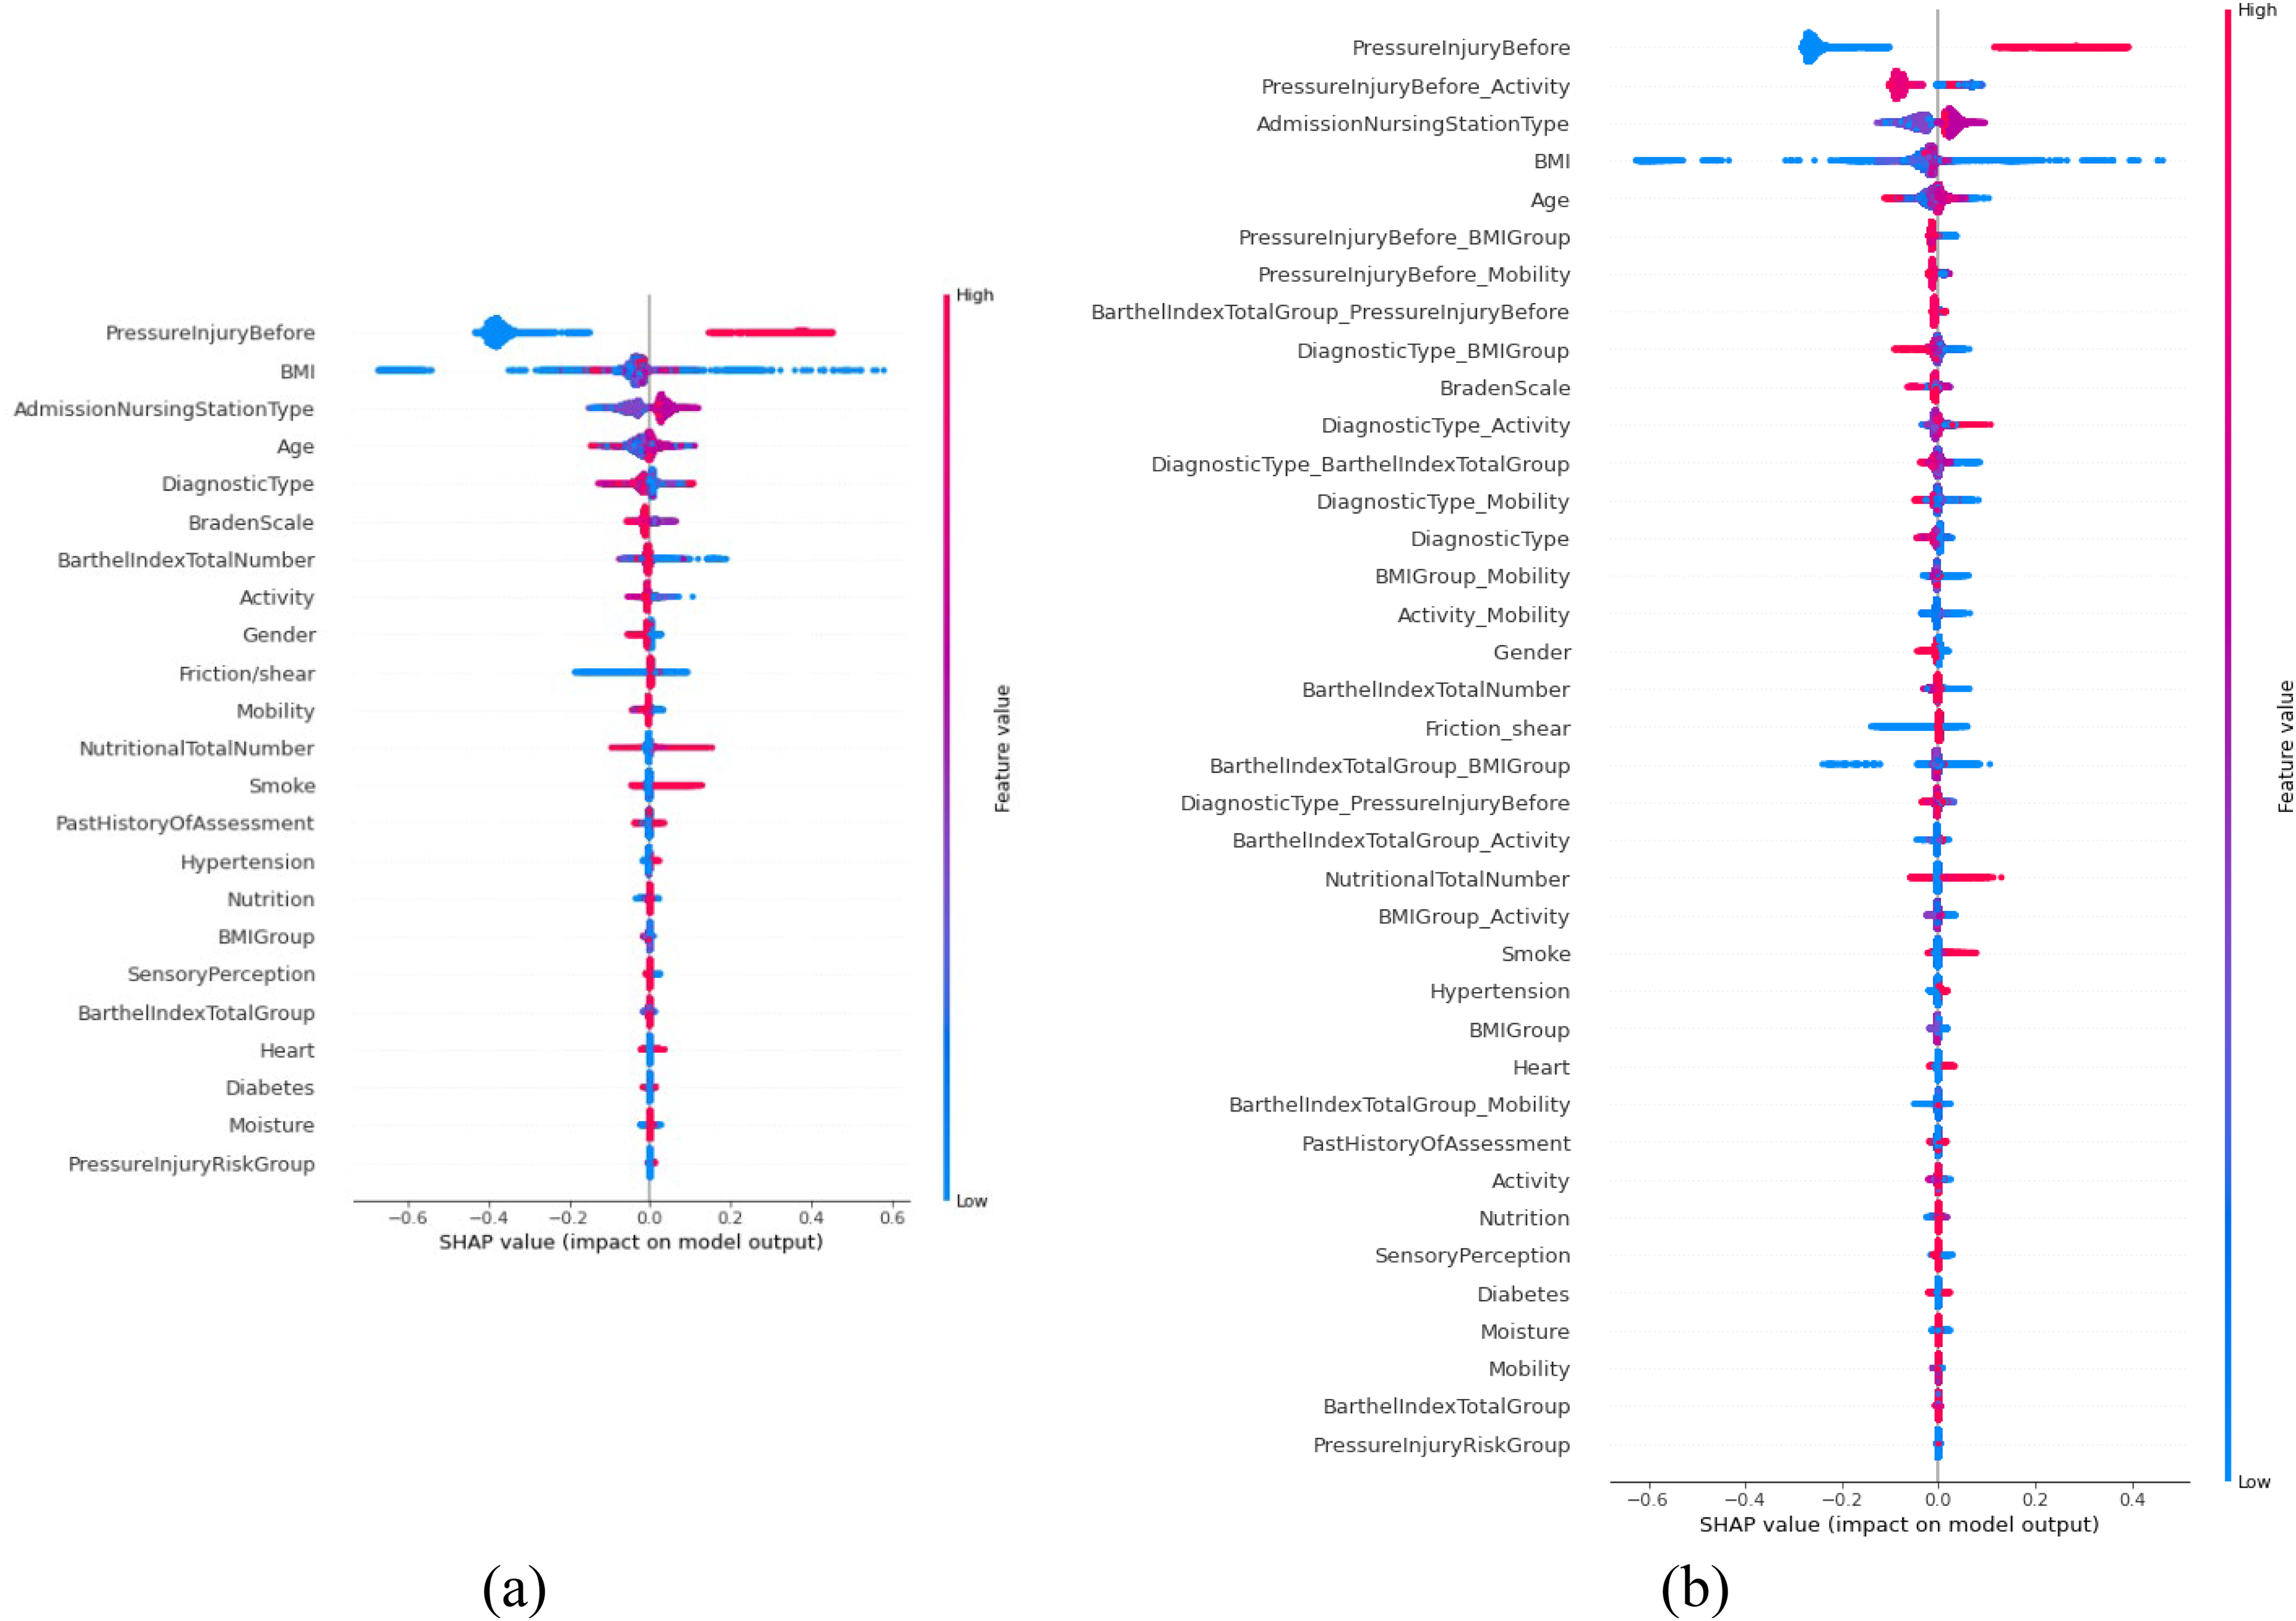
Feature analysis: (a) the result of the recursive feature elimination (RFE) feature selection stage and (b) the result by executing the proposed method.
All the features on the left side of the beeswarm plot indicate to exert a negative effect on PI; on the other hand, features on the right side of the beeswarm plot indicate to exert a positive effect on PI. In the beeswarm plot, all dots represent the SHAP values of each feature for all individual patients, whereas the colors range from blue (low feature value) to red (high feature value). The blue dots are negatively correlated with PI, whereas red dots are positively correlated with PI for all features on the right side. Figure 5(a) shows the result of the RFE feature selection stage and Figure 5(b) shows the result by executing the proposed method.
Discussion
Early detection of hospitalized patients at risk for PI was an essential step that led to future earlier discussions regarding patient goals of nursing care and clinical treatments procedures, accordingly improving clinical outcomes. 34 Therefore, a reliable approach that can early identify and alarm risk of PI will effectively advance nursing care quality and control healthcare resources utilization for clinical units. 35 The prediction model that was developed based on the ML architecture has been proven to be robust in clinical medicine analysis. 36 However, for the prediction of clinical state, the reduction of false prediction was critical factors affecting the model performance. Hence, we developed an effective risk assessment method that combined ML-based and feature aggregation for predicting occurrence PI in admission patients. Our results indicated that the proposed method exhibit high discrimination performance, with ACC, SEN, SPEC, Precision, Recall, PPV, NPV, MCC, F1-score, and AUC being 83.44, 84.59, 83.42, 54.44, 84.01, 9.24, 99.63, 24.56, 53.73, and 0.838, respectively. This indicates that the proposed ML method has the potential for clinical implementation and prediction of PI risk in admission patients. Furthermore, such a method is less complex to develop and is simply to be implanted in the clinical units. Generally, most ML methods had inherent defects and were rarely applied in the prediction of imbalanced datasets. Besides, it could severely interfere with the model performance to result in overfitting.37,38 In previous research, the sampling method was adapted for solving modeling within an imbalanced dataset.39,40 However, the sampling method could lead to a rise in miss predictions. Hence, the proposed method used class weights to reduce model overfitting. The result indicated the RF with class weights algorithm performed total performance better than other comparison methods (Table 5). In addition, the results demonstrated that our proposed approach, integrating feature aggregation with expert-defined features and automated selection, achieved a more balanced predictive performance compared to conventional methods. Although the method exhibited improved accuracy, sensitivity, and specificity, its PPV remained relatively modest, indicating a need for further refinement to reduce false positives. In Table 5, the proposed method demonstrated a relatively low PPV (9.24%) and a high NPV (99.63%). A low PPV indicates that a number of predicted high-risk patients may be false positives, creating additional demands on clinical resources and potentially causing unnecessary interventions. In contrast, a high NPV suggests that most patients classified as low risk are indeed unlikely to develop PIs, helping to avoid missed diagnoses. In clinical decision-making, a priority to reduce false negatives or missed cases enhances the importance of a high NPV. However, when PPV is low, the frequency of false alarms may lead to resource inefficiencies or undue anxiety among patients. Under those circumstances, adjusting the model parameters or employing a secondary evaluation step could mitigate the impact of false positives.
Nevertheless, this improved balance in performance suggests that the proposed strategy holds promise for supporting clinicians in the early identification and management of high-risk patients, ultimately contributing to better patient outcomes. Moreover, the results showed the effectiveness of the feature aggregation with our proposed method. The performance of the RF ML method with feature aggregation was better than that of the method without feature aggregation. This indicates that the proposed feature aggregation improved the classification performance. There are two major reasons for this performance improvement: the first is that the feature aggregation improves between informative features more the correlation and could enable the model to use suitable association features during the training stage. Another is that the miss prediction of positive cases is reduced to classify the imbalanced data successfully. This showed that the RF ML method, as a basic prediction model for the proposed model, significantly enhances the classification performance, which is of great interest.
For the clinical feature interpretability, we visually illustrated our proposed method with RFE feature selection by plotting rank of feature by using Gini index (Figures 3 and 4). Our model indicated that the top five significant discrete numerical features were BartheIindexTotalGroup, Activity, BMIGroup, Mobility, and DiagnosticType, respectively.
The single clinically significant feature, PIs before, served as a fundamental indicator of a patient's prior susceptibility to PI. Building upon this, the proposed feature aggregation approach identified the top five discrete features BarthelIndexTotalGroup, Activity, BMIGroup, Mobility, and DiagnosticType each reflecting different facets of a patient's functional status, body composition, and clinical profile. While DiagnosticType is not traditionally considered a direct PI assessment factor, previous studies have suggested its association with PI occurrence. 16 By incorporating these features through probability aggregation, the method was able to reveal how their combined interactions contribute to PI risk. As illustrated in Figure 4, the resulting combination features provided enhanced insight into underlying risk associations. Notably, PressureInjuryBefore_BMIGroup exhibited a particularly high contribution to PI risk, underscoring how a patient's prior history of PI interacts with their body mass index (BMI) status. Similar patterns emerged from other combination features, such as PressureInjuryBefore_BarthelIndexTotalGroup, PressureInjuryBefore_Mobility, and DiagnosticType_BMIGroup. The consistency in feature importance, observed through both the Gini index and SHAP analyses (Figures 4 and 5), validated the robustness and interpretability of these integrated features. From a clinical perspective, feature aggregation offers a more intuitive and actionable representation of complex data interactions. By providing probability-driven visualizations or dashboards that highlight how these combination features shape a patient's PI risk, clinicians can more readily identify individuals requiring closer monitoring or preventive measures. In this way, the approach not only refines the predictive model's accuracy but also transforms data-driven insights into tangible strategies for improving patient outcomes.
In addition to the clinically significant feature of PIs before, the integration of BMI, Braden Scale, and Barthel index is relevant for guiding clinical decision-making. Each variable addresses a distinct yet interrelated dimension of patient status. BMI indicates nutritional status and body composition, the Braden Scale encompasses skin integrity, moisture, and mobility, and the Barthel index measures functional independence in daily tasks. These variables are integral to identifying patients at elevated risk of PIs. When aggregated, PressureInjuryBefore_BMIGroup emerges as an influential combined factor, suggesting that prior PI history and body composition together may increase susceptibility to future PIs. Recognizing this joint effect can inform resource allocation and targeted preventive measures for high-risk patients. Identifying the synergy among BMIGroup, BarthelIndexTotalGroup, Activity, Mobility, and DiagnosticType further clarifies how multiple factors concurrently influence PI risk. Integrating these combined indicators into clinical systems may improve predictive accuracy and enable timely preventive actions, contributing to better patient outcomes.
Although the proposed method displayed outstanding performance, it still had some drawbacks and challenges. First, only structured data were used for this study; besides, patient comorbidity, acuity, and values of laboratory tests were not considered, which may be associated with the risk factors in our developed prediction method. Furthermore, the integration of multi-dimensional data that includes narrative nursing notes, individual habits, environmental factors, and image reports is suggested to improve the accuracy of the prediction method. Advanced analytics methods, including natural language processing, can extract context not evident through conventional numeric variables, while environmental measurements may clarify how room conditions affect PI development. However, this approach involves several practical obstacles. Ensuring compatible data formats across different systems is important for consistent information exchange, safeguarding patient confidentiality and following institutional regulations requires meticulous oversight, and establishing a technical infrastructure capable of handling large, diverse datasets necessitates significant computational resources and expertise. Moreover, clinical staff may require training to interpret and act on the insights produced by these additional sources. Addressing these considerations in future research could lead to a more comprehensive framework that seamlessly integrates both structured and unstructured data in routine clinical practice.
The feature engineering process also has limitations, such as the potential challenges in capturing complex feature interactions and the risk of overfitting. We used RFE for feature selection, which systematically ranks and removes less relevant features while retaining the most informative ones. However, RFE also has limitations, including sensitivity to the dataset and the potential for overfitting when the dataset size is limited. This limitation might have led to less robust features and increased the risk of overfitting, especially when dealing with a limited dataset size. Second, we used a dataset extracted from a single medical center. Although the results may be useful for local patients, the method may not be generalizable to other healthcare systems, as performance may vary due to different population characteristics and clinical practices. Multi-healthcare system validation is required to optimize the predictive performance of the proposed method, ensuring its applicability across different healthcare settings. Third, integrating this method into clinical workflows presents several challenges, such as ensuring interoperability with existing EHR systems and maintaining real-time data processing capabilities. Moreover, clinical staff training and workflow adaptation would be necessary to maximize the effectiveness of the model in everyday clinical practice. Extending the model to different healthcare institutions requires additional validation and potential adaptations to account for variations in patient populations, healthcare resources, and information system infrastructures. Conducting multi-center studies may help assess the model's robustness across diverse clinical settings and guide parameter adjustments to accommodate data from facilities of varying sizes and regions. Such efforts can involve techniques designed to handle heterogeneous data, including model calibration or transfer learning, which allow the model to maintain predictive performance despite differences in patient demographics and clinical practices. By confirming the model's stability in multiple contexts, a broader implementation in routine clinical workflows may become feasible.
Finally, we only used an RF ML model for constructing the prediction model. Compared with more complex deep learning (DL) models, our ML-based method is relatively simple. Our future work suggests the establishment of a DL model for predicting PIs, which would enable the use of both structured and unstructured data, such as narrative notes and imaging data. Multi-center validation and incorporating unstructured data will help create a more robust and generalizable predictive system. The proposed feature aggregation method could provide effective correlation information between different features of the DL network, which can be useful for improving and modifying our prediction architecture. Compared with a more complex DL model, our ML-based method is relatively simple. Our future work suggests the establishment of a DL model for predicting PIs to train the clinical predictive system and create a unified DL network. The proposed feature aggregation method could provide effective correlation information between different feature for the DL network which can be useful for improving and modifying our prediction architecture.
Conclusion
In this study, a ML-based method was proposed for the predicting risk of PI. The performance of the proposed method was good in evaluating the risk with PI in patients. The proposed feature aggregation was critical in predicting risk of PI because feature aggregation could reduce false prediction in positive cases and make the higher predicting ability. Hence, our method provides risk predictions to assist clinical nursing staff in developing or adjusting care guidelines. Furthermore, the key contributions of this study lie in the integration of expert knowledge, automated feature selection, and feature aggregation, enabling improved predictive accuracy. However, several limitations, such as the reliance on the available dataset and the need for further validation in diverse clinical settings, remain and highlight areas for future improvement. In conclusion, the proposed method provides an objective and effective prediction performance that accounts for correlation with different key features and can help clinical care team tailor their treatment of patients in PI.
Footnotes
Acknowledgments
We wish to thank all the members of the Department of Nursing, Changhua Christian Hospital, and acknowledge their contributions to data collection and management.
Author contributions
Conceptualization: Shu-Chen Chang, Mei-Wen Wu, and Shu-Mei Lai; methodology: Chiao-Min Chen and Shu-Mei Lai; data collection: Shu-Mei Lai and Mei-Wen Wu; data management: Shou-Chuan Sun and Mei-Chu Chen; writing – original draft preparation: Chiao-Min Chen; writing – review and editing: Chiao-Min Chen; supervision and the published version of the manuscript: Chiao-Min Chen.
Availability of data and materials
The data can be made available upon reasonable request from the corresponding author.
Declaration of conflicting interests
The authors declared no potential conflicts of interest with respect to the research, authorship, and/or publication of this article.
Ethics approval
This study was approved by the Institutional Review Board of the Changhua Christian Hospital (CCH) and granted a waiver of informed consent (protocol code no: 200721).
Funding
The authors received no financial support for the research, authorship, and/or publication of this article.
Guarantor
Chiao-Min Chen.