
Abstract
Objective
This paper aims to address the need for real-time malaria disease detection that integrates a faster prediction model with a robust underlying network. The study first proposes a 5G network-based healthcare system and then develops an automated malaria detection model capable of providing an accurate diagnosis, particularly in areas with limited diagnostic resources.
Methods
The proposed system leverages a deep learning-based YOLOv5x algorithm to detect malaria parasites in thick and thin blood smear samples. The YOLOv5x network architecture was modified by introducing two squeeze-and-excitation network (SENet) layers just before the Upsample layers. The system is designed to operate over 5G networks efficiently, enabling remote and smart healthcare solutions.
Results
The modified YOLOv5x model demonstrated improved accuracy and precision in detecting malaria parasites on microscopic slides. The inclusion of SENet layers optimized the network’s performance, making it suitable for real-time disease detection over a 5G network.
Conclusion
Our model exemplifies how a generic one-stage object detection algorithm, such as YOLOv5x, can be repurposed to detect objects as small as malaria parasites from microscopic visuals in a cost-effective manner over the 5G network. By integrating the computational efficiency of deep learning with the connectivity of 5G networks, this system can significantly enhance remote diagnostic capabilities and contribute to smart healthcare solutions.
Keywords
Introduction
In recent years, technological advancements in computer vision have revolutionized the way we perceive and communicate with everything around us. Among the numerous applications of computer vision, object detection, and classification stand out as essential techniques with far-reaching consequences, especially in the medical field. In essence, it is an indispensable tool in the modern healthcare domain, providing unparalleled insights into the intricacies of the human anatomy, pathological processes, and therapeutic responses. Furthermore, in fields such as pathology, the utilization of object detection and classification techniques aids in the analysis and interpretation of cellular and tissue samples. These technologies facilitate the diagnostic process by automating the identification and classification of various cell kinds, structures, and patterns; as a result, diseases like infectious disorders, cancer, autoimmune problems, and malaria diagnosis.
Malaria is a life-threatening disease caused mainly by species of Plasmodium such as P falciparum, P vivax, P ovale, P knowlesi, and P malariae. Out of these parasites, P falciparum infects the majority of the global population, followed by P vivax. The most affected areas of the globe by this parasite are Africa, Southeast Asia, and the Eastern Mediterranean. A detailed study on its causes and effects is found in Tangpukdee et al. 1 Even though malaria is curable, it is estimated that over 500 million people are infected with the disease each year, resulting in over half a million deaths, 90% of which are children. 2
A microscopic visual inspection of stained thick and thin blood smear slides is considered one of the pioneering approaches for the laboratory diagnosis of malaria worldwide. The thick blood smear slides are typically utilized to accomplish a negative or positive result, whereas thin smears are used to determine the species of malaria infection. However, microscopic detection is not only time-consuming but also confined to the expertise of the trained personnel to infer accurate results, and this dependency on the expertise level of testing personnel leads to erroneous diagnoses on different occasions, which can be attributed to human error. To avoid such human errors and provide accurate diagnosis results for malaria disease, a computer-aided diagnostic method can be helpful for faster and more effective results. Image processing has proven to be an alternative measure for the identification of malaria parasites, providing moderately effective results compared to traditional microscopic inspections. The mechanism involved in image processing techniques uses image segmentation to process images, which can have significant computing costs and limited performance under certain environmental conditions. 3 However, the results obtained from image processing techniques can further be fine tuned using artificial intelligence (AI)-based approaches.
AI methods, from machine learning to deep learning, are widely used in healthcare for patient risk assessment, medication discovery, and disease detection. Conventional machine learning algorithms were shown to yield qualitative and faster results over methods that used image segmentation techniques. Despite the effectiveness of machine learning algorithms, the inconsistency of images captured in various situations introduces a significant number of variables in the learning process, which is in some instances insufficient for a suitable detection methodology in our point of concern. 3 With the advancements in processing power, applications of computer vision models for tasks such as categorization and analysis of visual data are becoming more and more common. Furthermore, both these AI-based approaches and computer vision models require faster networks that can provide high-quality data transmission, which is essential for the development of intelligent systems.
Recent breakthroughs in the field of computer vision coupled with deep learning algorithms have shown promising results due to their potential to overcome the constraints of both standard image processing approaches and traditional machine learning strategies. 4 When it comes to object detection, convolutional neural networks (CNNs) are the most favorable architecture adopted for deep learning. CNN is an efficient model for exploring and analyzing medical images, such as medical image detection and recognition, image segmentation, image registration, image reconstruction, etc. An in-depth application of deep learning in medical image processing is thoroughly discussed in Khan et al. 5 One significant benefit of CNNs stems from their ability to automatically extract visual features from marked or annotated images without the need for human intervention. The system then learns adaptively while the network trains on numerous representations of a single object, each captured under diverse environmental circumstances. Another key aspect is that deep convolutional networks tend to be very versatile and possess excellent learning features even from unprocessed visual input.
There have been numerous studies on malaria diagnosis using CNN-based models.6–12 The transfer learning strategy based on pre-trained CNN models like VGG19, ResNet50, ResNet34, VGG-16, and MobileNetV2 can also be used to identify and categorize malaria parasites. 10 The challenge with the CNN approach is that the focused object of interest may be located at different spatial positions and can have varying aspect ratios. For example, in some circumstances, the item may cover the majority of the image, while in others, it may only cover a small portion of the image. In a real-life implementation, the uniformity of the shapes of objects cannot be guaranteed. These factors necessitate the use of a large number of regions for CNN methods, which significantly contributes to the increase in computational overhead in these methods. The shortcomings of CNN methods discussed earlier are addressed by object detection methods like region-based CNN (R-CNN), You Only Look Once (YOLO), etc. by improving image occurrences and reducing the computational cost.
Currently, deep learning-based object detection algorithms are broadly classified into two categories: One-stage and two-stage methods. In a two-stage approach, the detection process occurs in two stages: First, region proposals are generated, followed by the classification of these proposals in the second step. Methods such as R-CNN, fast R-CNN, faster R-CNN, 13 etc. are used to illustrate two-stage algorithms. These methods offer comparatively higher detection accuracy, but their deeper network architecture results in low speed, making real-time object detection difficult to achieve. To overcome the limitations of two-stage approaches, researchers developed one-stage algorithms. The regression-based one-stage methods eliminate the need for a proposal generation step and directly determine an object’s position and category information. These methods have significantly faster inference speeds, which makes them well-suited for real-time object recognition and detection. The one-stage approaches are represented by the single shot multiBox detector and YOLO series algorithms.
The work Nakasi et al. 13 employs faster R-CNN for detecting malaria parasites in thick blood smears. Subsequently, Abdurahman et al. 14 uses YOLOV3 and YOLOV4 architecture on this dataset for detecting malaria parasites. The paper Kumar et al. 15 explores a hybrid model combining capsule neural networks and convolutional neural networks for detecting malaria in blood smear images. This model optimized with enhanced image processing techniques, outperforms the traditional DSCN-Net model, demonstrating significant improvements in malaria diagnosis accuracy and efficiency. This study Shewajo and Fante 16 proposes a tile-based method to enhance the detection of malaria parasites in thick smear microscopic images. By dividing high-resolution images into smaller overlapping tiles, this approach improves the accuracy of state-of-the-art (SOTA) object detection models, particularly for detecting small objects like Plasmodium falciparum, while maintaining computational efficiency and real-time processing capabilities. The authors in Thangammal et al. 17 introduce a novel image processing technique combined with a machine learning algorithm to automate the identification and counting of Plasmodium parasites in blood samples, addressing the time-consuming traditional microscopy method. Evaluated on a standard malaria dataset, the algorithm demonstrates strong performance and accuracy in recognizing and categorizing infected cells, despite challenges like mismatched class sizes in patient-level data. The paper 18 developed a novel method utilizing EfficientNet, a deep learning architecture, to detect malaria parasites in blood smear images. Further, it demonstrates that the proposed model achieves a detection accuracy of 97.57%, indicating its potential to enhance diagnostic efficiency in a healthcare environment.
Furthermore, the diagnostic efficiency also needs to ensure timely diagnosis so as to leverage a substantial amount of benefit of the proposed model. Along the same lines, the YOLOv5 Yusro et al., 19 Ji et al., 20 Jaiswal and Agrawal 21 promises to strike a subtle balance between efficiency and timely diagnosis. Although there has been a notion that subsequent models may provide better efficiency, YOLOv5 can still be used as a model of choice because recent works reveal that it outperforms its subsequent variants like YOLOv7 Olorunshola et al. 22 and YOLOv8 Casas et al. 23 Moreover, YOLOv5 requires less memory, and computational time and provides more accurate results when compared to YOLOv7 and YOLOv8. So in this paper, we introduce an effective approach for detecting malaria parasites in thick blood smear and thin blood smear slides. Our proposed model is a modified version of the YOLOv5 model. The primary objective of this study is to develop a high-precision classification method for identifying malaria parasites from blood smear slides.
The rest of the paper is organized as follows: The rest of the paper is organized as follows: The “Method” section describes the conceptual framework based on the 5G network for real-time malaria detection, the proposed modified YOLOv5x model, and the dataset details. The “Results” section is devoted to the training, validation, and testing results, and the “Discussion” section further discusses the findings of the study, and, thereafter, the “Conclusion” section concludes this paper .
Method
5G network-based conceptual framework for real-time detection of malaria parasite
A conceptual framework that is in line with Nguyen et al 24 is presented in Figure 1. The network function virtualization is a core part of the 5G network that facilitates multiple virtual networks to support various kinds of services pertaining to users and industrial needs. The software-defined networking works by separating data and control panels in a 5G network. The blockchain network provides security aspects to the data over the network.

A conceptual framework based on 5G for real-time malaria disease detection in line with. 24
The working procedure that must be followed to detect malaria in real-time remotely is listed below:
The thick smear image or the thin smear image of the blood sample collected from the patient is sent from the device layer to the upper layer. This layer allows multiple images to be sent from multiple devices concurrently. The image is then converted to different blocks using blockchain technology, ensuring its integrity and privacy across the network. The blocks are transmitted through the communication layer to the edge layer, which further processes them. The proposed model for malaria detection resides in the cloud after its training and validation. The incoming images are checked by this model to detect malaria parasites in a real-time manner. If a malaria parasite is detected, the entrusted doctor prescribes the appropriate medical support. The doctor’s advice, along with the images labeled with parasites, are sent back to the device layer.
Modified YOLOv5x model for malaria parasite detection
The proposed model is a modified version of the YOLOv5 architecture (Figure 2). The details of each layer of the YOLOv5 model architecture can be found in Yan et al. 25 The proposed model has two extra squeeze-and-excitation network (SENet) layers compared to the basic YOLOv5 model architecture. As SENet enables the network to execute dynamic channel-by-channel feature recalibration, 26 the idea behind embedding SENet in the YOLOv5 model is to increase its accuracy while operating over small parts of an image to detect the malaria parasite. However, determining the number of such layers, as well as their placements, so that these layers enhance the features, is a significant challenge. In the proposed model, two SENets are placed just before the Upsampling layers. The intuitive reasoning is that they are capable of combating any sort of data loss during the upsampling process. To further justify their usage, a basic overview of the workings of SENets is discussed in the next paragraph. The workings of the concatenate layer (Figure 3) are discussed below.

Network architecture of the existing YOLOv5 model (on the left side)and proposed model i.e. modified YOLOv5x model (on the right side).

Working of concatenate layer.
A concatenate layer concatenates its inputs along a predefined dimension. The direction in which concatenation is performed is termed the concatenation dimension. The concatenation operation is successful if the inputs have the same dimensions except for the concatenation dimension. The operation is further explained by using the following block diagram: The inputs in the preceding block diagram have equal dimensions (100 The squeeze operation uses global average pooling to compress the feature maps of each channel to a single numeric value. A fully connected layer with a ReLU activation unit first provides non-linearity and then performs dimensionality reduction. The second fully connected layer and a sigmoid unit provide a smooth gating function for each channel. The excitation operation weighs each feature map of the convolutional block.

Architectural model of squeeze-and-excitation networks (SENets).
Dataset
The proposed model is applied to two different kinds of images: Thick smear images and thin smear images. While thick smear images are concerned with the presence of the malaria parasite, its stages can be identified by thin smear images.
The thick smear dataset contains a total of 84,961 annotated parasites collected from 150 patients, which was retried from https://lhncbc.nlm.nih.gov/LHC-research/LHC-projects/image-processing/malaria-datasheet.html. The radius of each parasite varies from 2 to 96 pixels, with an average radius of 22 pixels. There are one to 341 parasites in each image, with an average number of 47 parasites. Each patient set contains three to 22 images with an average number of 12 images and contains eight to 3,130 parasites with an average number of 522 parasites.
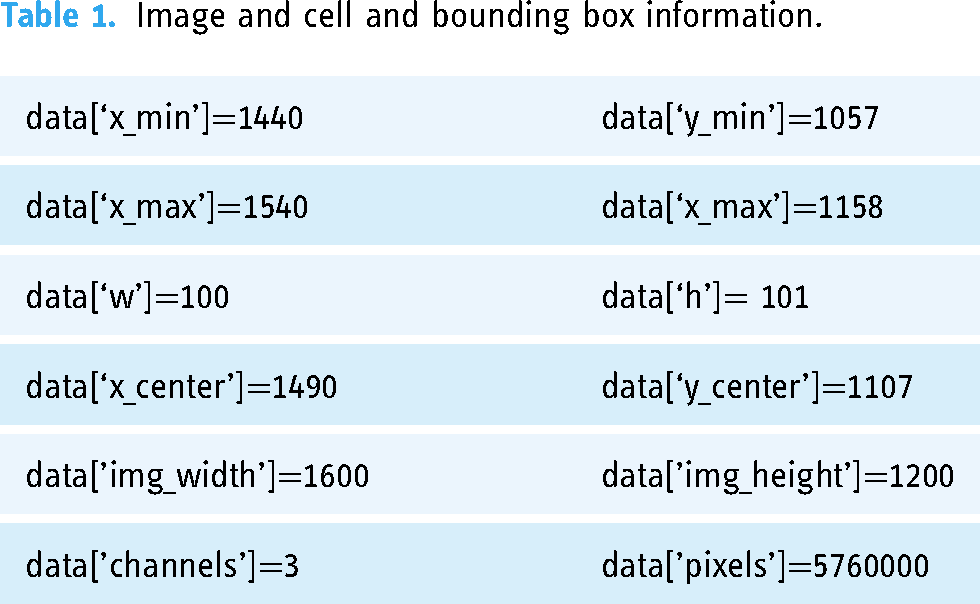
The thin smear dataset contains 1364 thin blood smear images (80,000 cells), which are a combination of uninfected and infected blood cells. 27 The uninfected cells are divided into two types: RBCs and leukocytes. The infected cells are categorized into four different types: gametocytes, rings, trophozoites, and schizonts. The cells that are difficult to classify are marked as difficult. Each cell is provided with a class label and bounding box. The dataset also includes two files, i.e., training.json and test.json, which contain image details and cell and bounding box information (Table 1).
Image and cell and bounding box information.
Data preprocessing
The thick smear dataset contains the text file which can be extracted for drawing the bounding boxes for parasitic cells. The input image and the output image with labeled bounding boxes are shown in Figures 5 and 6 respectively.
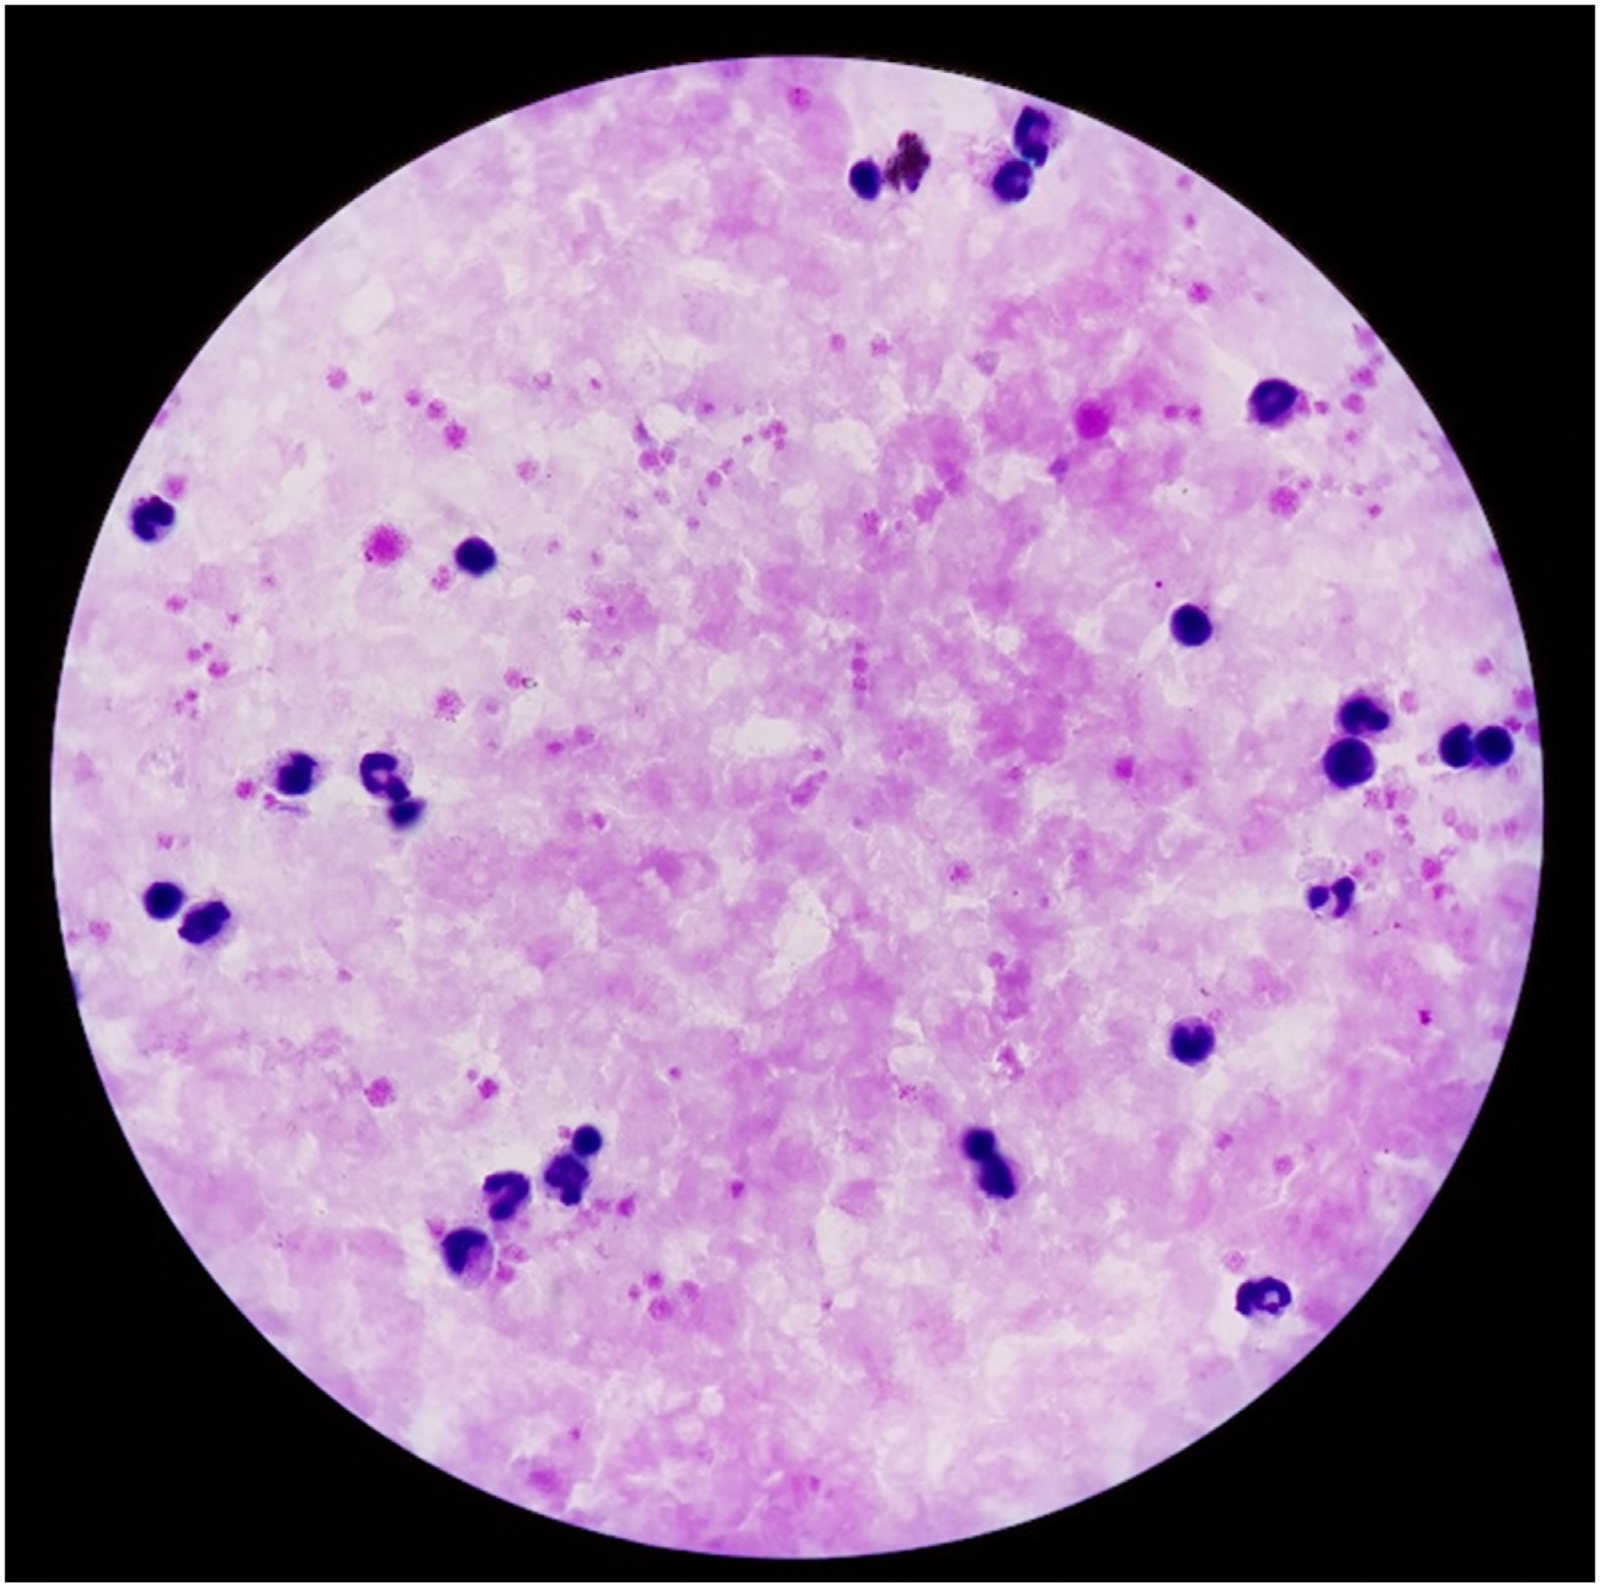
Input thick smear image.

Output image with bounding box.
In the case of thin smear dataset, the data preprocessing entails reading image details as well as the dimension of the bounding box along with its labels from two files, i.e., training.json and test.json. The preprocessing task is implemented using the algorithm 1.
Data preprocessing(training.json, test.json)
TR=Read training.json
TT=Read test.json
Temp_data=concatenate(TR,TT)
The columns of Temp_data are ‘images’ and ‘objects’
Use Temp_data[‘image’] to extract ‘checksum’, ‘pathname’, and ‘shape’
Use Temp_data[‘objects’] to extract ‘Bounding_box’ and ‘category’
From ‘bounding_box’ extract ‘minimum’ and ‘maximum’
From ‘minimum’ extract ‘x_min’ and ‘y_min’
From ‘maximum’ extract ‘x_max’ and ‘y_max’
Create a table data with columns [’pathname’, ’shape’, ’checksum’, ’category’, ’x_min’, ’y_min’, ’x_max’, ’y_max’]
Append the following columns to the data to find the dimension of the bounding box
Data[‘w’]=data[‘x_max’]-data[‘x_min’]
Data[‘h’]=data[‘y_max’]-data[‘y_min’]
Data[‘x_center’]= data[‘x_min’]+ Data[‘w’]/2
Data[‘y_center’]= data[‘y_min’]+ Data[‘h’]/2
Drop [‘shape’] from data and append the following columns to find the dimension of the image
’img_height’,’img_width’, ’channels’
Add column [‘No_pixels’] to the data
Data[‘No_pixels’]= data[’img_height’] x_data[’img_width’] x_data[’channels’]
The columns of data are
data[’pathname’, ’checksum’, ’category’, ’x_min’, ’y_min’, ’x_max’, ’y_max’, ’w’, ’h’, ’x_center’, ’y_center’, ’img_width’, ’img_height’, ’channels’, ’pixels’]
return data
An a part of data processing it is important to draw the bounding boxes for the images. Each cell of the image is provided by a bounding box and label. This flowchart (Figure 7) is created to accomplish the task of drawing and labeling bounding boxes of thin smear images (Figures 8 and 9).

Flowchart for labeling bounding boxes of images.

Input thin smear image.

The output image showing the bounding boxes and labels.
Processing the category variable is an important to ensure that each category has a clear meaning, the difficult category is referred to as Unclear throughout the rest of the paper. The thin blood smear slide dataset contains the different categories along with their number which has been presented in Table 2.
Cells.

Results
The simulation is carried out in Google Colab, which includes a GPU-enabled environment. The performance of the proposed model is evaluated using the following metrics:
Performance metrics
The performance of the model is evaluated in terms of the following metrics:
Precision - The precision of a model can be defined as its ability to return only relevant instances. Recall - Recall is the ability of a model to find all the relevant cases within a dataset. Mean average precision (mAP) - Average precision (AP) is the average accuracy rate and mAP is the average accuracy of the mean. The mAP is calculated by summing the AP values of each category and then dividing by the total number of categories. Its formula is Intersection over Union (IoU) and GIoU - IoU is a measure of the quality of the predicted box. If A is the ground truth box with coordinates Prediction= positive, if As a result, the metric mAP@0.5 defines any box with GIoU - Generalized intersection over union (GIoU) is defined as
28
: Thus, the loss function has no value when Objectness and its loss - Objectness is a measure of the predictor that determines how well the predicted box covers the cells. The objectness loss trains the predictor to predict a correct IoU. The objectness value ranges from 0 to 1. An objectness value of 0 indicates that the cell is outside the predicted box, whereas a value of 1 indicates that the predicted box entirely covers the cell. Any value in between, such as 0.5, implies that the cell is covered by the predicted box by 50%. Classification and its loss - Classification loss indicates how effectively an algorithm can determine the correct class of any given object. The minimum and maximum values for classification loss range from 0 to 1.
To calculate the loss, YOLO computes the sum-squared error between the predictions and the ground truth. YOLO generates a total loss function from individual loss functions such as GIoU (Generalized Intersection over Union), objectness, and classification losses. These can be properly designed to improve the target of mean average precision.
Training and validation on thick smear dataset
The modified YOLOv5x model is trained and validated on 120 patients with 1443 images and 72,184 parasites with a split of 3:1. The models are tested on 30 patients including 375 images and 12,777 parasites. The performances of the proposed model during training and validation are shown in Figure 10. Further, its performance is compared against that of YOLOv5x. This comparison clearly indicates that the modified YOLOv5x model outperforms YOLOv5x in each of the performance metrics mentioned earlier.

Performance comparison of YOLOv5x and proposed i.e modified version of YOLOv5x model during training and validation on thick smear dataset.
Training and validation on thin smear dataset
The modified YOLOv5x model and the Yolov5x are trained on a total of 1036 images and validated on another 164 images. The models are tested on 164 images. The models’ performance during training and validation are depicted in Figure 11.

Performance comparison of YOLOv5x and proposed i.e modified version of YOLOv5x model during training and validation on thin smear dataset.
A comparison of mAP values obtained from YOLOv5x and YOLOv5x_mod is shown in Figure 12. The findings presented in Figures 11 and 12 illustrate that the proposed model has a high degree of accuracy in detecting malaria parasites. In addition, the parental model, YOLOv5, produces impressive outcomes. The behavior of these models is mostly determined by how well the labels are extracted for each cell and how well the bounding boxes are judged. This, in turn, offers a solid foundation for our data preprocessing strategies.

Comparison of mAP of YOLOv5x and YOLOv5x_mod.
The proposed model is an improved version of YOLOv5x that records 6% more precision and recall values (Table 3) than its parent model. The proposed model’s mAP values show an impressive 7% gain (Table 3 and Figure 12).
Performance metrics comparison.
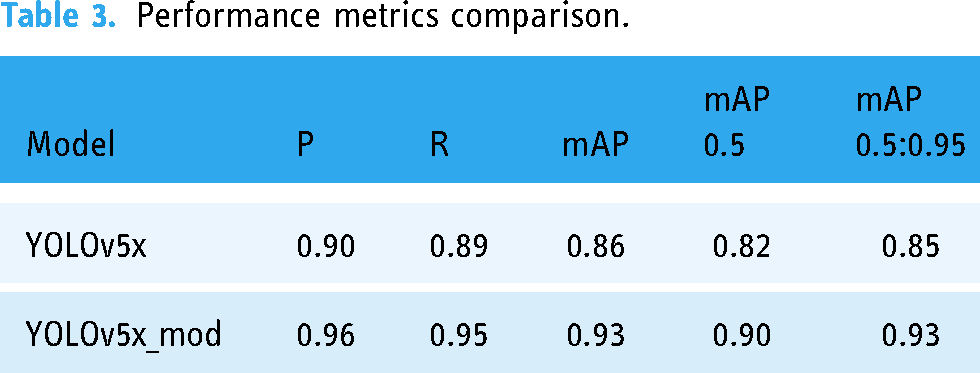
The class-wise comparison between the performance of YOLOv5x and YOLOv5x_mod is presented in Table 4. The performance metrics included in this comparison are precision, recall, mAP@0.5, and mAP@0.5:0.95.
Class-wise comparison between the performance of YOLOv5x and YOLOv5x_mod.

Testing of the proposed model on thick smear dataset and thin smear dataset
The proposed model is tested on the earlier mentioned test datasets of thick smear and thin smear images and the normalized confusion matrices are shown in Figures 13 and 14. Further, the malaria parasite detection at the image level is shown in Figure 15, and at the patient level is presented in Figures 15 to 17 (these three images belong to one patient). Similarly, the results presented in Figures 18 to 20 depict the particular detection of its type.

Normalized confusion matrix of the model on test data (thick smear).

Normalized confusion matrix of the model on test data (thin smear).
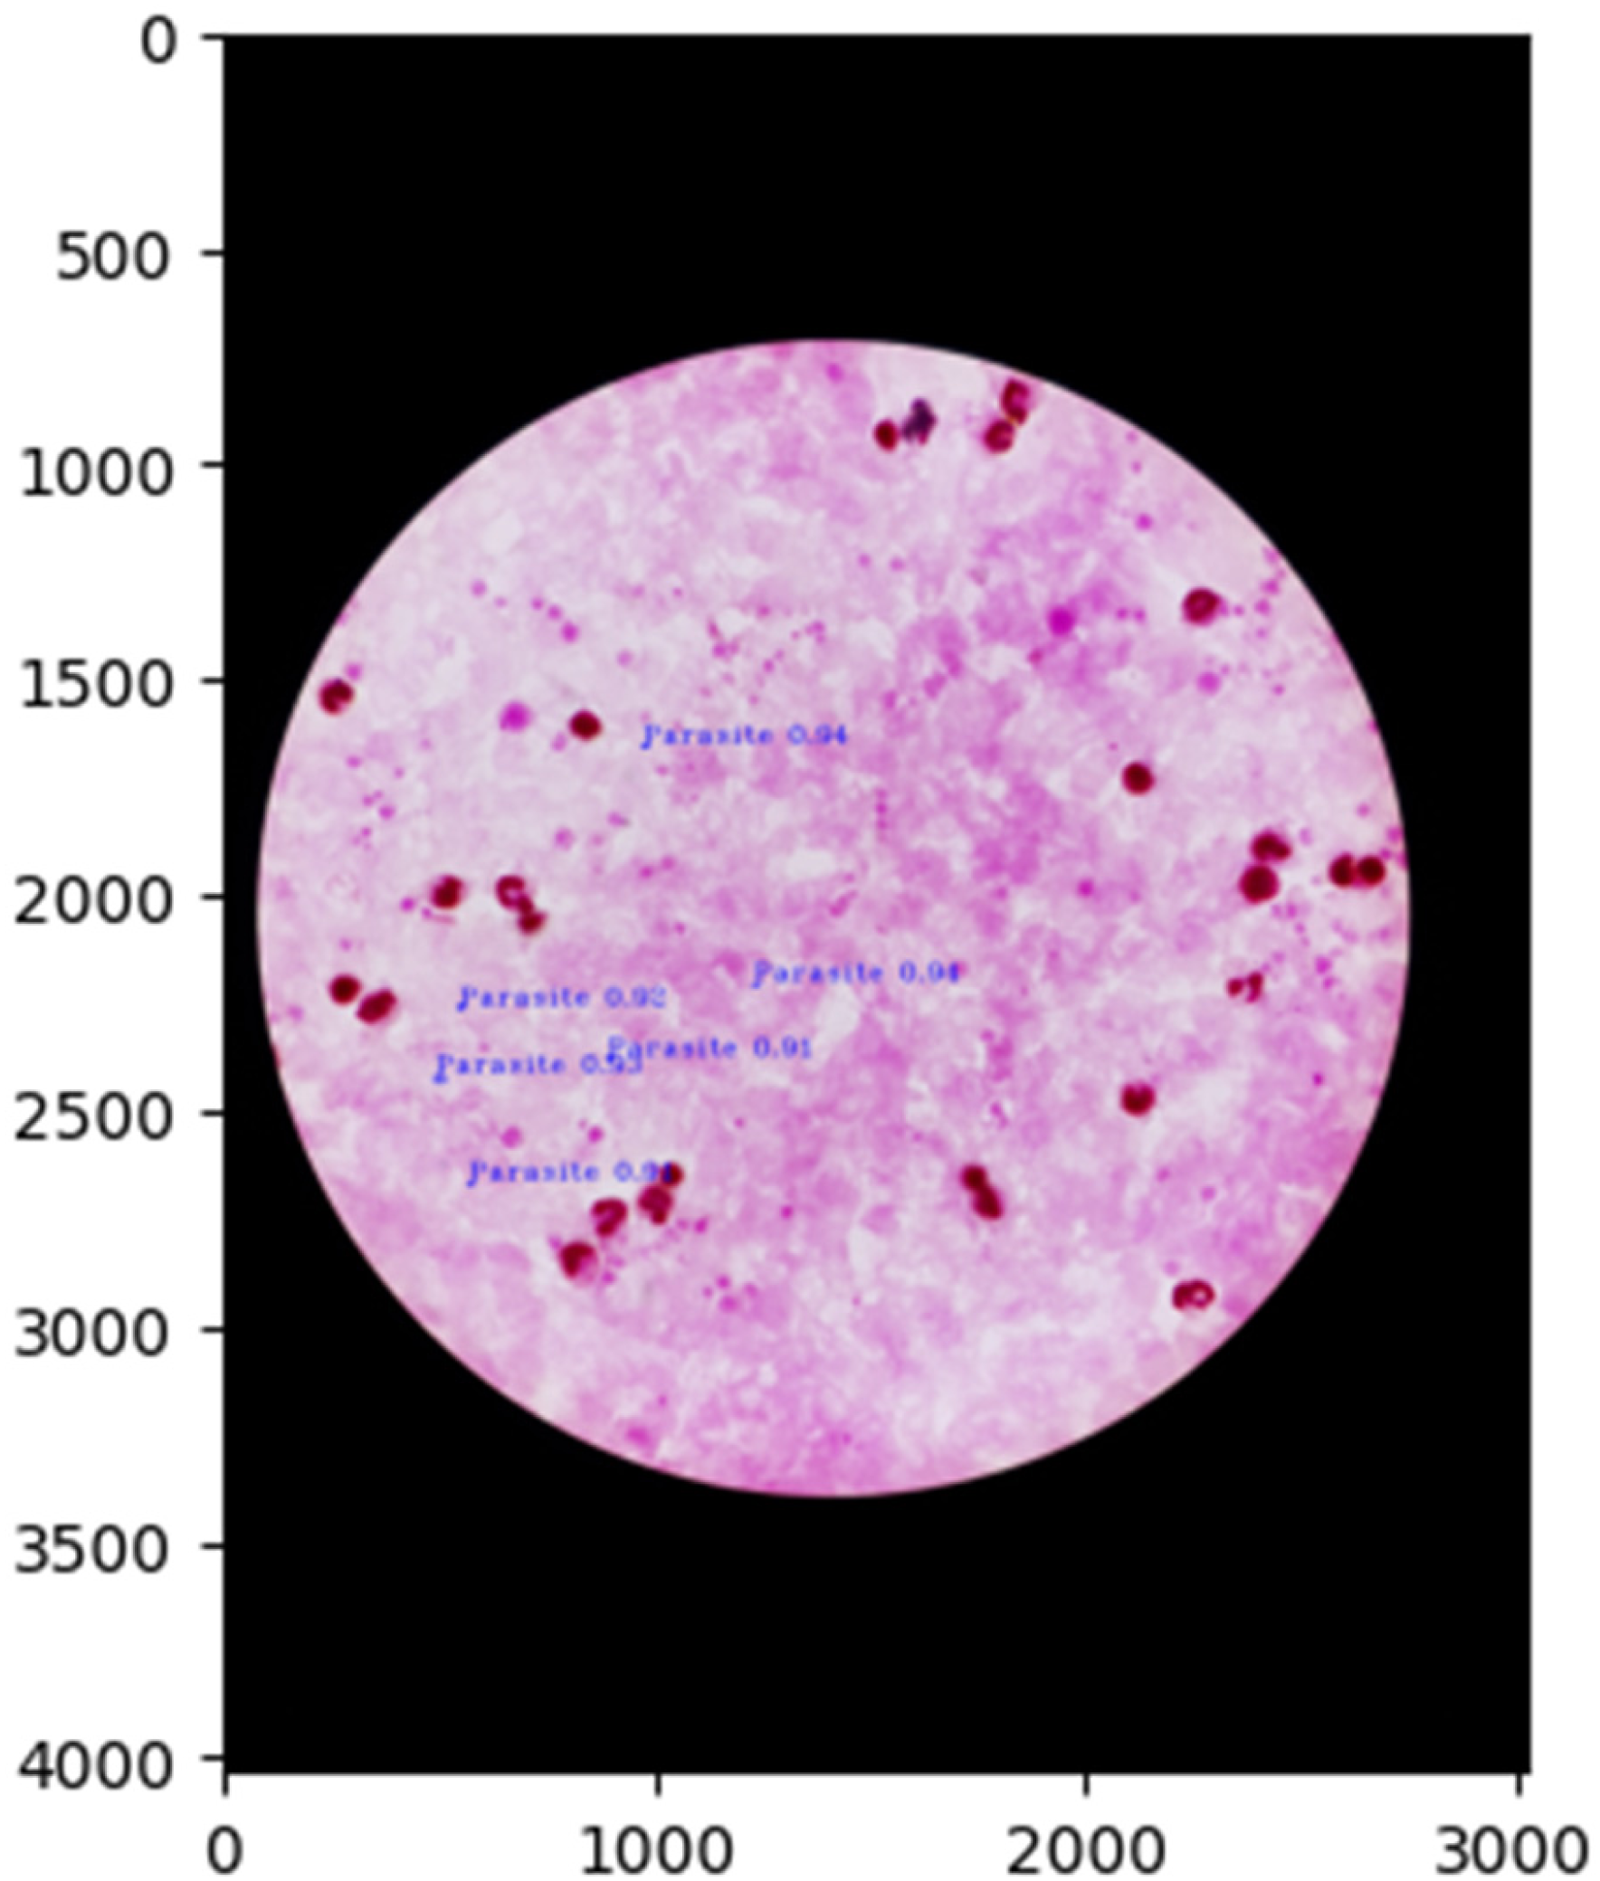
Malaria parasites detection at image-level (first image of the patient).

Malaria parasites detection at image-level (second image of the patient).
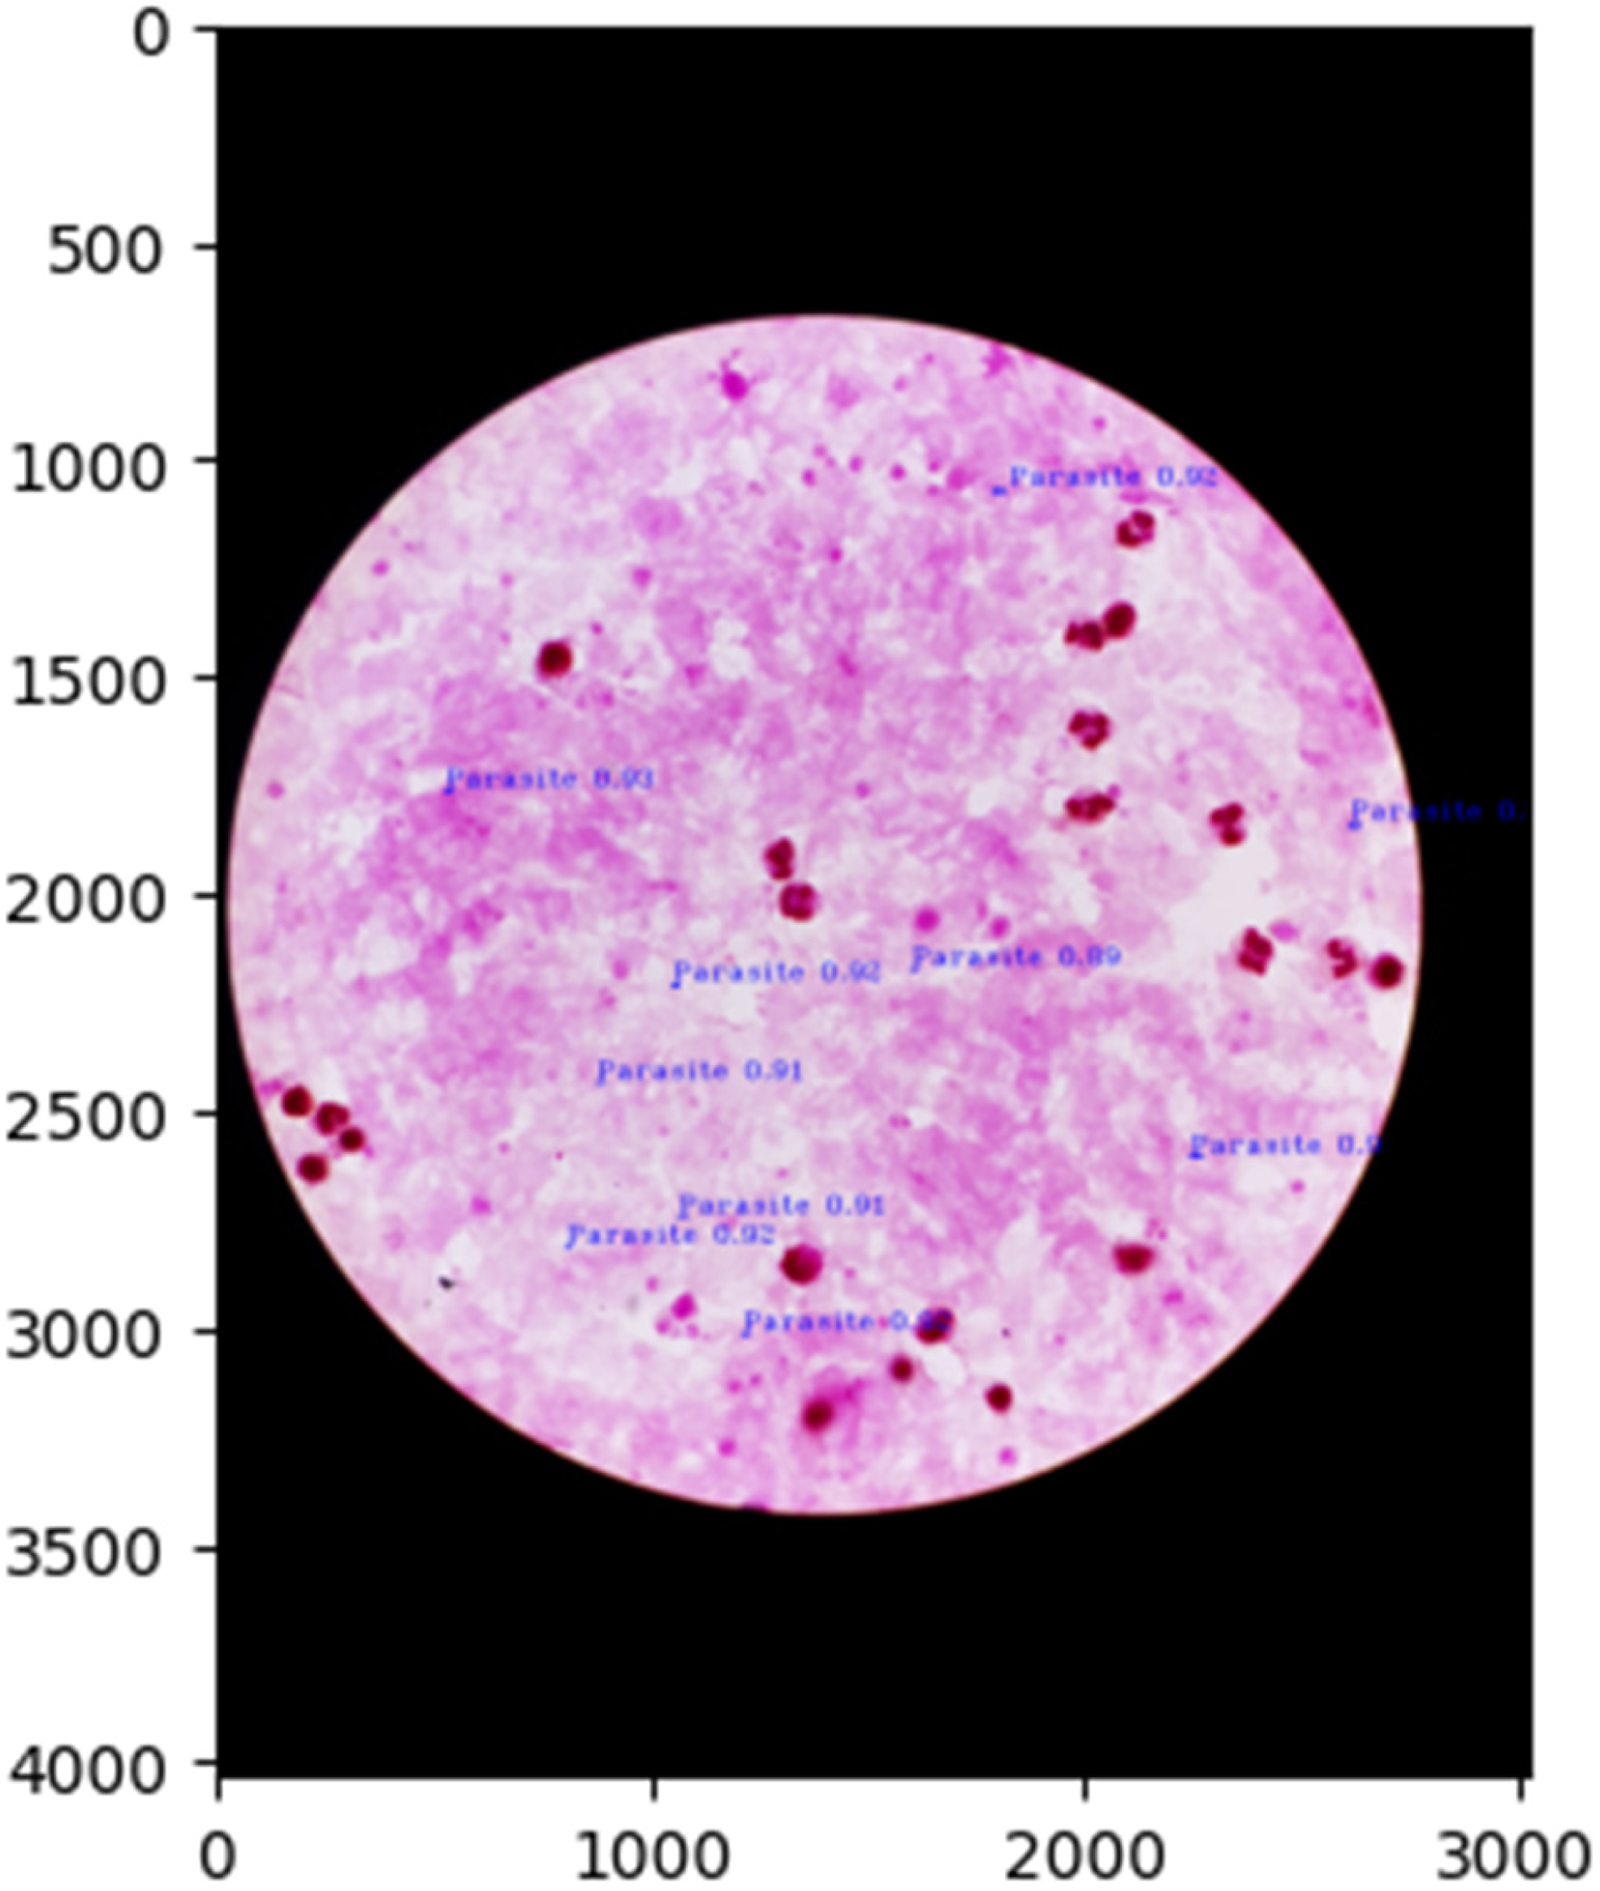
Malaria parasites detection at image-level (third image of the patient).

Output image with identification of Trophozoites with an accuracy of 0.88 and Unclear with an accuracy of 0.85.

Output image with identification of Trophozoites with an accuracy of 0.9 and Ring with an accuracy of 0.88.

Output image with identification of Trophozoites with an accuracy of 0.9 and Gametocyte with an accuracy of 0.9.
Discussion
The findings of this study demonstrate the modified YOLOv5x model’s efficacy in detecting malaria parasites in thick and thin blood smear images due to the incorporation of the Squeeze-and-Excitation (SENet) layer into its architecture (Figure 2). This model shows a significant improvement in mean average precision (mAP), recall, and precision when compared to the baseline YOLOv5x (Figures 10, 11 and Table 3). Specifically, the modified model achieves a 6% increase in precision and recall and a 7% gain in mAP values (Table 4). These enhancements are validated through rigorous training and testing across both datasets, with normalized confusion matrices and patient-level detections corroborating the resilience of the proposed approach.
The algorithm not only accurately detects the presence of parasites in large smear datasets (Figures 15 and 16), but also indicates parasite stages in thin smear datasets (Figures 17 to 19). The class-wise comparison reveals steady gains in performance in every category, including gametocytes, trophozoites, and red blood cells (Table 4). The observed improvements are due to robust data preprocessing and the ability of SENet layers to automatically learn and emphasize the most relevant features of different channels. Furthermore, the incorporation of the model into a 5G-based real-time diagnostic system offers scalability for remote healthcare applications
Overall, the proposed modifications ensure improved diagnostic accuracy, reduced dependency on manual expertise, and timely detection capabilities. This research develops the framework for effectively deploying AI-powered, network-integrated solutions to combat malaria, particularly in resource-constrained environments. However, the data set in this study mainly comprises samples of P. vivax, and although we expect that similar results could be achieved for other species of malaria parasites, in some future research this hypothesis should be tested.
Conclusion
As the conventional manual microscopic investigation of malaria disease is reliant on the abilities and expertise of a microscopist, the lack of availability of such competent microscopists in developing countries has inspired researchers to develop a computerized diagnosis approach. This study creates a prototype for a low-cost alternative and a complementary solution to real-time malaria diagnosis. Our paper comes up with a new method for detecting malaria parasites from thick blood smears and thin blood smear slides based on a modified version of the YOLOv5 object detection algorithm in a 5G-based conceptual framework. We have modified the network architecture of the YOLOv5x model by adding two SENet layers just before the Upsample layers. The SENet allows global spatial information to be compressed into a channel descriptor. These modifications enable the model to enhance its accuracy consistently and precisely predict the malaria parasite on microscopic slides. Our proposed model has achieved an mAP of 93%. Thus, our research elucidates the efficacy of our modified version of the YOLOv5x model in automatically identifying infected cells and their stages from thick blood smears and thin blood smears microscopic visuals, respectively.
Footnotes
Acknowledgement
The authors express their heartfelt thanks to Dr. Vivek Behera, MBBS, MD, SCB Medical, Cuttack, Odisha for sparing his valuable time to enlighten us on the detailed mechanism adopted to identify malaria parasites from thick smear and thin smear slides. It is quite beneficial to complete this work under proper guidance and advice.
Contributorship
Conceptualization, S.L. and R.K.D; methodology, N.I., A.A. and K.C.; software, S.L. and N.I.; validation, R.K.D., N.I. and S.L.; formal analysis, S.L. and A.A.; investigation, N.I. and K.C.; resources, K.C. and A.A.; data curation, R.K.D., A.A. and N.I.; writing—original draft preparation, S.L. and R.K.D; writing—review and editing, N.I. and A.A.; visualization, K.C. and A.A.; supervision, R.K.D.; project administration, K.C.; funding acquisition, N.I. All authors have read and agreed to the published version of the manuscript.
Declaration of conflicting interests
The authors declared no potential conflicts of interest with respect to the research, authorship, and/or publication of this article.
Ethical approval
Ethical approval is not applicable for the work carried out in this paper.
Funding
The authors received no financial support for the research, authorship, and/or publication of this article.
Guarantor
NI
Patient consent
In accordance with the ICMJE guidelines, we confirm that patient consent was not applicable to this study. This study did not involve human subjects, and all data were obtained from publicly available sources.