
Abstract
Objective
Artificial intelligence-based magnetic resonance imaging (MRI) analysis has shown promising potential in predicting the response to intravenous glucocorticoid (IVGC) treatment in thyroid eye disease (TED). We aimed to explore a novel model for multimodal feature fusion based on MRI data to enhance predictive effectiveness.
Methods
We enrolled a total of 147 TED patients who underwent IVGC treatment. Pre-treatment orbital T2-weighted image was obtained for each subject, and individual segmentation of four extraocular muscles (EOMs) was performed. Radiomics analysis using different combinations of muscles as region of interests (ROIs) and machine learning algorithms were employed. Furthermore, we proposed a Residual Dynamic Integration Network (RDINet), which integrated image features extracted by convolutional neural network (ResNet-50), radiomics features, and clinical features using a dynamic mapping module.
Results
Combining medial rectus (MR) and lateral rectus (LR) in the modeling exhibited marginally improved performance than using all four EOMs in radiomics analysis (AUC = 0.8981 vs. 0.8796). ResNet-50 models based on MR + LR and four EOMs yielded AUC values of 0.9074 and 0.8889, respectively. RDINet achieved AUC values of 0.9213 and 0.9028 for the above two ROI strategies, which increased to 0.9537 and 0.9259 after integrating clinical features into modeling.
Conclusion
The focused combination of MR and LR in radiomics and deep learning analysis outperformed the inclusion of four EOMs for IVGC response prediction in TED patients. The proposed RDINet realizes effective multimodal feature fusion of TED, which serves as a potent dynamic mapping model for treatment response prediction.
Keywords
Introduction
Thyroid eye disease (TED) is an autoimmune disorder manifesting as orbital inflammation, leading to proptosis, eyelid retraction, and vision impairment. 1 TED can be categorized into active phase and inactive phase, characterized by different pathological alterations and the two phases of TED necessitate different management strategies.2,3 Intravenous glucocorticoid (IVGC) therapy stands as the first-line treatment for active, moderate-to-severe TED. However, clinical practice indicates a response rate of only approximately 50%–80%. 4 Therefore, finding predictive biomarkers for anti-inflammatory treatment remains critical in TED research. Imaging biomarkers are particularly valuable, given their ability to capture TED-related pathological changes through various orbital imaging. 5
Magnetic resonance imaging (MRI) has gained prominence in the evaluation of TED due to its capacity to detect changes within the orbital soft tissues. This has led to a substantial enhancement in disease activity assessment and the ability to predict therapy responses.6–8 T2-weighted imaging (T2WI) is frequently utilized as it offers valuable anatomical and metabolic insights into soft tissues.9,10 In radiological analysis, the effectiveness of conventional semiquantitative measurements have been found to correlate with the treatment response, but the prediction performance was limited, with area under the curves (AUCs) of 0.590–0.702.11,12 This resulted in underutilization of images. 13 In recent years, artificial intelligence (AI), such as deep learning and radiomics, has been widely used in medical image processing.14–17 Recently, some studies made use of radiomics features of extraorbital muscles (EOMs) based on T2WI to predict the treatment response of IVGC in TED patients.13,18 The above studies are preliminary studies on AI-based MRI prediction models for TED, which still need further enhancement.
Current predictive models for TED remain limited in effectiveness and efficiency, necessitating refinement in both region of interest (ROI) selection and modeling algorithms. Notably, the four EOMs exhibit heterogeneous pathological involvement during TED progression.19,20 Existing few studies segment individual EOMs to assess their imaging biomarkers or develop dedicated AI models. Therefore, we aim to explore the predictive efficacy of individual EOMs and their combinations. Furthermore, as algorithm selection critically impacts performance, we propose a dynamic mapping framework integrating multimodal features and comparing AI-driven models to optimize predictive accuracy.
Materials and methods
Subjects
This study was approved by the Institutional Review Board of Shanghai Ninth People’s Hospital, and the requirement of consent was waived due to its retrospective nature. A total of 147 patients diagnosed with active, moderate-to-severe TED were enrolled in this study from September 2019 to May 2023. The enrolled subjects were randomly divided into the training cohort (n = 117) and testing cohort (n = 30) in a proportion of 4:1 using a stratified random splitting method (Fig. S1). All clinical data of subjects were collected from medical records of the subjects, as were evaluated by our multidisciplinary team of TED. Detailed inclusion criteria and clinical information were shown in Supplementary Material 1. All subjects took MRI examination based on T2WI before IVGC treatment. Detailed MRI acquisition was shown in Supplementary Material 2. Figure 1 provides a comprehensive workflow diagram of this study. The workflow diagram of this study.
Radiomics analysis
The four EOMs—inferior, superior, medial, and lateral rectus (IR, SR, MR, LR)—were manually segmented on coronal T2WI by two radiologists using ITK-SNAP (version 3.6.0). Detailed descriptions are displayed in Supplementary Material 3. Bilateral orbital features were extracted via Pyradiomics. To mitigate overfitting, optimal features were selected through reproducibility analysis, t-tests, and least absolute shrinkage and selection operator (LASSO) regression (Fig. S2 and Supplementary Material 4). Radiomics models were built using support vector machine (SVM), logistic regression (LogReg), and random forest (RF), comparing individual EOMs, four-EOM combinations, and optimized two-EOM pairs (based on predictive performance) to identify the optimal ROI strategy.
Convolutional neural network: ResNet-50
Based on the radiomics analysis, the relative best ROI segmentation methods were selected for deep learning analysis. Before being input to the network, all images were pre-processed by region segmentation, region image cropping, slice image selection and image intensity normalization. The bounding box defined by the annotation of four EOMs was identified as the input. The slice images were extracted according to the ROI. Finally, to reduce the variation of pixel intensities between different images, all images were normalized by Z-score before being input to the network, so that the scale of pixel intensities was within a certain range.
After image preprocessing, image features were extracted by ResNet-50 model to construct deep learning-based prediction models. 21 ResNet-50 is based on convolutional neural network (CNN) and trains a deeper neural network by adding four residual modules. Each residual block consists of several layers of residual bottlenecks. The residual bottlenecks reduce the size of the output feature maps by one half or one quarter compared with the input and increase the number of feature maps by two or four times, ensuring the complexity of the network layer while reducing the difficulty of deep network learning.
Dynamic mapping model: RDINet
To integrate the predictive contributions of radiomics, CNN, and clinical features in TED, we propose a Residual Dynamic Integration Network (RDINet). This model comprises three components: (1) a ResNet-50-based image feature extractor with residual blocks for CNN feature extraction, (2) a multi-layer perceptron (MLP) -based medical feature extractor for radiomics and clinical features, and (3) a dynamic mapping module that fuses CNN and radiomics features into mapped representations. These mapped features are processed by a classification head to generate final predictions. The dynamic mapping module is elaborated in the following section.
The dynamic mapping module is the core for feature fusion. In order to adaptively improve the representation of multimodal information, we used an iterable structure in the dynamic mapping module in RDINet, as shown in Figure 2. Each iteration of dynamic mapping module consists of numerous basic MLP. We utilized CNN features as the mapped features, denoted by “z”, and radiomics features as the mapping features, denoted by “q”. They are used as model inputs, and for one iteration, the output is the result after the dynamic mapping operation is completed. The dynamic mapping module requires k iterations. According to the ablation study detailed in Supplementary Material 5 and Table S1, we set the iteration count k to 3 to achieve optimal multimodal representation. Each iteration of the dynamic mapping module is as follows: Illustration of the RDINet model. RDINet comprises of three parts: the image feature extractor, the medical feature extractor and the dynamic mapping module. The image feature extractor consists of four residual blocks, and each comprises several layers of residual bottlenecks. The image feature extractor takes subject images as input, and the output is CNN features. The medical feature extractor is composed of three basic MLP layers, extracting radiomics features from the input images, and clinical features. The CNN features, together with radiomics features (and clinical features) were input into the dynamic mapping module, and the output is the mapped features. Each iteration of dynamic mapping module consists of numerous basic MLP. Abbreviations: RDINet, Residual Dynamic Integration Network; CNN, convolutional neural network; MLP, multi-layer perception.
The first step of the module is to generate the weight W based on q:

Here, RELU(·) and LN(·) represent the Rectified Linear Unit (RELU) activation function and layer normalization, respectively. The operation within the fully connected MLP layer is the matrix multiplication of z i and weight W. In order to reduce the problem of vanishing gradients and improve network accuracy and stability, this study introduces skip connections between zm and zi. Finally, zm is passed through the basic MLP layer to obtain zm 1 , which is defined as z i+1 . The output of this layer’s dynamic mapping module is z i+1 , q. Consequently, we set z i equal to z i+1 , then the updated z i and q will serve as inputs to the next layer’s dynamic mapping module. In essence, the output of each module becomes the input of the next module in the sequence.
To improve prediction accuracy, we developed RDINet (clinical) by incorporating clinical features into RDINet’s medical feature extractor. This extractor processes radiomic and clinical features, which are fused with CNN features via the dynamic mapping module for final prediction. Sixteen predefined clinical features were used as exclusive inputs.
All deep learning networks were built on Pytorch framework. During training, the Adam optimizer was used to implement gradient descent to find the network parameters with the smallest loss function.21,22 To optimize hyperparameters and mitigate overfitting, we employed a 5-fold cross-validation strategy within the training cohort. Based on the ablation experiments presented in Supplementary Material 5, Table S1 and Figure 3., the optimal number of epochs for network training was determined to be 100, and the learning rate was fixed at 0.001. In order to adapt to the Graphics Processing Unit (GPU) memory size, the batch size was set to 16, and the image size was unified to 128×128×32 before input to the network. In addition, the images in this experiment will undergo online data enhancement before training, that is, the functions in the algorithm framework were used for random transformation of the image, and the methods used include random noise, random rotation and random scaling. Grad-CAM visualization of the RDINet model. Top row: Original T2-weighted MRI slices. Bottom row: Heatmap overlays where red indicates high feature importance. The activation patterns confirm the model’s primary focus on the Medial and Lateral Rectus muscles. Abbreviations: Grad-CAM, Gradient-weighted Class Activation Mapping; RDINet, Residual Dynamic Integration Network.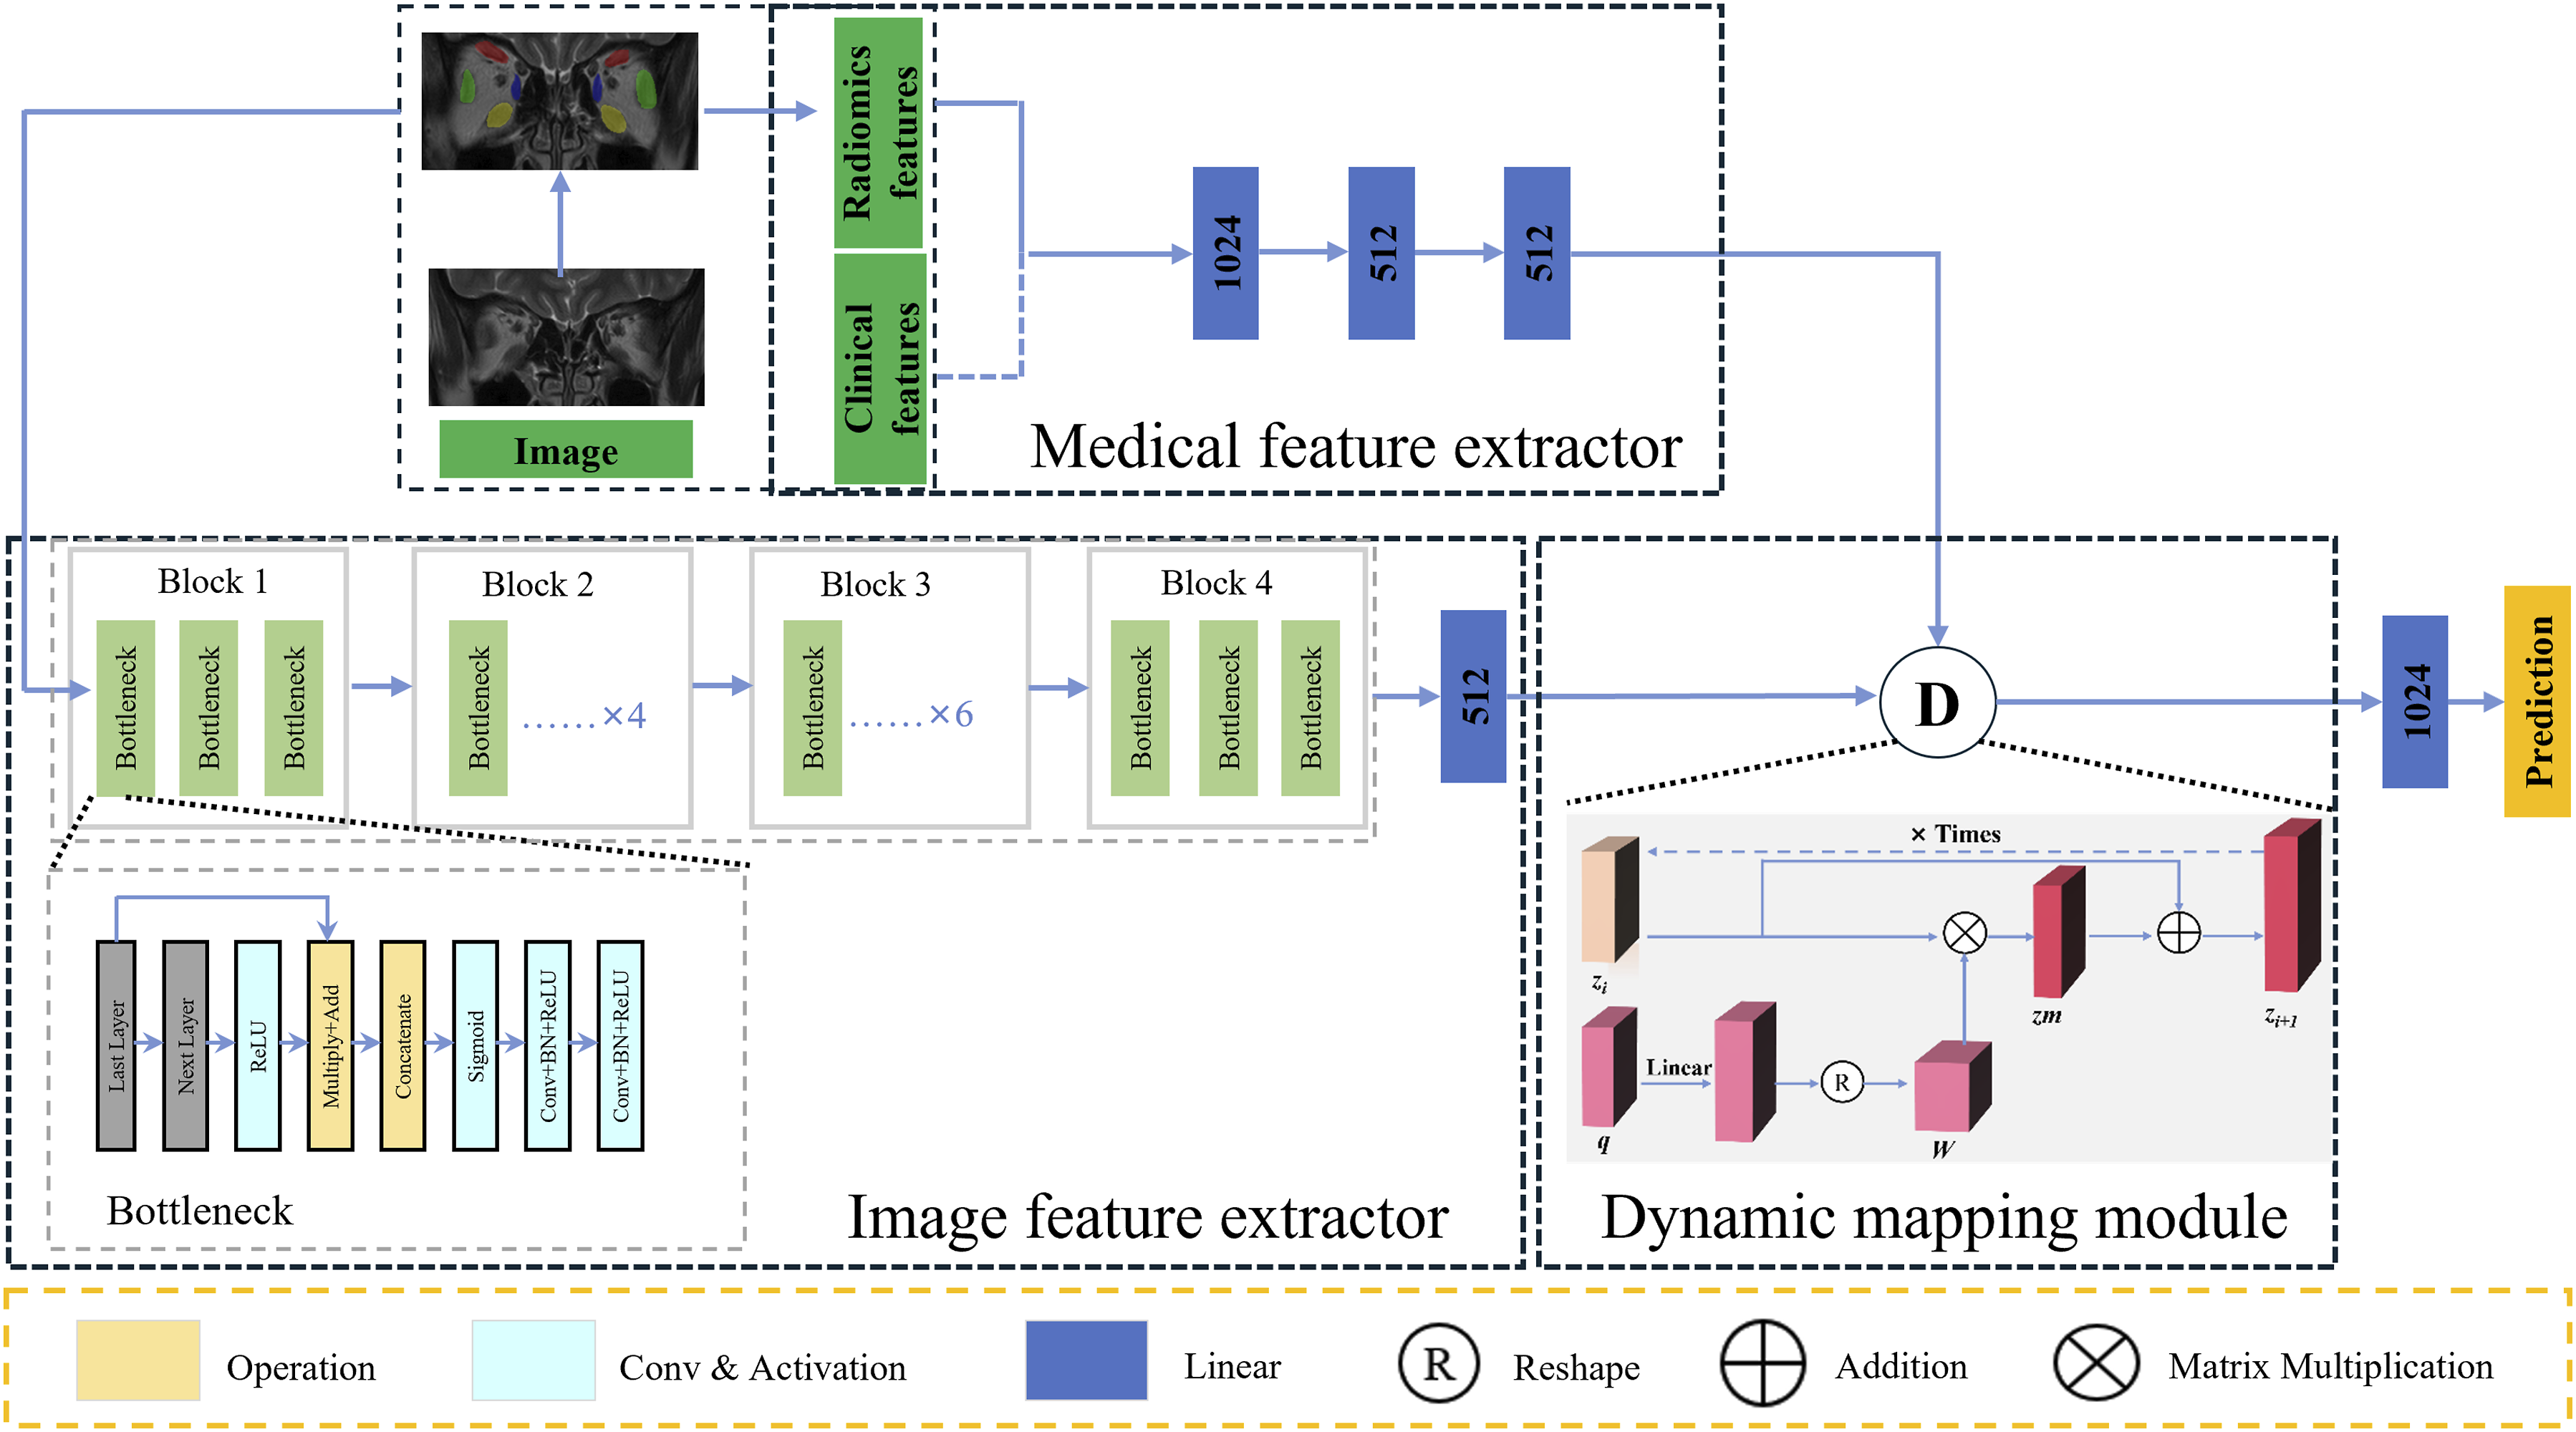
Statistical analysis
The statistical analysis was conducted using the Python programming language (version 3.7.6) with the use of SciPy library (1.4.1), Statsmodels module (v0.11.1) and SPSS software (version 26; IBM, Armonk, NY). A two-tailed P < 0.05 was considered statistically significant. Categorical data comparisons between two groups were assessed using the chi-squared test, while numerical variables were compared using either the independent-sample t-test or Mann-Whitney U-test. The prediction performance of different models was evaluated through their decision curve analysis (DCA) and receiver operating characteristic curves (ROCs). Area under curve (AUC), accuracy (ACC), sensitivity (SEN), specificity (SPE), positive predictive value (PPV), and negative predictive value (NPV) were calculated. The calibration of the prediction models was assessed through calibration curves to assess the accuracy of risk estimates. The machine learning algorithm with the highest AUC was ultimately chosen to represent the effectiveness of the models and compared among different models.
Results
Clinical characteristics
Demographic and clinical characteristics of TED subjects in training and testing cohort.

Numeric variables are presented as the mean ± standard deviation. Categorical variables are presented as counts. * P < 0.05 was considered statistically significant between the responsive and the unresponsive groups. TED, thyroid eye disease; TRAb, thyroid-stimulating hormone receptor antibodies; CAS, clinical activity score; IOP, intraocular pressure; BCVA, best corrected visual acuity; M, male; F, female; Y, yes; N, no.
Radiomics analysis and optimal ROI strategy identification
For all ROI strategies, 660 radiomics features were extracted from the coronal T2WI, including shape (n = 14), first-order (n = 198), texture and high-dimensional features (n = 448). The feature selection process was conducted for each ROI strategy. Taking the strategy of four EOMs as an example, six identifiable features of T2WI-based radiomics were finally identified, including: all_original_shape_MajorAxisLength, all_original_firstorder_Kurtosis, all_wavelet-LLH_firstorder_Median, all_wavelet-LLL_firstorder_Kurtosis, all_square_firstorder_Skewness, all_square_glcm_Correlation. Radiomics features of other ROI strategies were listed in Table S2. The ROC of radiomics analysis based on different ROI strategies and algorithms were shown in Figure 4. The ROC curves of models using three different machine learning algorithms (SVM, LogReg and RF) based on different ROI strategies in the training cohort (a-c) and the testing cohort (d-f). Abbreviations: ROC, receiver operating characteristic curves; SVM, support vector machine; LogReg, logistic regression; RF, random forest; ROI, region of interest.
Among the four individual segmentation strategies of extraocular muscles, the ROI strategies of MR and LR had the best performance respectively in either of the three algorithms. Therefore, the two muscles were combined for further analysis, as MR + LR. We then compared the strategy of MR + LR and four EOMs, in terms of prediction results. In the testing cohorts, MR + LR achieved best AUC by SVM (AUC = 0.8981, 95% CI: 0.7943-0.9894), while four EOMs by LogReg (AUC = 0.8796, 95% CI: 0.7550-0.9867). The ACC, SEN, SPE of MR + LR based on SVM radiomics models in the training cohort were 0.9060, 0.8367, and 0.9559, respectively, and in the testing cohort were 0.8667, 0.8333, and 0.8889, respectively, and were marginally better than that of the four EOMs.
Enhancement of predictive results utilizing CNN models
The evaluation results of prediction models utilizing CNN models (ResNet-50 and RDINet) were shown in Figure 5. After integrating radiomics (SVM) into ResNet-50, formatting RDINet reached satisfactory results in the testing cohort. The MR + LR based CNN model marginally outperformed the four EOMs-based CNN model in prediction performance (AUC = 0.9074 vs. 0.8889, for ResNet-50; AUC = 0.9213 vs. 0.9028, for RDINet, respectively). In the training cohort, the RDINet model achieved the ACC of 0.8889, SEN of 0.9184, SPE of 0.8676, PPV of 0.8333, and NPV of 0.9365 in prediction performance. In the testing cohort, the ACC, SEN, SPE, PPV, and NPV of the RDINet (clinical) model were 0.9000, 0.9167, 0.8889, 0.8462, and 0.9412, as shown in Table 2. Notably, for both MR + LR and four EOMs, the prediction performance of RDINet surpassed ResNet-50. The results and evaluation of the four EOMs-based and MR + LR based CNN models in the testing cohort. Calibration curves (a); DCA (b); and ROC curves(c). Abbreviations: EOMs, extraocular muscles; MR, medial rectus; LR, lateral rectus; DCA, decision curve analysis; ROC, receiver operating characteristic curves. Prediction performance of ResNet-50, RDINet, and RDINet (clinical) model utilizing MR + LR and four EOMs in the training and testing cohort. AUC, area under curve; ACC, accuracy; SEN, sensitivity; SPE, specificity; PPV, positive predictive value; NPV, negative predictive value; EOMs, extraocular muscles; MR + LR, the combination of the MR and LR.

With integration of clinical characteristics into RDINet, the AUC of RDINet (clinical) model for the training and testing cohort was elevated to 0.9493 and 0.9537, as shown in Table 2. In the training cohort, the RDINet (clinical) model achieved the ACC of 0.9658, SEN of 0.9388, SPE of 0.9853, PPV of 0.9787, and NPV of 0.9571 in prediction performance. In the testing cohort, the ACC, SEN, SPE, PPV, and NPV of the RDINet (clinical) model were 0.9333, 0.9167, 0.9444, 0.9167, and 0.9444, as shown in Table 2. The radar chart also intuitively revealed that the RDINet (clinical) yielded the best prediction performance, as shown in Figure 6. The detailed 16 Clinical features contribution for RDINet (clinical) predictive model construction was shown in Fig. S3. Radar chart of the prediction performance of radiomics (SVM), ResNet-50, RDINet and RDINet (clinical) models based on the ROI strategy of MR + LR. Abbreviations: SVM, support vector machine; MR, medial rectus; LR, lateral rectus; RDINet, Residual Dynamic Integration Network; ROI, region of interest.
Discussion
Accurately predicting IVGC treatment response is crucial for optimizing TED management. Our proposed RDINet model dynamically integrates CNN and radiomics features from T2WI via a dynamic mapping module, demonstrating effective multimodal fusion. Notably, selecting MR+LR ROIs (vs. four EOMs) achieved superior performance (testing AUC: 0.9537 vs 0.9167), further enhanced by clinical feature incorporation. These results highlight RDINet’s potential as a practical predictive tool for IVGC therapy outcomes in TED.
Some previous AI-based MRI studies have delved into the prediction of TED treatment response. Hu et al. extracted radiomics features from volumes of interest encompassing EOMs bellies and the LogReg-based radiomics model achieved an impressive AUC of 0.916 in the validation cohort. 13 However, it is important to note that in most studies, the conventional approach involved all four EOMs as ROI. There is potential to optimize this approach for more time-efficient segmentation of these anatomical structures. In view of this challenge, our study attempted to optimize the ROI selection. A study found that the thickness of EOMs did not correlate with the outcome of IVGC therapy, except for MR. 23 In the progression of TED, EOMs are purportedly involved in the following sequence: IR, MR, SR, and LR. 24 Regarding the LR’s potential for predicting the efficacy of IVGC therapy, we believe this may be attributed to the AI-based radiomics approach employed in our study. Even when the LR does not exhibit significant morphological thickening, subtle internal textural differences may already be present and detectable by radiomics analysis. These nuanced features could potentially serve as reliable discriminators for subsequent disease outcomes. However, given the limited research on individual EOMs, this remains speculative. Based on these findings, we hypothesize that MR and LR hold more significant predictive value, potentially tied to the muscle’s pathophysiological changes and its response to IVGC treatment. Consistently, our research revealed that combining MR with LR resulted in marginally improved performance compared to analyzing all four EOMs in radiomics analysis. In further deep learning models, the advantage of combining MR and LR still existed. This discovery offers insights into a more convenient and efficient method for image segmentation in future MRI research of TED.
The prediction results of different models were compared to identify the model with the best prediction and generalization performance. It is noteworthy that in this work, each deep learning model consistently outperformed the radiomics model. Deep learning models possess the unique capability to automatically extract and adapt features from input data. With an increase in model depth and the number of parameters, the feature dimensions that a model can accommodate expand, leading to a more comprehensive representation of the input. Consequently, recent advancements have highlighted that deep learning models, especially CNN models excel over most radiomics models in specific metric measures. Li et al. 25 assessed the effectiveness of radiomics and two deep learning methods in predicting muscle-invasive bladder cancer status based on T2WI and demonstrated that deep learning models consistently outperformed the radiomics model.
ResNet-50, a 50-layer CNN architecture, utilizes residual modules to enhance feature extraction and network performance. ResNet has been widely used in various feature extraction applications. 26 Its emergence solves the problem that classification performance and accuracy cannot be improved after the number of network layers reaches a certain depth. Compared with the traditional CNN, the deep residual network introduces the residual module into the network. 27 The residual module alleviates the issue of gradient vanishing in backpropagation, thereby overcoming training difficulties and performance decline in deep neural networks. Although deep learning demonstrates strong capabilities in automatic feature extraction, radiomics continues to play an indispensable role. To leverage the strengths of both approaches, we designed a dynamic mapping module that integrates features from CNNs and radiomics, achieving enhanced performance through effective multimodal fusion. Similar efforts have also been made by other researchers, who have developed their own hybrid models. Zhao et al. 28 illustrated that the prediction of Epidermal Growth Factor Receptor mutations in subjects with non-small cell lung cancer saw an improvement in AUC, rising from 0.645 to 0.758 when radiomics based on CT images was combined with deep learning. Sun et al. 29 demonstrated an AUC of 0.90 by employing deep learning-based radiomics for distinguishing Parkinson’s disease patients from normal controls using post-radio chemotherapy positron emission tomography data, which surpassed the performance of either radiomics model or deep learning model.
Radiomics and deep learning exhibit complementary functionalities in TED research: radiomics enables quantitative extraction of high-dimensional imaging biomarkers (e.g., inflammatory edema, fibrotic remodeling, adipose degeneration), while deep learning discerns intricate structural patterns and tissue heterogeneity through hierarchical feature abstraction.15,30 The improved performance of the combined model suggests a potential synergistic effect of the combination of radiomics and deep learning. 31 Further investigations can be done to clarify the relationship between the CNN features and the radiomics features. Building upon RDINet, we ventured into incorporating clinical features into the model, leading to the RDINet (clinical). In the testing cohort, RDINet (clinical) achieved an AUC value of 0.9537, surpassing the 0.9213 achieved by RDINet. This indicates that incorporating clinical features—particularly key indicators of TED like CAS and exophthalmos—can improve predictive performance. As biomedical data grows increasingly multimodal, it becomes easier to capture the complex relationships underlying biological processes. The aim of fusion strategies is to effectively exploit complementary, redundant and cooperative features of different modalities. 32 The multimodal features can play an important role in analyzing disease characteristics and predicting disease prognosis.
Multimodal feature fusion is pivotal in medical image analysis and predictive modeling.33,34 Wan et al. 34 demonstrated that integrating nonlinear CNN features with radiomics via MLP classifiers enhances performance while preserving interpretability. Conventional fusion methods often rely on feature concatenation, equivalent to linear weighting. In contrast, our dynamic mapping module employs matrix multiplication to project CNN features onto radiomics, enabling multidimensional fusion with enriched depth and information. This approach outperforms traditional single-dimension fusion, as evidenced by RDINet’s superior performance in combining radiomics, deep learning, and clinical features through iterative refinement of generalized discriminative features.
The EOMs are the primary structures affected in TED, with varying degrees of involvement across different muscles during disease progression. While IVGC can effectively reduce EOM edema, treatment response is often heterogeneous. Our model provides clinicians with a predictive tool to identify patients who are less likely to benefit from glucocorticoids prior to treatment initiation. This may help avoid unnecessary exposure to steroid-related adverse effects in non-responders and enable earlier transition to alternative therapies (e.g., biologics or orbital radiotherapy), thereby improving therapeutic decision-making and overall clinical efficiency in TED management.
Our study has several limitations. First, although the included datasets have their own characteristics, including in terms of clinical and imaging (EOM morphological changes), they are under-representative, so the retrospective design and relatively small sample size necessitate validation through prospective studies. Second, the models lack external validation, requiring future multicenter studies with standardized metrics. In addition, currently, the segmentation of EOMs in this study relies on manual delineation, which remains time-consuming and resource-intensive. Future studies should incorporate automated segmentation approaches to improve processing efficiency and reproducibility. Finally, residual modules introduced to mitigate vanishing gradients increased computational overhead and training time, limiting practicality in resource-constrained settings. Future studies will explore transformer-based foundation models and efficient architectures to enhance feature extraction efficiency.
Conclusion
This study indicates that the focused combination of MR and LR in radiomics and deep learning analysis has demonstrated marginally superior performance over incorporating all four EOMs for IVGC response prediction in patients with TED. Moreover, the proposed RDINet, which integrated CNN features and radiomics features from MRI, demonstrated remarkable predictive performance, especially with the incorporation of clinical features. This approach offers an effective and efficient method of IVGC response prediction for TED patients, which might assist the fundamental decision-making process of clinical practitioners.
Supplemental material
Supplemental material - RDINet: A novel dynamic mapping model integrating radiomics and deep learning for predicting treatment response in thyroid eye disease
Supplemental material for RDINet: A novel dynamic mapping model integrating radiomics and deep learning for predicting treatment response in thyroid eye disease by Haiyang Zhang, Duojin Xia, Jialu Qu, Yixing Li, Shunshi Yang, Mengda Jiang, Lei Zhou, Xiaofeng Tao, Xianqun Fan, Xuefei Song and Huifang Zhou in Digital Health.
Footnotes
Acknowledgement
The authors would also like to thank Dr. Ao Shen and Dr. Lingen Li for their professional opinions and assistance.
Author contributions
Funding
The authors disclosed receipt of the following financial support for the research, authorship, and/or publication of this article: This work was supported by the National Natural Science Foundation of China (82388101 and 82271122); the Science and Technology Commission of Shanghai (20DZ2270800); Shanghai Key Clinical Specialty, Shanghai Eye Disease Research Center (2022ZZ01003); Biobank Project of Shanghai Ninth People’s Hospital (YBKB202211); Clinical Acceleration Program of Shanghai Ninth People’s Hospital, Shanghai Jiao Tong University School of Medicine (JYLJ202120).
Declaration of conflicting interests
The authors declared no potential conflicts of interest with respect to the research, authorship, and/or publication of this article.
Declaration of AI use
AI tools were used for grammar checking and language polishing of specific sentences during manuscript preparation. The authors reviewed and approved all changes and assumed full responsibility for the work.
Supplemental material
Supplemental material for this article is available online.