
Abstract
Purpose
Breast cancer encompasses various subtypes with distinct prognoses, necessitating accurate stratification methods. Current techniques rely on quantifying gene expression in limited subsets. Given the complexity of breast tissues, effective detection and classification of breast cancer is crucial in medical imaging. This study introduces a novel method, MPa-DCAE, which uses a multi-patch-based deep convolutional auto-encoder (DCAE) framework combined with VGG19 to detect and classify breast cancer in histopathology images.
Methods
The proposed MPa-DCAE model leverages the hierarchical feature extraction capabilities of VGG19 within a DCAE framework, designed to capture intricate patterns in histopathology images. By using a multi-patch approach, regions of interest are extracted from pathology images to facilitate localized feature learning, enhancing the model's discriminatory power. The auto-encoder component enables unsupervised feature learning, increasing resilience and adaptability to variations in image features. Experiments were conducted at various magnifications on the CBIS-DDSM and MIAS datasets to validate model performance.
Results
Experimental results demonstrated that the MPa-DCAE model outperformed existing methods. For the CBIS-DDSM dataset, the model achieved a precision of 97.96%, a recall of 94.85%, and an accuracy of 98.36%. For the MIAS dataset, it achieved a precision of 97.99%, a recall of 97.2%, and an accuracy of 98.95%. These results highlight the model's robustness and potential for clinical application in computer-assisted diagnosis.
Conclusion
The MPa-DCAE model, integrating VGG19 and DCAE, proves to be an effective, automated approach for diagnosing breast cancer. Its high accuracy and generalizability make it a promising tool for clinical practice, potentially improving patient care in histopathology-based breast cancer diagnosis.
Keywords
Introduction
Breast cancer has become the most common type of cancer and the leading cause of death for women in recent years. Allowing to data from the American Cancer Society, over 281,500 new instances of invasive breast cancer were identified worldwide in 2022 in women, with a projected 3000 extra cases in males. As of right now, women make up 30% of all cancer patients in the United States, and 19% of these instances are breast cancer, which suggests that the prevalence of cancer is rising overall. 1 The annual incidence of breast cancer has grown by 0.5% during the mid-2000s. The World Health Organization (WHO) predicted that more than 2.3 million new cases of breast cancer will be reported globally in 2020, accounting for approximately 11.7% of all recently identified cancer cases. Furthermore, it was projected that the illness would take the lives of 685,000 women. 2 A tumor that arises from abnormal breast tissue growth is known as breast cancer. Asymmetry between the breasts, masses of different sizes and forms, the formation of micro-calcifications (MCs), and anomalies in normal tissue architecture are just a few of the ways the anomaly may show themselves. 3
The simplest techniques for identifying if someone has breast cancer are clinical examinations and breast self-examination. Breast cancer is occasionally diagnosed after symptom development, despite the fact that many women with the ailment are not showing any symptoms. In the early phases of breast cancer detection, medical imaging is as important as clinical breast exam and physical examinations. Many imaging modalities, such as mammography and ultrasound, are used in the widespread practice of breast cancer screening. Radiologists feel that microcalcifications, bilateral asymmetry, putative masses, and architectural distortion are the most valuable and successful uses of mammography, which is because it is often utilized for early breast cancer screening. But when there is dense breast tissue, it is ineffective. Use of ultrasonography resolves this problem. The non-ionizing and painless characteristic of ultrasound makes it a popular imaging method. It takes time and raises the possibility of observational errors for radiologists to subjectively assess mammography and/or ultrasound images. A computer-aided detection (CAD) system allows radiologists to overcome these constraints. By providing them with unbiased data, this technology improves the accuracy of their diagnoses.
Any portion of the breast, including the cells, tissues, and glands, can develop breast cancer. It can begin in the glandular structures known as lobules or in the milk-producing ducts. Cancer cells have the potential to spread and harm the entire body if they are not discovered immediately. Benign and malignant are the two classifications for breast tumors. While malignant lesions progress into breast cancer, benign lesions are cell abnormalities that do not cause cancer. Malignant cells divide quickly to increase in number. 4 It is quite challenging to manually evaluate the microscopic image since benign and malignant cells differ in their appearance and morphology. Non-invasive breast cancer: The cancer cells are contained in the milk ducts or lobules of the breast and have not spread to other areas. Invasive breast cancer: The cancer cells have spread beyond the milk ducts or lobules and into the surrounding breast tissue. Invasive breast cancer can also spread to the lymph nodes and other parts of the body. Furthermore, ductal carcinoma in situ, also known as non-invasive breast cancer, and invasive breast cancer are the two primary types of breast cancer that might develop. Numerous early warning signs of breast cancer should arouse suspicions and prompt a screening test with a specialist. Mass, microcalcification, lopsided breasts, and architectural perversions are some of these symptoms. Breast cancer may be indicated by these symptoms. 5
The study 6 offers a sophisticated deep cascade framework that uses multilayer characteristics and sparse representation to increase the diagnosis accuracy of breast cancer. The model may perform better than conventional machine learning techniques by using its multilayer representation to capture intricate patterns in the data. Interpreting deep cascade frameworks can be more difficult than with conventional techniques. This can provide challenges in clinical contexts, where explainability is essential for understanding model predictions and winning over medical personnel.
The suggested technique 7 greatly increases blood-cell segmentation speed and efficiency, which is crucial for the prompt identification of hematological diseases. Rapid diagnosis can result from faster segmentation, which helps speed up clinical judgment and therapy. The efficiency and accuracy of the segmentation method might rely heavily on the quality of preprocessing techniques, such as noise reduction or image enhancement. In cases where preprocessing is not performed optimally, the segmentation accuracy could suffer, limiting the robustness of the approach.
Traditional blood cell analysis often requires manual segmentation by pathologists, which is time-consuming and prone to variability. 8 The automated AWOLSE method reduces the dependency on manual processes, enabling more efficient and standardized blood cell analysis in clinical and research settings. The segmentation of overlapping or tightly clustered blood cells remains a challenge for many level set methods, including AWOLSE. Although the adaptive weight optimization aims to improve accuracy, there may still be limitations in distinguishing boundaries between cells that are very close together or overlapping.
In order to increase the accuracy of breast cancer detection, 9 recent developments are increasingly looking into hybrid models that integrate data from several imaging modalities (such as mammograms, ultrasounds, and MRIs). By combining information from many data sources, the model is able to produce predictions that are more reliable. Combining mammography and ultrasound pictures, for instance, can assist in distinguishing between cancers and thick breast tissue, which may be difficult to do with just one modality.
In order to detect breast cancer more thoroughly, the study stresses the use of both mammography and ultrasound imaging modalities. Since each modality has unique strengths, combining data from several modalities might increase diagnostic accuracy. Ultrasound is helpful in differentiating solid masses from cysts, particularly in thick breast tissue, while mammograms are good in identifying microcalcifications. 10
The creation of an effective deep learning scheme specifically for breast cancer diagnosis is emphasized in the research. This is important because breast cancer is one of the main causes of cancer-related mortality in women. In clinical settings with limited data resources, the suggested strategy can improve access to breast cancer diagnosis by improving the model for small dataset. 11 For breast cancer survival rates to increase, 12 early detection is essential. The study advances the development of diagnostic tools that can detect breast cancer early, especially in cases when the symptoms are vague or mild, by employing a deep hybrid system. 13 Acute leukemia is a dangerous and frequently fatal illness that needs to be diagnosed as soon as possible in order to be effectively treated. Improving acute leukemia identification and categorization is the main goal of the paper since it is essential to better patient outcomes. The research directly addresses the urgent demand for quick and accurate hematological diagnostic tools by creating an effective model. 14 By demonstrating how sophisticated neural network architectures may be customized for certain medical diseases, the article advances the field of deep learning applications in biomedicine. It emphasizes the adaptability of deep learning models in managing intricate image analysis tasks that are frequently encountered in the healthcare industry by concentrating on semantic segmentation.
High-throughput screening programs could benefit from the proposed network's ability to automate TB detection. 15 This feature is especially helpful in areas where tuberculosis is prevalent, as quick screening of sizable populations can aid in the more efficient identification and isolation of infectious cases. The utilization of several imaging modalities (such as MRI, CT, and PET scans) for tumor detection is emphasized in this work. 16 The hybrid framework can offer a more thorough examination of brain tumors by utilizing the advantages of various imaging modalities. Every modality delivers different information. For instance, CT scans are great for evaluating bone structures, whereas MRIs reveal comprehensive soft tissue contrast.
The study is a useful tool for researchers and practitioners in the field since it offers a comprehensive analysis of the most recent developments in deep learning and machine learning techniques for breast cancer screening. 17 It summarizes current advancements, emphasizing cutting-edge techniques and how well they increase diagnostic precision. The study provides a comprehensive analysis of current automated sickle cell disease detection tools, including a range of imaging and machine learning methodologies. 18 For scholars, physicians, and engineers interested in hematology and automated disease detection, its comprehensiveness makes it an invaluable resource.
This study presents a unique technique that combines the VGG19 architecture with Multi-scale patch generator (MPa) and deep convolutional auto-encoder (DCAE) to categorize breast cancer in pathology images. Our recommended system uses the popular image recognition network VGG19 as the backbone network for feature extraction. Our method purposes to rise the classification model's discriminative power and generalization capabilities by integrating MPa to assess multiple regions of interest within an image and DCAE to provide robust feature representation. We create the utility of our proposed technique in consistently distinguishing between different histological patterns associated with breast cancer by undertaking extensive testing and evaluation on benchmark datasets. Our findings show that the combination of MPa-DCAE and VGG19 outperforms existing methods, suggesting that it has great potential as an efficient method for pathologists to diagnose breast cancer.
Our goal has its foundation in the method's potential to greatly enhance pathologists’ diagnostic abilities, leading to earlier diagnoses and more individualized treatment plans for patients with breast cancer. The use of a multi-patch strategy allows the model to analyze multiple regions of interest within each pathology image. This approach increases the likelihood of detecting subtle cancerous features that might be missed by traditional methods focusing on a single region. By capturing complex patterns and variations across different patches, the model improves the accuracy of the classification, thereby decreasing the chance of missed diagnoses. The incorporation of DCAE in the model provides robust, unsupervised feature learning, which adapts to variations in pathology image characteristics, such as differences in staining or image resolution. The auto-encoder's ability to learn these complex features reduces the reliance on handcrafted features or manual evaluation, leading to a decrease in human-related diagnostic variability and potential errors. The proposed method, which augments and automates pathology image evaluation, may develop patient outcomes, decrease diagnostic errors, and expedite the diagnostic procedure. Further adding to the growing corpus of literature on the application of DL in medical imaging, our contribution establishes the foundation for further study in this significant area of research.
Owing to the survey results obtained, the following research gaps are identified. The lack of defined protocols and impartial assessment techniques is mostly to blame for diagnostic discrepancies in the categorization of breast cancer from pathology images. 19 Significant differences in diagnostic results are caused by variations in image acquisition procedures, including staining methods, scanner configurations, and picture resolution. Inconsistencies in diagnosis are further exacerbated by pathologists’ frequent reliance on subjective judgment, which can vary greatly based on individual competence and experience. Another factor contributing to different interpretations of the same pathology images is the absence of widely recognized standards for grading and staging malignancies. The limits of existing computational methods, which might not adequately handle the complexity and unpredictability found in histopathology data, further exacerbate these problems. Without standardized protocols and robust harmonized computational methods, achieving reliable and reproducible diagnoses remains a significant challenge in the pathology of breast cancer.
Adding to these difficulties, manual interpretation of pathology pictures is the main source of subjectivity in breast cancer diagnosis. 20 This subjectivity is impacted by the intrinsic complexity of breast cancer tissues as well as technical elements including the experience, education, and familiarity of particular pathologists with diagnostic criteria. For instance, there can be a great deal of variation among pathologists when it comes to correctly determining the severity of cancer based on histopathological characteristics including cell shape, mitotic rate, and tissue architecture, or distinguishing between benign and malignant lesions. Further layers of intricacy are added by minute changes in cell layout, staining intensity, and the existence of artifacts. This heterogeneity is increased by the use of semi-quantitative scoring methods, such the Nottingham grading system, which mostly rely on subjective assessment. 21 As a result, the lack of standardized objective criteria in manual interpretation highlights the need for automated and standardized diagnostic tools to reduce subjectivity and improve diagnostic consistency.
Current techniques for categorizing images of breast cancer pathology are frequently limited by their incapacity to precisely identify minute traits that distinguish different subtypes. 22 These current methods, which mostly rely on pathologists’ manual review or simple image analysis tools, usually overlook minute morphological characteristics and molecular markers that are crucial for accurate subtype designation. To differentiate between distinct subtypes, for instance, small differences in nuclear texture, chromatin patterns, or mitotic figures are essential. The complexity and heterogeneity of tumor microenvironments, where overlapping traits are widespread, make the problem even more difficult.
This study's main contribution is
To develop an MPa-DCAE, a Multi Patch-based deep learning method that analyzes histopathology images and uses DCAE to identify and categorize breast cancer. To effectively capture complex patterns in images, the model under discussion makes use of the high hierarchical capabilities of VGG19 and integrates them into a DCAE framework. Finally, incorporating regions extracted from pathology images into the DCAE-VGG19 model, we facilitate localized feature learning and enhance the model's discriminatory capabilities.
Literature survey
Researchers have examined a variation of classification algorithms throughout the years, with the impartial of developing the accuracy and efficiency of detecting breast cancer using pathology images. The goal of this review of the literature is to provide a thorough summary of the significant developments in the use of pathology images to categorize breast cancer.
Three distinct iterations of the reliability and accuracy of different recognition models were inspected by AlZoubi et al. 23 in their thorough assessment of transfer learning-based techniques and automatically created networks. Six distinct DCNN models were first developed using transfer learning. The next step was training a CNN (BONet) to categorize breast lesions using Bayesian optimization. The examination made use of a retrospective dataset with 3034 images that were obtained from numerous US hospitals. Subsequent an exhaustive testing phase, BONet outperformed previous models, with an accuracy of 83.33%, a 1.85% reduction in generalization gap, faster training times of 66 min, and lower complexity.
The MIAS and CBIS-DDSM dataset was used by Hameed et al. 24 to progress an ensemble deep learning technique that precisely classified breast cancer histology images into carcinoma and non-carcinoma groups. They employed VGG16 and VGG19 architectures, which had previously been trained, to construct four distinct models. Five-fold cross-validation was employed to assess each model as the initial step in the evaluation process. Iterations that were fully trained and tuned were utilized to evaluate the VGG19 architecture. Subsequently, an ensemble approach was employed, utilizing the average of the anticipated probabilities. This methodology enabled us to determine that the optimized VGG16 and VGG19 ensemble outperformed other groups in terms of classification, particularly excelling in the carcinoma class.
According to Mohamed et al., 25 the accuracy with which deep learning models detect breast cancer from biopsy microscope images can be impacted by various data preprocessing techniques. To increase performance, they integrated the most effective models into an ensemble process. Without preprocessing, Densenet 169, Resnet 50, and Resnet 101 obtained accuracy values of 62%, 68%, and 85%, respectively. Resnet 101 produced the greatest accuracy among of all of them. Model accuracy was enhanced by 20%, 17%, and 6%, respectively, by data augmentation and segmentation. Ensemble learning further enhanced model accuracy. The highest possible accuracy was 92.5%.
Using a residual convolutional network and high-order statistical representations, Zou et al. 26 invented the groundbreaking Attention-Driven High-Order Deep Network (AHoNet). From pathological breast cancer images, AHoNet has shown outstanding ability in extracting important local characteristics. This is achieved by leveraging a strong channel attention module that allows complex local cross-channel interactions while maintaining dimensionality. When second-order covariance statistics were estimated using matrix power normalization, AHoNet demonstrated improved global feature representation in the context of pathological breast cancer images. AHoNet's astounding performance was highlighted by its unanticipated 85% accuracy in patient-level categorization on the BACH database.
Bagchi et al. 27 used histological image analysis and deep learning algorithms to classify breast cancer cases. They used preprocessing methods such stain normalization, augmentation, and regularization to identify smaller patches within the images. Utilizing our ensemble techniques and machine learning classifiers, they examine processed patches and divide them into four kinds: invasive, benign, in situ, and normal. Subsequently, they employ this patch data to categorize each image into four non-cancerous groups and two carcinogenic categories. They advocate for a probabilistic method that employs a two-class framework to classify images into four groups.
Lee et al. 28 presented STMLAN, a classification model that combines Meta Learning with an auxiliary network. This auxiliary network improved feature representation in breast pathology images, making it easier to do Single-Task Meta Learning for model generalization. In challenging multi-classification tasks, the STMLAN model demonstrated an important increase in accuracy of at least 1.85% over previous techniques. Furthermore, the model's Silhouette Score improved by 31.85% for learnt features, indicating its ability to acquire more unique features and improve overall generalization capabilities.
Liu et al. 29 presented AlexNet-BC, a new approach to breast disease classification. In this context, they provide a new cross-entropy loss function for controlling low-entropy output distributions with high confidence levels. This adjustment results in more accurate forecasts, particularly for uniform distributions. They conducted multiple trials using the BreaKHis, IDC, and UCSB datasets to assess their methods. The data analysis shows that the proposed technique consistently produced almost superior outcomes over a wide range of magnification levels.
Using image analysis and machine learning approaches, Wang et al. 30 developed a novel method to automate cancer diagnosis and classification. They performed preprocessing operations such as thresholding, filtering, and grayscale conversion of color images using the BreaKHis dataset. Watershed and distance transform methods were used to segment the nuclei. They also looked into two different methods of feature extraction. Their ensemble-tagged tree classifier remarkably achieved an outstanding 89.7% precision in binary classification. Furthermore, 88.1% accuracy is achieved by an ensemble subspace discriminant classifier in multiclass classification.
According to the methods used for image segmentation, Michael et al. 31 divided the diagnostic images of breast cancer into two groups: machine learning methods, which comprised supervised, unsupervised, and deep learning methods, and classical methods, which included region-based, threshold-based, and edge-based approaches. According to research, deep learning methodologies outperform traditional strategies for segmenting X-ray images because they remove the need for pre- and post-processing steps.
Joshi et al. 32 presented a smart method for detecting breast cancer that uses CNNs. To extract information about breast cancer from histopathology images, they utilize BreakHis and IDC. Results are based on Xception, ResNet50, and EfficientNetB0 pre-trained CNN models. Optimized Xception performs best. The 40x BreakHis dataset magnification images produce 93.33% accuracy. Once models are trained on 70% of BreakHis, 30% is used for validation. Batch normalization, dropout, and data augmentation regularize. On a portion of the IDC dataset, testing and fine-tuning the augmented Xception model achieves 88.08% invasive ductal carcinoma identification accuracy.
A system using multimodal hybrid deep learning to seamlessly integrate patient gene data with imaging modalities was proposed by Liu et al. 33 This methodology leverages integrated information within a multimodal fusion framework to accelerate the prediction of breast cancer subtypes. When compared to the standard deep learning model, the hybrid DL model utilized in this study demonstrated higher precision and effectiveness in identifying breast cancer subtypes. Using a 10-fold cross-validation method, the hybrid model showed an 88.07% predicted accuracy.
Si et al. 34 suggest segmenting breast lesions using the Chimp Optimization Algorithm (ChOA) together with a multilevel thresholding technique based on Kapur entropy. The recommended method is an improved ChOA called ChOAOBL that donates opposition-based learning (OBL). A proposed method for breast lesion segmentation, dubbed SCAQOBL, creates use of the opposition-based Sine Cosine Algorithm (SCA) in Si et al. 35 Modernized SCA that contains Quasi-Opposition-Based Learning (QOBL) provides a SCAQOBL using multilevel thresholding.
In order to exactly detect and classify breast cancer from histopathological images, Hirra et al. 5 recognized Pa-DBN-BC, a Patch-based Deep Belief Network (DBN) structure. In order to competently extract features, their method generates use of supervised fine-tuning after unsupervised pre-training. Image patch features are regularly extracted by the network. Patch images of histopathology are classified using logistic regression. Patch information is fed into the model, which outputs a probability matrix representing either background or cancer.
Samriddha Majumdar et al. 36 suggest rank-based ensemble of deep learning models is designed to detect breast cancer. GoogleNet, VGG11, and MobileNetV3_Small are used as base learners. Decision scores of CNN models are fused using the Gamma function. The proposed method is tested on two histopathology datasets: BreakHis & ICIAR-2018. The proposed ensemble model is designed using the Gamma function for solving a 2-class classification problem of breast histopathological images.
R. Deiva Nayagam et al. 37 suggested the transfer learning techniques to train the efficient time-consumed transfer learning approach on ResNet50 architecture to evaluate the effectiveness and accuracy of categorization performance. It would take much longer to train a model from the starting phase using initial random weights than it would to train a network using the fine-tuned model based on the knowledge obtained from other pretrained models, transfer learning approach. The suggested technique uses transfer learning techniques on histopathological images from the publicly accessible BreakHis dataset to categorize benign or malignant BC, which is shown to be superior in comparison to other deep learning approaches in the form of BC detection accuracy with strong transferability and computational speed.
Proposed system
This section discusses an innovative approach for classifying breast cancer images in pathology reports by employing a multi-patch-based DCAE model featuring the VGG19 architecture. The model under consideration leverages the robust hierarchical capabilities of VGG19 and incorporates them into a DCAE framework in order to efficiently capture intricate patterns in photographs. By incorporating regions extracted from pathology images into the DCAE-VGG19 model, we facilitate localized feature learning and enhance the model's discriminatory capabilities. In addition, the auto-encoder component facilitates unsupervised feature learning, thereby enhancing the model's resilience and capability to adapt to alterations in image features. Figure 1 displays the block diagram of MPa-DCAE.

Block diagram of MPa-DCAE method.
Methodology
This study is quantitative research focused on the classification of breast cancer using deep learning techniques applied to pathology images. The aim was to develop a novel approach combining a multi-patch-based DCAE with the VGG19 architecture to improve breast cancer detection accuracy. The research was conducted using publicly available mammographic datasets. The study was performed between June 2022 and March 2024, using digital mammography images from the Curated Breast Imaging Subset of Digital Database for Screening Mammography (CBIS-DDSM) and the Mammographic Image Analysis Society (MIAS) at the Research Laboratory of Kalasalingam University.
Statistical analysis
The evaluation of the proposed model was performed using several statistical metrics, including Accuracy, Precision, Recall, F1-Score, and Matthews Correlation Coefficient (MCC). The experiments were conducted on two benchmark datasets: the CBIS-DDSM and MIAS datasets. The analysis aimed to compare the performance of the MPa-DCAE model with other state-of-the-art methods.
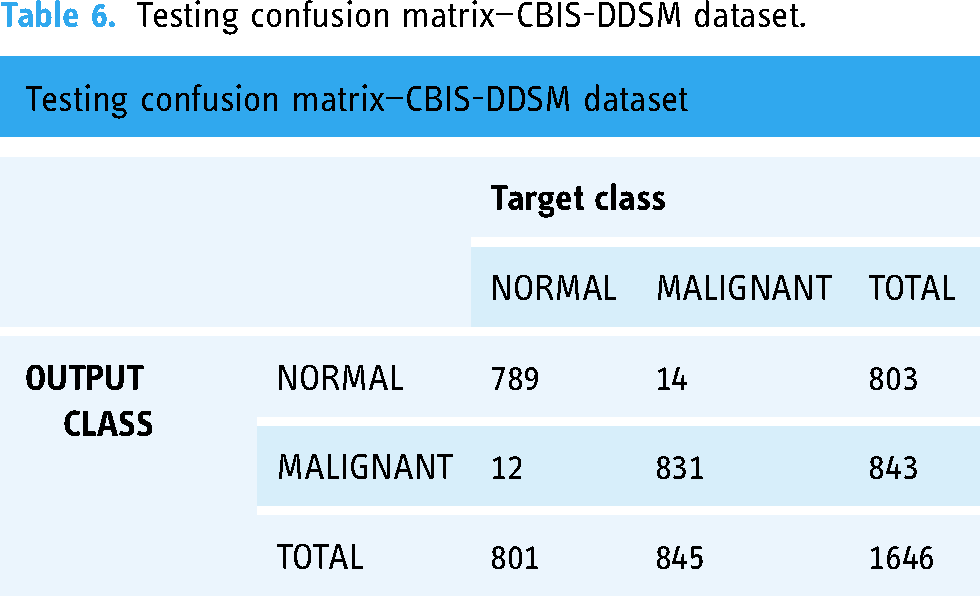
Confusion matrix analysis Confusion matrices were generated for both training and testing phases to evaluate the performance of the classification. For each dataset:
The confusion matrix for the CBIS-DDSM dataset showed high classification accuracy, with a significant number of true positives and a low number of false positives and false negatives. Similar performance was observed for the MIAS dataset, indicating consistent classification results across different data types. Performance metrics The following metrics were computed to assess the classification performance:
Precision: Defined as the ratio of true positives (TP) to the sum of true positives and false positives (FP). It measures the model's ability to correctly identify positive cases. Recall: The ratio of true positives to the sum of true positives and false negatives (FN). It evaluates the model's ability to detect all actual positive cases. F1-Score: The harmonic mean of precision and recall, providing a balance between the two. Accuracy: The proportion of correctly classified cases to the total number of cases in the dataset. Matthews correlation coefficient (MCC): This metric accounts for all four categories in the confusion matrix (TP, TN, FP, FN) and provides a balanced measure even if the classes are imbalanced. Comparative analysis The proposed model's performance was compared with other existing techniques on both datasets:
CBIS-DDSM dataset: The MPa-DCAE model achieved a precision of 97.96%, recall of 94.85%, and accuracy of 98.36%, outperforming previous methods such as ResNet101 and AdaBoost. MIAS dataset: The model attained a precision of 97.99%, recall of 97.2%, and accuracy of 98.95%, surpassing techniques like DenseNet201 and traditional CNNs. Loss and accuracy trends
Training and validation loss: The analysis of training and validation loss showed a consistent decrease over the epochs, indicating the model's ability to learn effectively from the data. Training and validation accuracy: Both training and validation accuracies improved steadily, demonstrating the model's generalizability to unseen data. Execution time analysis
The computation time was also recorded and compared with other methods. The MPa-DCAE model showed a significant reduction in execution time, making it a suitable approach for real-time clinical applications. Ablation study
Various components of the model were analyzed individually to understand their contribution to the overall performance. The results indicated that the multi-patch approach and DCAE played crucial roles in enhancing classification accuracy.
Dataset
Curated breast imaging subset of digital database for screening mammography (CBIS-DDSM)
The requirements of the DDSM mammography dataset are better met by CBIS-DDSM.33 Once decompressed, its images can be viewed on a computer in DICOM format. The dataset was in DICOM format; therefore, we converted it to PNG files and processed each image according to CBIS-DDSM rules. Our objective was to create a classification scheme that would allow us to distinguish benign from malignant images. An entire of 5482 images were used for training and evaluation of proposed framework. Table 1 provides information on the number and composition of samples assigned to the training and test sets. Figure 2 Illustrates sample impressive images from the CBIS-DDSM dataset.

CBIS-DDSM dataset image samples.
Description for the CBIS-DDSM dataset.

Mammographic image analysis society (MIAS)
The MIAS collection consists of 1075 large-format mammography images, each with a resolution of 1024 × 1024 pixels. This dataset is divided into three classes: 962 (approximately 89.5%) normal, 65 (approximately 6%) benign, and 48 (approximately 4.5%) malignant. The dataset has been split into training and testing sets, with 70% of the images used for training and 30% for testing, ensuring a balanced distribution across the different category. The information determines the kind of anomaly, including asymmetries, masses, and calcifications. The MIAS dataset is divided into six categories based on the type and characteristics of the mammographic abnormalities present. The classification is as follows:
Normal: Images that show no signs of abnormality. Benign mass: Images showing non-cancerous growths or lumps within the breast tissue that are considered benign. Malignant mass: Images with cancerous tumors or lumps that are classified as malignant. Benign calcification: Images displaying calcium deposits within the breast that are non-cancerous. Malignant calcification: Images with calcium deposits that are indicative of cancer. Architectural distortion: Images where the normal architecture of the breast tissue is distorted, which could indicate a potential abnormality, either benign or malignant.
Further the Dataset Categories were classified into three general categories such as Normal, Benign, and Malignant, as shown in Figure 3. Table 2 illustrates the increase in images (4%) that result from using the data augmentation techniques on the MIAS dataset. The MIAS dataset's comprehensive image classification is shown in Figure 3.

Sample images of the MIAS dataset.
Description for the MIAS dataset.

Preprocessing and augmentation
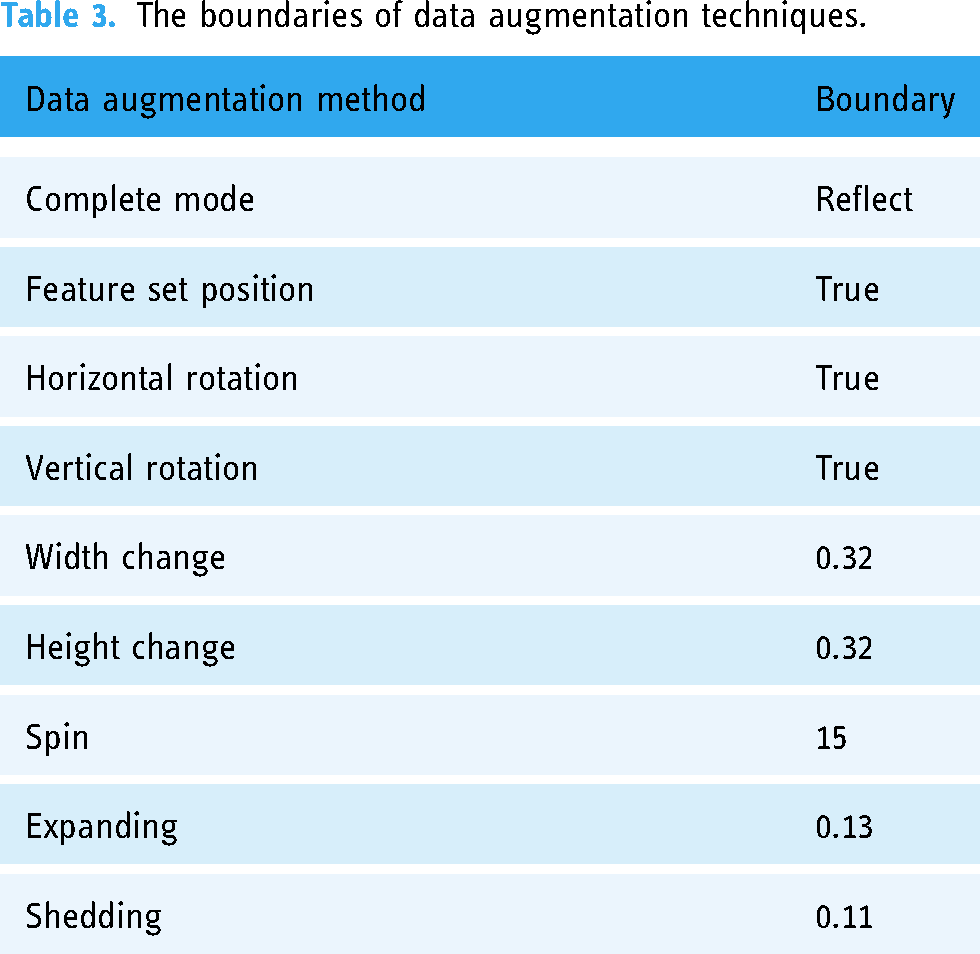
The two mammographic datasets were pre-processed and enhanced at this stage. The resolution of the images was increased to 224 × 224 by removing noise. This optimization not only reduced processing time and storage requirements but also prepared the data for augmentation. 38 To enhance standardization, decrease overfitting, speed up convergence, and better training sets, a number of data augmentation methods were employed. The Keras Image Data Generator was used to enhance the dataset's training set with additional images and perform data augmentation. Figure 4 displays the pre-processed images. The variety of data augmentation strategies used is displayed in Table 3.

Some samples from the pre-processed images of CBIS-DDSM data set.
The boundaries of data augmentation techniques.
Multi-scale patch generator
The MPa is a novel approach designed to enhance breast cancer classification by extracting features from multiple scales within pathology images. This method differs significantly from the approach presented in Reference, 28 which primarily focuses on single-scale patch extraction and may not adequately capture the complexities associated with varying tumor sizes and features in mammographic images. By leveraging multi-scale analysis techniques, this method aims to extract comprehensive features from various spatial resolutions within pathology images, thereby facilitating more robust and accurate classification of breast cancer subtypes. Through this innovation, the potential for improving diagnostic accuracy and clinical decision-making in breast cancer management is substantial, paving the way for enhanced patient care and outcomes.
In the proposed method, each image is divided into smaller patches for image analysis, and the information from these patches is then combined to provide predictions. Compared to conventional proposal-based techniques, which necessitate the strict enclosing of certain regions of interest within proposals, this method is simpler. To guarantee thorough coverage and record details at various scales, four patch sizes—48 × 48, 96 × 96, 192 × 192, and 384 × 384 pixels—are employed. These patches can overlap and cover different areas of the image at different scales since they are created using a sliding window technique with a stride of 16 pixels. The model's capacity to identify characteristics of different sizes is enhanced by this multi-scale patch extraction, which is essential for correctly identifying images of breast cancer.
Every patch Pi is represented by a four-tuple (r, c, h, w), where (r, c) stands for the top-left corner's coordinates and h and w indicate the patch's height and width, respectively. On the feature map GR, each Pi corresponds to a downscaled feature grid GRi.
A single-scale input image can be converted into multi-scale patches to create several feature grid layers. Without increasing the computation cost from the common convolution feature map, they are removed. The corresponding study on learning to segment image candidates searches for images using single-scale windows and multi-scale input. The key difference is that our approach can handle multi-scale recognition tasks with less difficulty. It also reduces the time that convolution layers need to compute.
A spatial scale of 3 × 3, 6 × 6, 12 × 12, and 24 × 24 are the results of applying a stride of 16 to GR. To balance efficiency and efficacy, we calibrate them to the same size of 12 × 12 using deconvolution and pooling layers. We have four examples, each of which corresponds to a single scale. We apply deconvolution layers to upsample scales 3 × 3 and 6 × 6 to 12 × 12. The values of kernel-size-over-stride are 2 × 2 and 4 × 4, respectively. The segmentation branch depends on the improved spatial information provided by the deconvolution layer. Next, we convert the 24 × 24 example back to the regular size using 2 × 2/2 max pooling. With a spatial scale of 12 × 12, the patches remain the same.
The patch's center can be found on an image Pi on area is greater than half of its on area, and Moreover, one-fifth of the area of Pi is inside on's.
We can only assign the image segment contained in Pi to Mi and the image label of on to Li once all these requirements are satisfied. This method reduces noise during training by down sampling the patch mask to the smallest scale of input patches, 48 × 48. This lowers computing load and makes multi-scale training possible inside a single process. Each patch, represented by Pi, is given responsibility for the center image in order to distinguish between unique occurrences. One image's label and mask will be predicted only if multiple images overlap with Pi. To reduce uncertainty, we segment only one item for each patch rather than numerous images that overlap with it. The second and third restrictions ensure that adequate semantic information is provided as well as the scale is appropriate. This core method has been empirically demonstrated to be very successful.
Multi-class classification branch
This section forecasts the Pi semantic label li using GRi, which is derived from the MPa. To lower the complexity of the model, we first employ 2 × 2 max-pooling. We classify patches using three fully connected layers, as is common in other conventional designs. fc(Pi) represents the projected score for patch Pi.
Segmentation branch
The segmentation branch takes GRi as input, just like the multi-class classification branch provides. It segments part or all of an image in patch Pi. We confine each patch Pi to only be accountable for one item based on Pi's center placement. The notion is analogous to expressing images using the centers of bounding boxes. However, the most significant distinction is the relaxation of the constraint that the bounding box must contain the complete image. The approach seeks to generate image proposals that require separate classifiers for classification. Mid-level patches can be simultaneously segmented and classified by our network. The existence of these patches does not depend on images. As described in the patch aggregation section, their existence is inferred after the last phase of simple aggregation. The next step is to use this branch as a pixel-level classifier with the goal of accurately predicting each component of the mask Mi using GRi. For every element in Mi, we create 48 × 48 classifiers by using two completely linked layers that alternate with Rectified Linear Unit (ReLU) activations, as shown in Figure 3. A 48 by 48 score map is formed from the finished prediction vector. The projected score map fs(Pi) is resized to match Pi after segmentation. The scaled score map is expressed as fs(Pi).
Training loss and strategy
We include the loss of segmentation and classification branches in the training process.
Consider N as the total number of elements in Mi, and let W stand for the parameter that needs updating. The preceding phrases suggest categorization, and the following ones denote segmentation. To maintain equilibrium between these two branches, λ is fixed at 10.
Patch aggregation
The patches receive segmented masks and predicted labels (represented by Ai and Bi) after network prediction. Observations show that when patches with significant overlap surround an image instance, the associated segment masks likewise have significant overlap. Notably, the segmented masks change with each instance. Using the appropriate semantic label for each patch aids in addressing issues associated with bottom-up grouping techniques. We improve the memory of our techniques by integrating segmentation masks into adjacent patches. For every patch, we examine neighboring patches with a similar class label on segment masks to determine the overlap score, or Pi. The overlap score (oij) between the current patch (Pi) and its neighboring patch (Pj) is derived from the intersection over union (IoU) of segmented masks. The left side of Pi's consecutive L patches constitutes the row search range for Pi. We designate this range of patches as Sr(Pi). The sequence of L patches above Pi, denoted by Sc(Pi), forms the column search range. Iterating over each patch, we search along each row and column in a single direction. The two patches that yield the highest overlap score are combined with the relevant segment masks. It is noteworthy that we perform our computations on an individual basis for every size. We utilize non-maximum suppression to address duplicate detection results.
Patch level feature extraction using VGG19
As previously indicated, we created a model for feature extraction from patches using DL. All the elements in the vector output produced by the model that begin with the character “P” stand for the probability that the patch is a member of a specific class. The output vector, denoted as “P,” represents the probability that every patch labeled “ith” belongs to the class labeled “jth,” where “j” refers to one of four classes (non-invasive, invasive, in situ, and normal). This likelihood is specifically indicated by P(i, j). Applying a softmax function to the neural network's final layer gave us the probability value.
VGG19 consists of 19 layers, including 3 fully linked layers and 16 convolutional layers. In 2014, Simonyan and Zisserman were its founders. 39 Its aim is to categorize images into one thousand groups. Nearly a million images across 1000 categories from the extensive ImageNet database were used to train VGG19. Every neural layer of this popular picture classification algorithm uses a bank of 3 × 3 filters.
The VGG19 model, pre-trained on the ImageNet dataset, serves as the backbone for feature extraction in our proposed system as shown in Figure 5(a). Several modifications have been implemented to tailor the model specifically for breast cancer classification in pathology images:
Input layer adjustment: The input layer of the VGG19 model has been modified to accept resized images of 224 × 224 pixels, ensuring compatibility with our dataset while maintaining the integrity of the original architecture. Fine tuning of the convolutional layers: While the convolutional layers are initialized with weights from the pre-trained model, we have fine-tuned these layers on our breast cancer dataset. This process involves unfreezing the last few convolutional layers to allow the model to learn specific features relevant to the pathology images, which may differ from general image categories in the ImageNet dataset. Custom classification head: A custom classification head has been added to the VGG19 model, replacing the original fully connected layers. This head consists of a series of dense layers followed by a softmax activation function, designed to output probabilities for the specific classes in our dataset (e.g. normal, benign, malignant). The final layer's number of neurons corresponds to the number of categories in our classification task. Dropout regularization: To mitigate overfitting, dropout layers have been introduced between the dense layers of the custom classification head. This adaptation helps improve the model's generalization ability by randomly deactivating a fraction of neurons during training. Modified loss function: We have opted for a categorical cross-entropy loss function suitable for multi-class classification tasks. This choice allows for better handling of the imbalanced dataset while optimizing model performance.
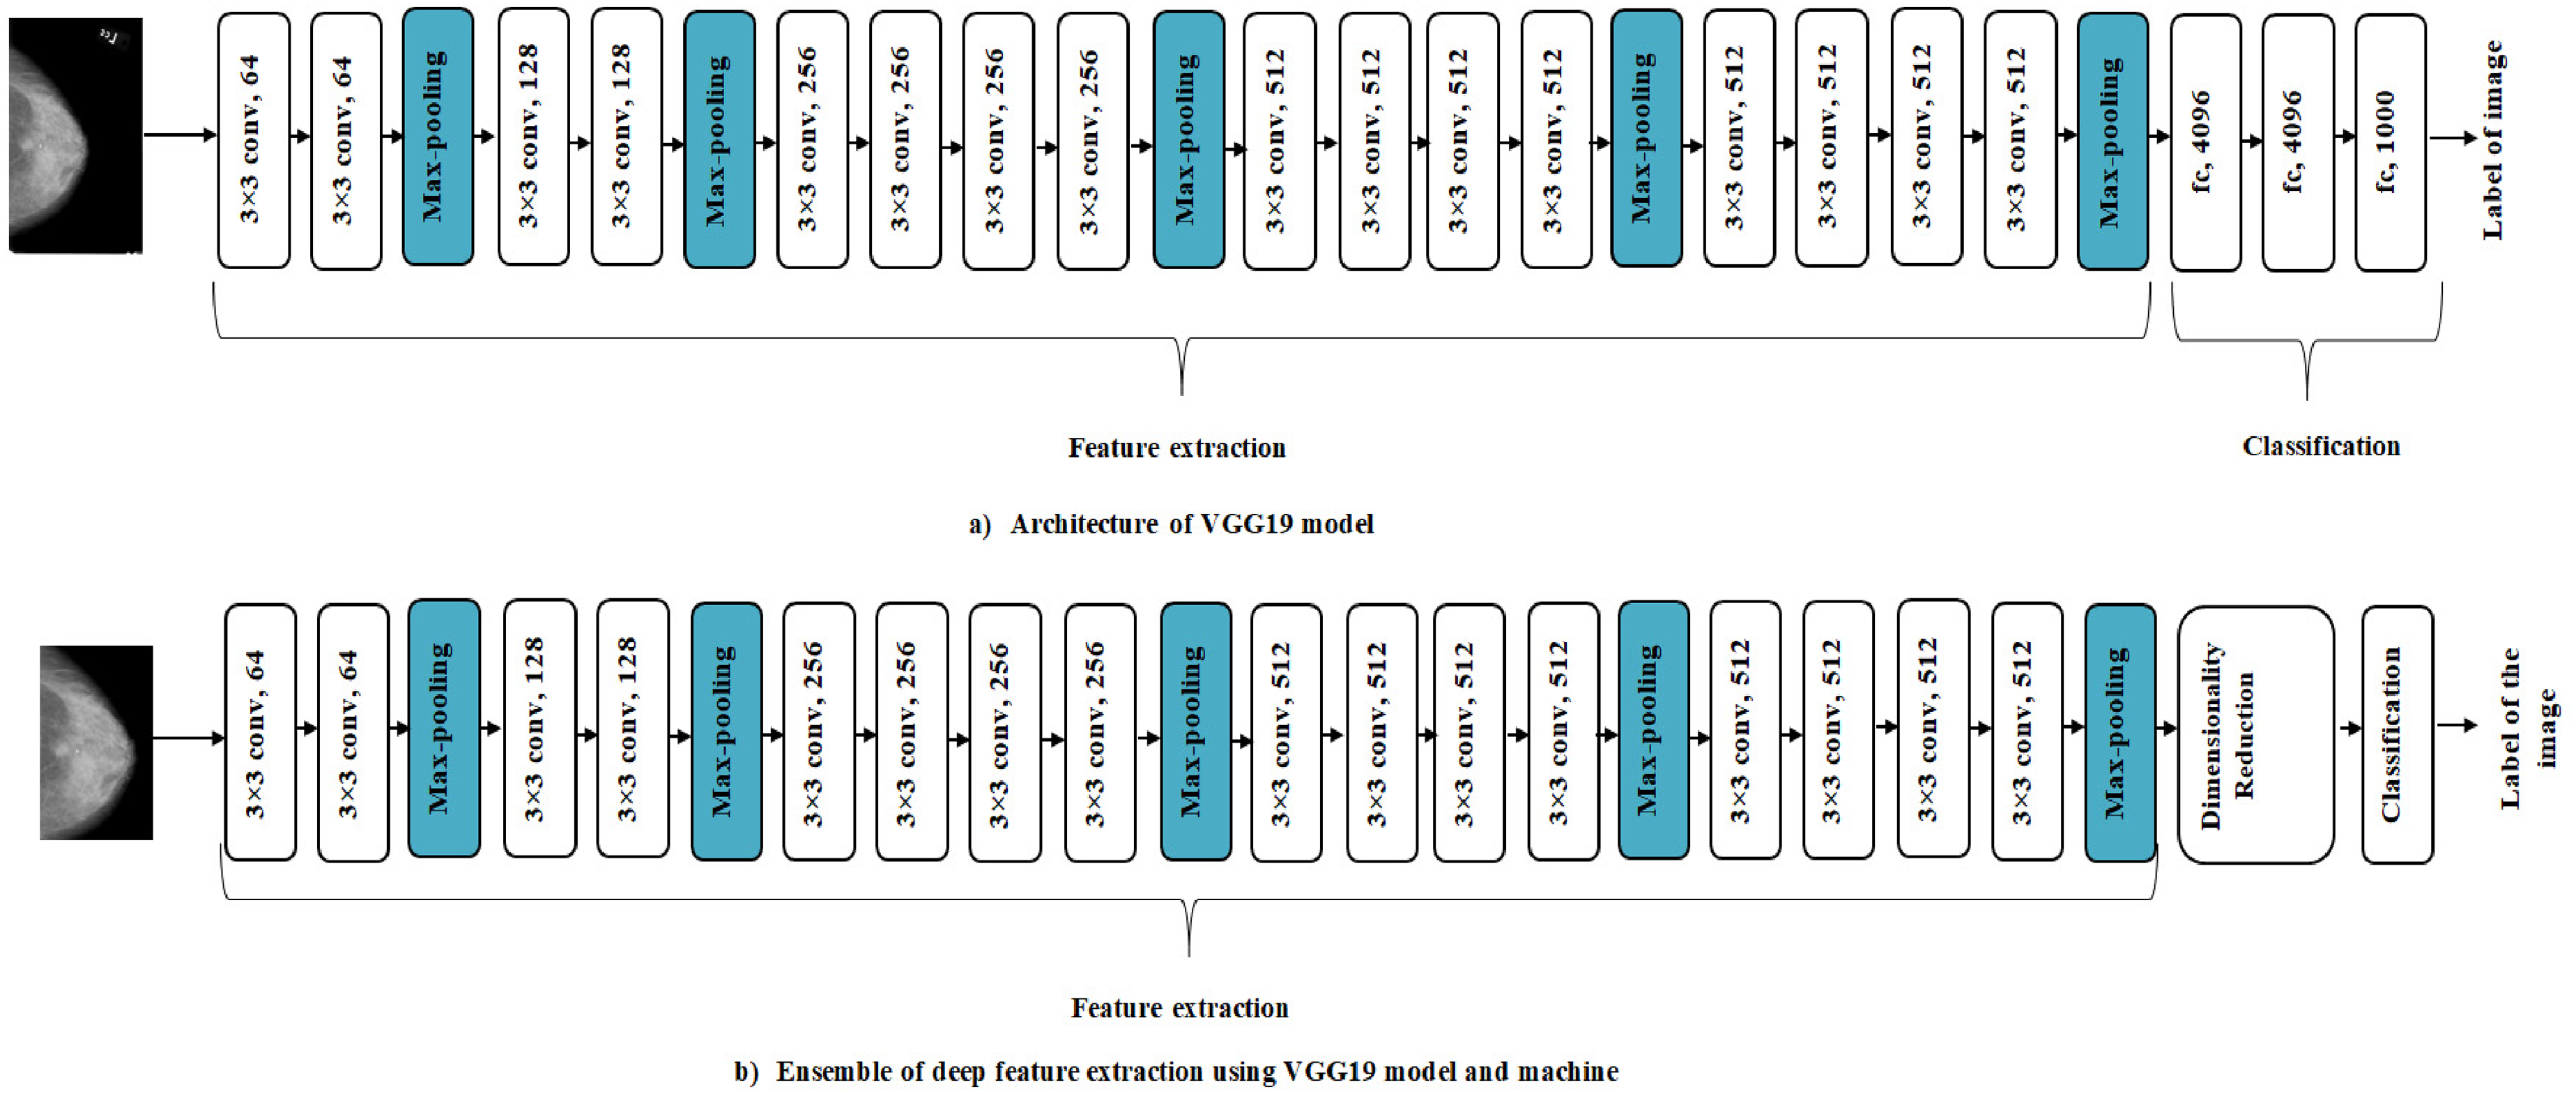
(a) VGG19 architecture model. (b) Ensemble of deep feature extraction using the VGG19 model and machine learning classification.
These specific adaptations to the pre-trained VGG19 model enable it to effectively learn and classify breast cancer pathology images, leveraging its deep feature extraction capabilities while aligning it with the requirements of our proposed application. The need for dimensionality reduction in order for the CNN model to compute important parameters during feature extraction is shown in Figure 5(b). Limiting the size of the feature vector requires this decrease. In order to arrive at a feasible classification strategy, this reduction should be made using Locality Preserving Projection, as described in Reference. 40
Patch classification using DCAE
The DCAE 41 employs convolutional and deconvolutional layers as opposed to completely linked layers, which are found in a DAE model. Due to its utilization of CNN features, DCAE may be more suitable for image-processing applications. CNN sets itself apart by virtue of having a trait in translation latent features: parameter sharing and local connections. Figure 6 shows our DCAE model's architectural structure.

The architecture of DCAE model.
During the encoding process, convolutional layers are mapped to an internal layer to function as feature extractors and acquire features. The disguised form of the present layer's 
This process is then applied to transform the resultant characteristics into pixels, while the deconvolutional layers perform the opposite task of reconstructing the latent representation, returning it to its initial state.
The DCAE promotes lowering reconstruction error in order to reveal latent representations inside its internal layer. Selecting the cross-entropy (logistic) loss function is consistent with research recommendations that show that networks trained with perceptual loss perform significantly better than those trained with the Euclidean (L2) loss function. The latter frequently shows lesser durability, especially in convolutional neural networks with deconvolutional layers. We employ the backpropagation technique, similar to conventional networks, to compute the gradient of the error affecting each parameter.
Results
Implementation environment
Using the recommended MPa-DCAE model, this section provides a detailed analysis of the outcomes from the group and individual breast cancer prediction tests. Our results display that the MPa-DCAE model is a very positive and practical technique of breast cancer prediction. The Google Colab and Kaggle Kernels hardware configurations were used for the experiments. For instance, Kaggle Kernel offers 13 GB of CPU RAM and two Tesla T4 GPUs, whereas Tesla P100 s were used on Google Colab.
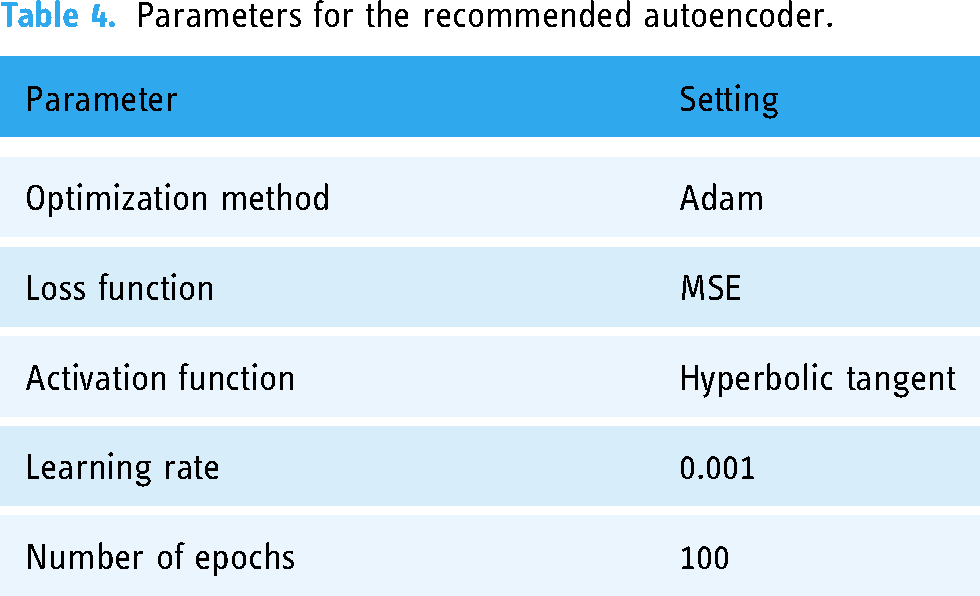
We utilized a normalized training dataset that contained only normal data to train the autoencoder during the training phase. Table 4 shows the parameters for the recommended autoencoder. Using the Adam optimization strategy, the autoencoder was trained across 100 epochs with a learning rate of 0.001. The hyperbolic tangent was used as the activation function and the mean squared error was used as the loss function.
Parameters for the recommended autoencoder.
Evaluation metrics
Several metrics, including the Matthews Correlation Coefficient (MCC), accuracy, precision (Pre.), recall (Rec.), and F1-score, were used to evaluate the suggested MPa-DCAE deep learning model.
Precision
Precision measures how accurate the model's positive predictions are, by calculating the proportion of true positive predictions out of all positive predictions made by the model. Precision is a fundamental statistical indicator that should be considered. It is expressed as the ratio of true positives (TP) to the sum of true positives and false positives (FP). Mathematically, it can be expressed as:
Recall, also known as Sensitivity, measures the model's ability to correctly identify all actual positive cases (true positives) out of all the actual positive cases. It expresses the ratio of true positives to the sum of false negatives (FN) and true positives in the provided equation.
The F1-score combines Precision and Recall into a single measure, offering a balanced view of the model's performance. This is particularly useful in scenarios with imbalanced datasets, such as medical diagnostics, where the positive cases (e.g. patients with a disease) may be much fewer than the negative cases. A high F1-score means the model is not only identifying the true positive cases effectively (high Recall) but is also making correct positive predictions (high Precision). It is a useful indicator when both false positives and false negatives are costly, as in medical diagnosis, where misclassifying cases can have serious consequences for patients.
The rationale behind computing recall and precision using the harmonic mean is expounded upon in the definition that follows.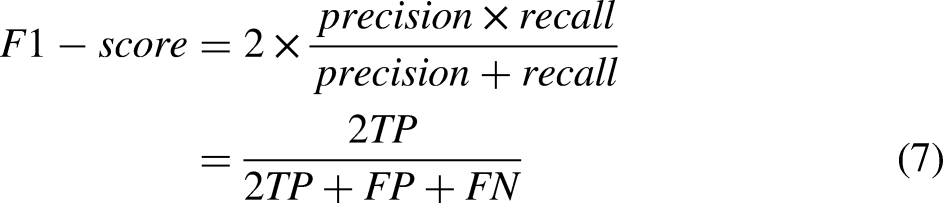
By showing the percentage of correctly classified cases in relation to all instances in the dataset, it measures the accuracy of the classification within the dataset. It can be stated mathematically as:
Similar to Pearson's product-moment correlation coefficient, the Matthews correlation coefficient evaluates the agreement between expected and observed values using a contingency matrix. This is an example in mathematics:
Training confusion matrix—CBIS-DDSM dataset.
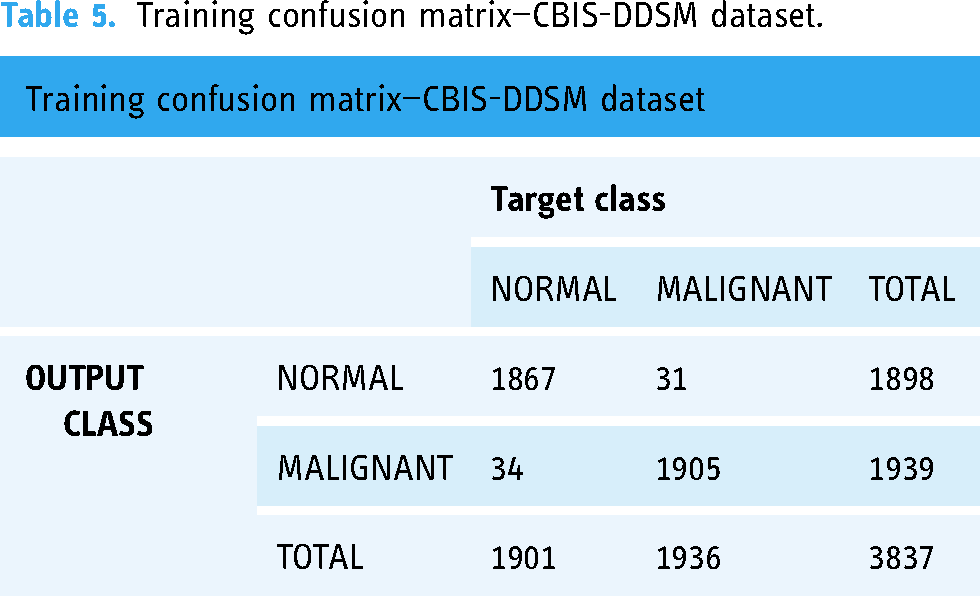
Testing confusion matrix—CBIS-DDSM dataset.
Training confusion matrix—MIAS dataset.

Testing confusion matrix—MIAS dataset.

In Table 9, the precision of the CBIS-DDSM dataset using the MPa-DCAE strategy is contrasted with other widely used techniques. The MPa-DCAE model, for example, has a precision value of 97.96%, whereas the models for Ragab DA, 42 Zhang H, 43 Khan HN, 44 and Pardamean 45 have precision values of 86.72%, 86.1%, 95.12%, and 96.4%.
Comparative analysis of suggested MPa-DCAE and other innovative techniques on the CBIS-DDSM dataset.

The MPa-DCAE strategies on the CBIS-DDSM dataset recall are compared with other popular approaches in Table 9. In contrast, the recall values for the Ragab DA, 42 Zhang H, 43 Khan HN, 44 and Pardamean 45 models are 86.1%, 82.98%, 93%, and 93.21%, respectively, while the MPa-DCAE model is 94.85%.
Table 9 shows comparisons of the MPa-DCAE methods’ accuracy on the CBIS-DDSM dataset to that of other widely used methods. As an illustration, the MPa-DCAE model has an accuracy value of 98.36%, while the models for Ragab DA, 42 Zhang H, 43 Khan HN, 44 and Pardamean 45 have accuracy values of 87.27%, 90.8%, 96.77%, and 97.3%.
The precision of the MPa-DCAE technique on the MIAS dataset is compared with other popular methods in Table 10. The table displays the enhanced precision performance of the DL technique. The MPa-DCAE model, for example, has a precision value of 97.99%, whereas the models for Ragab DA, 42 Zhang H, 43 Khan HN, 44 and Tan YJ 45 have precision values of 94.7%, 91.63%, 89.8%, and 81.8%.
Comparative analysis of proposed MPa-DCAE with existing techniques on the MIAS dataset.
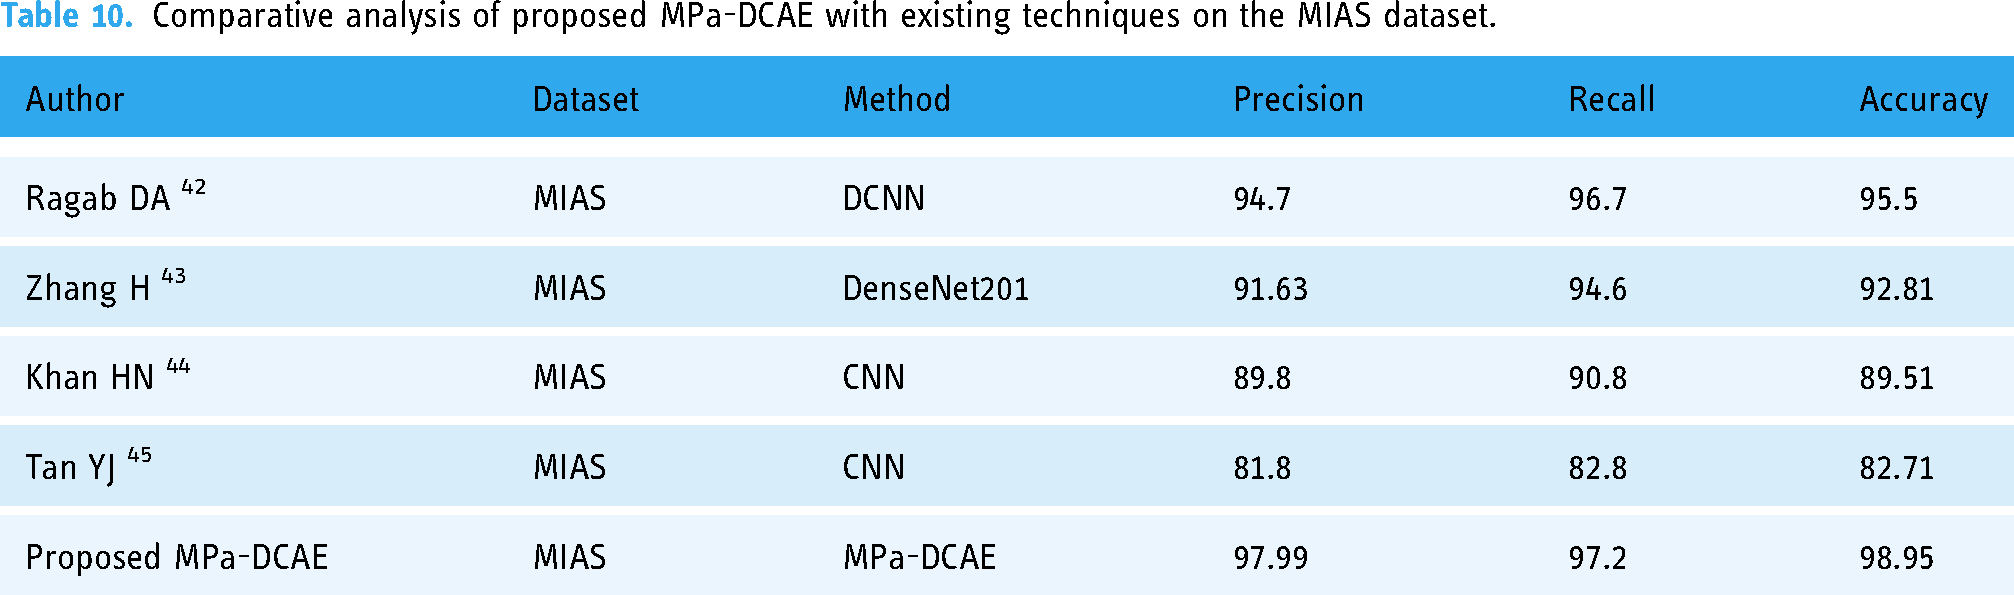
The MPa-DCAE technique's method on the MIAS dataset recall is compared with other popular approaches in Table 10. The recall values of the Ragab DA, 42 Zhang H, 43 Khan HN, 44 and Pardamean 45 models are 96.7%, 94.6%, 90.8%, and 82.8%, respectively, whereas the MPa-DCAE model has a recall value of 97.2%. The accuracy of the MPa-DCAE technique on the MIAS dataset is compared with other popular methods in Table 10. The table displays the enhanced accuracy performance of the DL method. The MPa-DCAE model, for instance, has an accuracy value of 98.95%, while the accuracy values of the Ragab DA, 42 Zhang H, 43 Khan HN, 44 and Pardamean 45 models are 92.51%, 89.51%, 82.71%, and 95.5%, respectively.
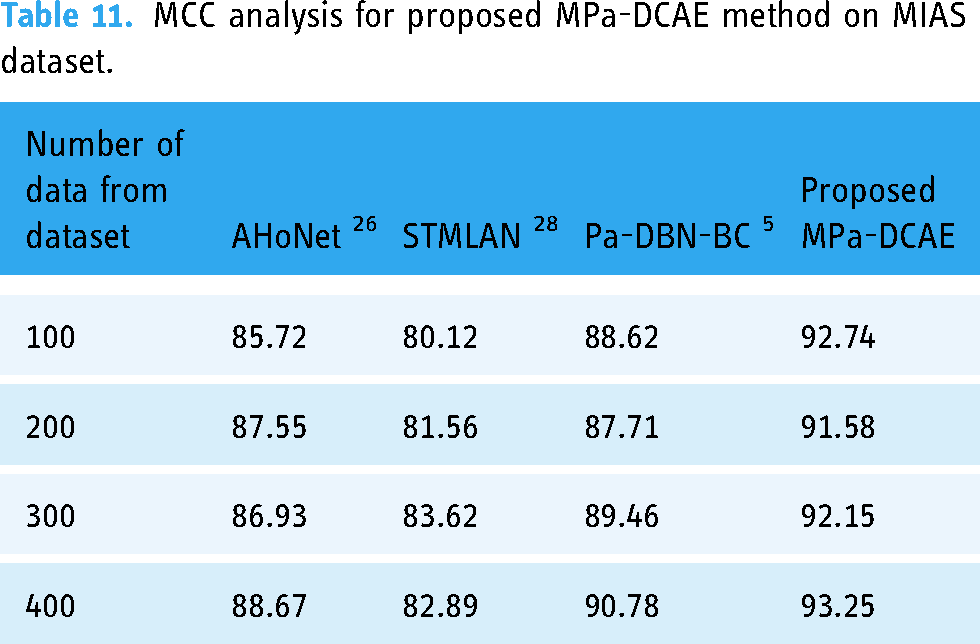
The MCC of the MPa-DCAE methodology with MIAS Dataset is compared with other commonly used methods in Table 11. In contrast to the MCC values for the AHoNet, 26 STMLAN, 28 and Pa-DBN-BC 5 models, which are 85.72%, 80.12%, 88.62%, and 92.74%, respectively, the MPa-DCAE model's MCC value for 100 data is 92.74%. In this way, the MCC value under 400 data for the proposed MPa-DCAE model is 93.25%, while the MCC values for the AHoNet, 26 STMLAN, 28 and Pa-DBN-BC 5 models are 88.67%, 82.89%, and 90.78%, respectively.
MCC analysis for proposed MPa-DCAE method on MIAS dataset.
The suggested MPa-DCAE methodology's computation time is contrasted with that of other methods with MIAS dataset in Table 12. The MPa-DCAE technique worked better than any other strategy, as the data plainly demonstrates. In contrast to other existing approaches like AHoNet, 26 STMLAN, 28 and Pa-DBN-BC, 5 which have taken 83.92, 63.92, and 71.82 ms, respectively, the recommended MPa-DCAE approach, for example, required only 54.34 ms to compute with 100 data. Similarly, the 400 data computation time for the proposed MPa-DCAE methodology is 58.34 ms, whereas the current methods, such as AHoNet, 26 STMLAN, 28 and Pa-DBN-BC, 5 require 87.72, 67.19, and 74.92, respectively.
Execution time analysis for proposed MPa-DCAE method on MIAS dataset.

The MCC of the MPa-DCAE methodology with CBIS-DDSM dataset is compared with other commonly used methods in Table 13. In contrast to the MCC values for the AHoNet, 26 STMLAN, 28 and Pa-DBN-BC 5 models, which are 80.72%, 79.12%, 82.34%, and 92.54%, respectively, the MPa-DCAE model's MCC value for 100 data is 92.54%. In this way, the MCC value under 400 data for the proposed MPa-DCAE model is 93.55%, while the MCC values for the AHoNet, 26 STMLAN, 28 and Pa-DBN-BC 5 models are 86.67%, 79.57%, and 88.19%, respectively.
MCC analysis for proposed MPa-DCAE method on CBIS-DDSM dataset.

The suggested MPa-DCAE methodology's computation time is contrasted with that of other methods with CBIS-DDSM dataset in Table 14. The MPa-DCAE technique worked better than any other strategy, as the data plainly demonstrates. In contrast to other existing approaches like AHoNet, 26 STMLAN, 28 and Pa-DBN-BC, 5 which have taken 73.85, 61.52, and 72.25 ms, respectively, the recommended MPa-DCAE approach, for example, required only 52.26 ms to compute with 100 data. Similarly, the 400 data computation time for the proposed MPa-DCAE methodology is 57.25 ms, whereas the current methods, such as AHoNet, 26 STMLAN, 28 and Pa-DBN-BC, 5 require 86.72, 67.84, and 75.89 ms, respectively.
Execution time analysis for proposed MPa-DCAE method on CBIS-DDSM dataset.

On an 80:20 split of the training and validation sets, the training loss and validation loss for the MPa-DCAE system are displayed in Figure 7. By examining a statistic called validation loss, we assess the MPa-DCAE method's performance on validation data. Furthermore, we use a statistic known as training loss to measure the variation between actual values and anticipated performance within the training data. The outcomes demonstrate the improved performance and precision in classification of the MPa-DCAE approach by showing that both training loss and validation loss reduce as the number of epochs increases.

Loss analysis for training and validation.
Figure 8 displays the training and validation accuracy of the MPa-DCAE system with a training set to validation set ratio of 80:20. The performance on a different testing dataset is used to compute the validation accuracy, and the MPa-DCAE method is evaluated on the training dataset to define the training accuracy. The findings reveal that training accuracy and validation accuracy both display improvement with an rise in epochs. The sudden decline in validation performance suggested that the model initially started to overfit to the training data. During the first few epochs, the model quickly learns basic patterns, leading to an increase in both training and validation accuracy. By the 6th epoch, the model might begin to “memorize” the training data, which can lead to a decrease in generalizability and a drop in validation accuracy. This drop was temporary as the model begins to adjust to new patterns in the training data that generalize better, leading to a recovery in subsequent epochs. Therefore, as the number of epochs rises, the MPa-DCAE method's performance on the training and validation dataset improves better.
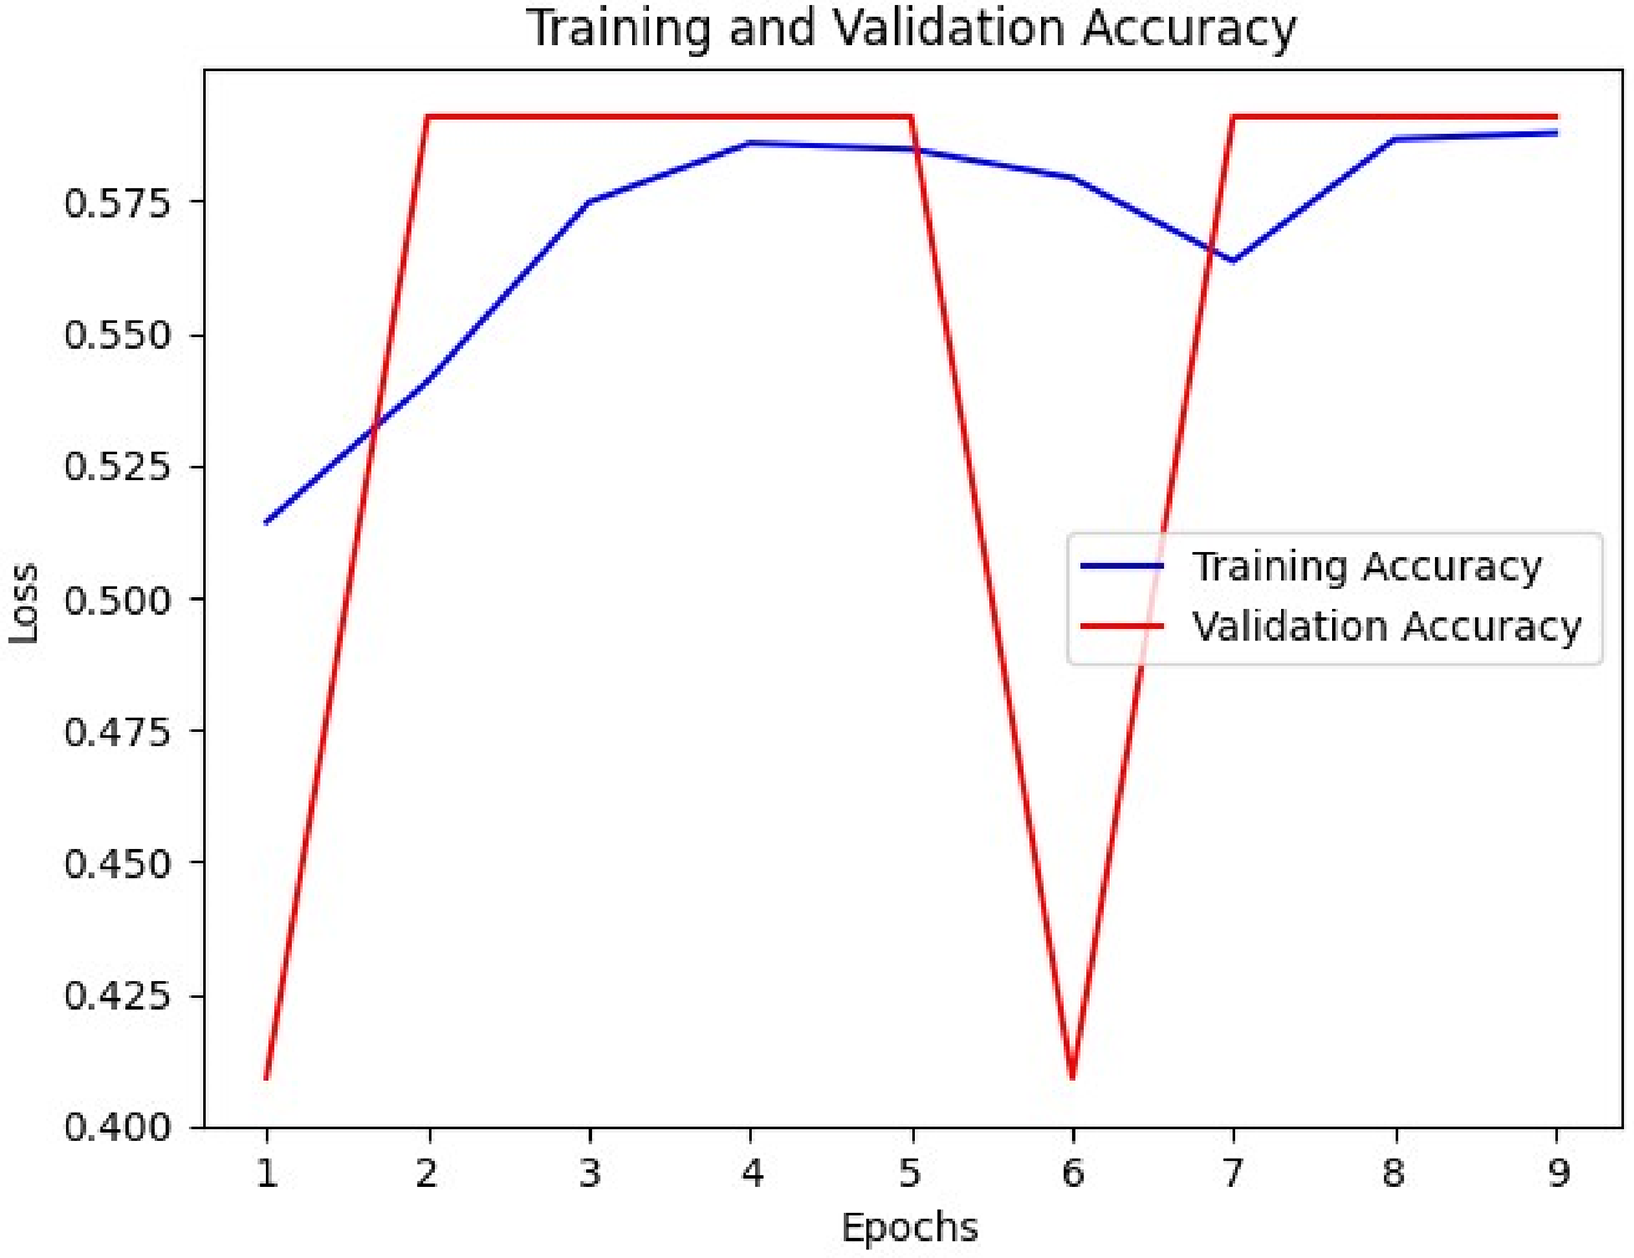
Accuracy analysis during training and validation.
Discussions
Traditional machine learning methods for breast cancer classification, such as support vector machines or random forests, often rely on handcrafted features extracted from pathology images. These approaches face limitations due to the complexity and variability of breast cancer tissues, which can lead to suboptimal feature extraction. In contrast, the proposed MPa-DCAE model leverages deep learning for automatic feature extraction, capturing intricate patterns in the data that may not be discernible through manual techniques. This advantage is evident in the higher accuracy (e.g. 98.36% on the CBIS-DDSM dataset) achieved by the proposed model compared to traditional methods. Argumentatively, while the proposed model eliminates the need for manual feature extraction, it does come with the trade-off of requiring a larger amount of training data to avoid overfitting, as opposed to traditional methods that can perform well with smaller datasets when features are well-chosen. The proposed method uses DCAE for feature extraction and VGG19 for classification, positively captured detailed patterns and structures within the images, allowing for reliable dissimilarity among cancerous and non-cancerous tissues. The experimental results displayed that our model outperformed existing methods in terms of performance parameters such as precision, recall, accuracy for CBIS-DDSM dataset (97.96%, 94.85%, and 98.36%) and MIAS dataset (97.99%, 97.2%, and 98.95%). Previous deep learning studies have used single-scale analysis, where models are trained on entire images or single-scale patches. For example, some methods employing VGG, ResNet, or DenseNet architectures achieved notable performance improvements. However, they often struggled with detecting subtle features at different resolutions, which are crucial for accurately classifying diverse breast cancer subtypes. The proposed MPa-DCAE model addresses this limitation by incorporating a multi-scale patch analysis, where four different patch sizes (48 × 48, 96 × 96, 192 × 192, and 384 × 384) are used. This multi-scale approach allows the model to detect both fine-grained details and larger structural patterns, providing a more comprehensive understanding of the images. Compared to single-scale methods, the MPa-DCAE model achieves superior classification performance, especially in cases where lesions vary significantly in size and appearance. The multi-patch method allows the model to efficiently evaluate numerous regions of interest within the images, which enhanced its capacity to detect subtle signals of cancer. Additionally, our technique displayed robustness across a range of image resolves and quality levels, highlighting its appropriateness for real-world applications where image fluctuation is extensive. Our findings show that DL techniques, exactly DCAE combined with VGG19, may accurately classify breast cancer in pathology images. The optional method shows promise for helping pathologists categorize breast cancer more precisely and rapidly, potentially leading to better patient outcomes and healthcare delivery. Further research could concentrate on improving the model architecture, including new data modalities, and undertaking prospective clinical validations to determine its clinical value.
Ablation study
In the suggested framework, each module is significant. This section determines the theory powering current models such as AHoNet, 26 STMLAN, 28 and Pa-DBN-BC, 5 as well as the over established MPa-DCAE, using a range of ablation tests on the CBIS-DDSM and MIAS datasets. Through the gradual incorporation of different steps of the proposed model, the aim is to examine performance improvements and provide the rationale behind our suggested MPa-DCAE and the results were shown in Figure 9.

The final prediction of the result images.
Influence of multi-patch
The utilization of multi-patch analysis in breast cancer classification from pathology images has greatly improved diagnostic accuracy and precision. Combining multiple patches from many sites within a tissue instance lets for a more comprehensive demonstration of the difference of breast cancer shapes. The multi-patch method uses complex machine learning algorithms to extract a variation of variables, including texture, shape, and spatial arrangement, which develops the discriminatory power of classification models. This comprehensive technique not only develops the identification of dissimilar subtypes and stages of breast cancer, but it also allows for the detection of subtle variations that typical single-patch analysis. Lastly, in the fight against breast cancer, the employment of multi-patch methods improves the diagnosis procedure, leading to better treatment decisions and patient outcomes. Additionally, MPA and the DCAE model worked better together, achieving an accuracy rate of 98.36% for the CBIS-DDSM dataset and 98.95% for the MIAS dataset when used as input data. In comparison, existing techniques for the CBIS-DDSM dataset by Ragab Zhang H, 42 Zhang H, 43 Khan HN, 44 and Pardamean 45 accomplished accuracy performances of 87.27%, 90.8%, 96.77%, and 97.3%, correspondingly. Likewise, for the MIAS dataset, Ragab DA, 42 Zhang H, 43 Khan HN, 44 and Tan YJ 45 accomplished accuracy performances of 95.5%, 92.81%, 89.51%, and 82.71%, respectively.
Influence of the K-fold cross-validation
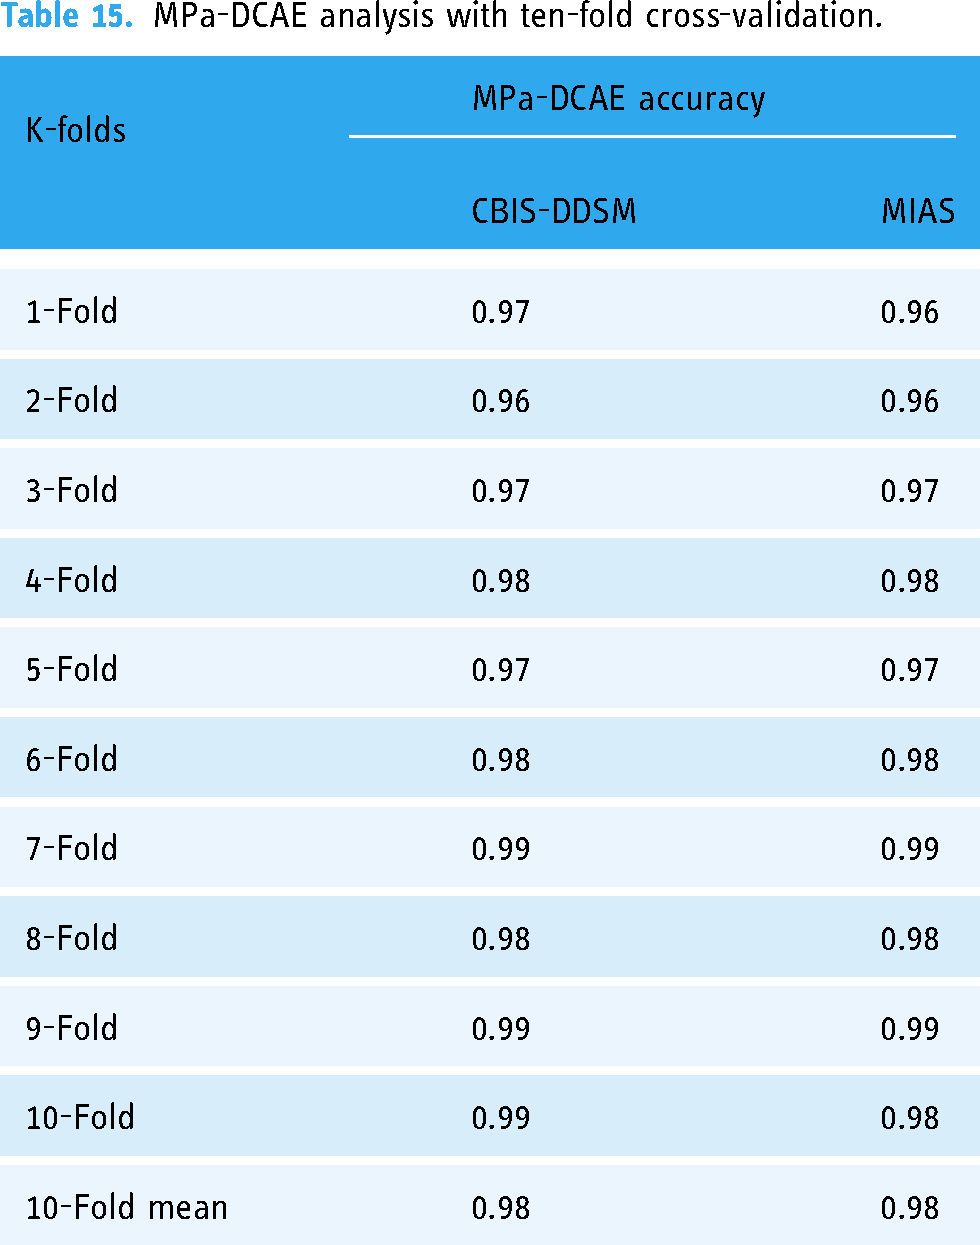
The accurate categorization of breast cancer in pathology images is largely dependent on the architecture of the VGG19 deep convolutional neural network framework. The model's resilience and reliability are suggestively improved by utilizing 10-fold cross-validation. Cross-validation is a statistical system wherein the dataset is divided into ten segments, or subsets, of which one is designated for validation and nine are used for training determinations. VGG19, with its deep layers and hierarchical feature extraction capabilities, can efficiently discern problematic patterns and structures within breast tissue images, assisting in the detection and classification of cancerous cells with great accuracy. VGG19 trains on vast datasets of annotated pathology images to differentiate small visual signals suggestive of many malignant diseases, permitting physicians to create more informed diagnostic decisions. The outstanding efficiency of this model has contributed to the improvement of computer-aided diagnosis systems, which has improved the precision and consistency of breast cancer identification and categorization. Applying 10-fold cross-validation to our dataset, our proposed MPa-DCAE model demonstrated impressive efficiency; on the MIAS dataset, it achieved 98.95% accuracy and on the CBIS-DDSM dataset, 98.36% accuracy which is shown in Table 15. Recovered patient outcomes are a direct result of this achievement.
MPa-DCAE analysis with ten-fold cross-validation.
Conclusion
In conclusion, a likely technique for rising breast cancer classification in pathology images is to employ multi-patch-based deep learning systems that integrate DCAE with VGG19 architecture. By using convolutional neural networks, we can extract complex information from many image patches and leverage this technology to progress the ability to distinguish among benign and malignant tissues. We develop the reliability and precision of the classification procedure by combining VGG19 with DCAE, which may result in significant improvements in the identification and management of breast cancer. By combining DL with medical image analysis, this innovative method has the potential to improve patient care standards and optimize results in breast cancer pathology. Looking forward, continued study and improvement of these methods will be pivotal in developing diagnostic precision, paving the way for more efficient treatment programs and better-quality patient outcomes. Additionally, while the model performs well on the CBIS-DDSM and MIAS datasets, its generalizability to other datasets with different imaging characteristics remains to be validated. Future studies should examine ways to improve the multi-patch approach's computing efficiency, such as by reducing the model size through knowledge distillation or by using lightweight architectures. Furthermore, adding transfer learning strategies and broadening the evaluation to encompass additional datasets may enhance the model's generalizability even further.
Footnotes
Acknowledgements
We thank all the authors for their research contributions.This study is supported via funding from Prince sattam bin Abdulaziz University project number (PSAU/2024/R/1445).
Contributorship
Conceptualization: A.P., P.N., D.B., P.N.S.; methodology: J.S., W.K.,M.F.I.; software: A.P., P.N., D.B., P.N.S.; validation: A.P., P.N., D.B., P.N.S., J.S., W.K.,M.F.I.; formal analysis: A.P., P.N., D.B., P.N.S.; investigation: A.P., P.N., D.B., P.N.S.; resources: J.S., W.K.,M.F.I.; data curation: A.P., P.N., D.B., P.N.S., J.S., W.K.,M.F.I.; writing—original draft preparation: A.P., P.N., D.B., P.N.S.; writing—review and editing: J.S., W.K., M.F.I.; visualization: A.P., P.N., D.B., P.N.S.; supervision: J.S., W.K., M.F.I.; project administration: J.S., W.K., M.F.I.; funding acquisition: J.S., W.K., M.F.I.; all authors have read and agreed to the published version of the manuscript.
Data availability
Publically available datasets are used in this study. https://www.cancerimagingarchive.net/collection/cbis-ddsm/. https://www.repository.cam.ac.uk/items/b6a97f0c-3b9b-40ad-8f18-3d121eef1459
Declaration of conflicting interests
The authors declared no potential conflicts of interest with respect to the research, authorship, and/or publication of this article.
Funding
The authors disclosed receipt of the following financial support for the research, authorship, and/or publication of this article: This research was supported by the National Research Foundation of Korea (NRF) grant funded by the Korea government (MSIT: Ministry of Science and ICT) (No. RS-2023-00239877).