
Abstract
Background
Pancreaticoduodenectomy carries substantial metabolic consequences, with 20–32% of patients developing new-onset diabetes mellitus (NODM) within three years, leading to increased morbidity and healthcare burden. Current predictive models relying primarily on clinical variables demonstrate limited accuracy, underutilizing tissue-level information available in routine CT imaging. This study aimed to develop and validate a multimodal machine learning framework integrating clinical data with CT-derived radiomics features for long-term NODM risk prediction.
Methods
This retrospective cohort study analyzed 126 patients who underwent pancreaticoduodenectomy at Gachon University Gil Medical Center (2005–2023). Using PyRadiomics, 186 radiomic features were extracted from preoperative and postoperative CT scans (93 features per timepoint). Combined with 10 clinical variables (196 total features), Recursive Feature Elimination identified 10 key predictors. Logistic Regression, Support Vector Machine, Random Forest, and Extreme Gradient Boosting were evaluated using 5-fold cross-validation. SHAP analysis ensured model interpretability.
Results
Long-term NODM developed in 47 patients (37.3%). The Logistic Regression model demonstrated optimal performance with AUC 0.77 (95% CI: 0.68–0.84), sensitivity 70% (95% CI: 0.57–0.83), and specificity 72% (95% CI: 0.62–0.82). Key predictors included pancreatic volume changes, preoperative hypertension, and texture features (Strength, GrayLevelNonUniformity) from both imaging timepoints. The multimodal approach significantly outperformed clinical-only models (P < .05). Subgroup analyses confirmed consistent model performance across gender (P = .72) and age groups (P = .83).
Conclusions
The proposed approach that integrates CT radiomics with clinical data quantitatively improved the prediction performance for NODM after pancreatectomy. This multimodal strategy offers a more robust alternative to single-modality models and may facilitate personalized risk stratification and targeted postoperative surveillance.
Keywords
Introduction
Pancreaticoduodenectomy (PD), widely known as the Whipple procedure, stands as the primary surgical treatment for malignancies in the pancreatic head and periampullary region. 1 While this extensive operation is often the only path to a cure, it comes at a significant cost: the removal of substantial pancreatic tissue drastically alters both endocrine and exocrine physiology. The resulting disruption leaves patients with a considerable risk of developing new-onset diabetes mellitus (NODM). Recent epidemiological data suggests that within three years of surgery, between 20% and 32% of patients will transition to a diabetic state, driving up infection rates, cardiovascular morbidity, and long-term healthcare expenditures.2,3 Clinically classified as type 3c diabetes mellitus (T3cDM), this condition is mechanistically distinct from type 1 or type 2 diabetes. It stems from a complex interplay of islet cell loss, cytokine-induced β-cell dysfunction, and compromised incretin signaling, requiring a unique management approach. 4
To manage these risks proactively, clinicians need accurate tools to predict long-term NODM, and numerous previous studies have actively proposed various approaches to address this need. Unfortunately, the predictive models currently available have significant limitations. Most rely heavily on basic clinical and laboratory metrics—such as age, BMI, and fasting glucose—while largely ignoring the subtle, tissue-level changes taking place in the remnant pancreas.5,6 Furthermore, while patients routinely undergo CT imaging before and after surgery, the rich quantitative data embedded in these scans is almost never utilized for risk stratification. Consequently, the performance of existing models remains modest, with C-indices of 0.72–0.74 and AUCs around 0.745. 7 There is clearly substantial room to improve precision by integrating novel predictive biomarkers.
Radiomics offers a promising solution to address these gaps. By enabling the high-throughput extraction of quantitative data from medical images, radiomics can reveal tissue characteristics that visual assessment alone cannot detect. 8 Features derived from complex matrices—such as gray-level co-occurrence (GLCM), run-length (GLRLM), and size zone (GLSZM)—allow us to quantify texture patterns and tissue heterogeneity that often precede clinical symptoms. 9 The utility of this approach in pancreatic disease is already becoming clear; radiomics-based machine learning models have demonstrated exceptional accuracy in cancer detection (AUC > 0.95) and outcome prediction. 10 Moreover, specific CT-derived markers like hepatic steatosis and pancreatic volume loss have been independently linked to post-pancreatectomy diabetes, providing a compelling rationale for incorporating radiomic features into NODM prediction frameworks. 11
To handle this high-dimensional data effectively, machine learning (ML) offers distinct advantages over traditional statistics. ML algorithms are particularly adept at modeling the complex, non-linear relationships that often exist between radiomic features and clinical outcomes. 12 Comparative research shows that algorithms like Random Forest (RF), Support Vector Machines (SVM), and Extreme Gradient Boosting (XGBoost) can outperform standard logistic regression when applied to clinical prediction tasks.13,14 Crucially, the “black box” nature of these models—often a barrier to clinical adoption—can be addressed through explainability techniques. Methods like Shapley Additive Explanations (SHAP) provide transparency, allowing clinicians to see exactly which features are driving a specific risk prediction. 15
In this study, we sought to build and validate a multimodal machine learning model capable of predicting long-term NODM risk after pancreaticoduodenectomy. Our approach integrates clinical data with radiomic features extracted from both preoperative and postoperative CT scans. By fusing quantitative imaging analysis with established clinical predictors inside an explainable ML framework, we aim to not only boost predictive accuracy but also generate actionable insights that can guide personalized postoperative care.
This study advances the field through several key contributions:
The rest of this article is structured as follows: Section 2 reviews the current literature on NODM epidemiology, existing prediction models, and the application of machine learning in diabetes research. Section 3 details our materials and methods, covering patient selection, data collection, radiomic feature extraction, and our modeling strategy. In Section 4, we present the results of our performance evaluation, feature importance analysis, and subgroup testing. Section 5 discusses the clinical implications of our findings, compares them with existing models, and outlines limitations and future directions. Finally, Section 6 summarizes our key conclusions and their potential impact on clinical practice.
Literature review
New-onset diabetes mellitus after pancreatic surgery
The metabolic consequences of pancreatic resection have drawn increasing attention in recent years, and for good reason. Large-scale registry studies now paint a concerning picture of post-surgical diabetes burden. Hamad et al. analyzed over 4200 patients from the Medicare database and found that pancreatogenic diabetes developed in 20.3% of cases at a median follow-up of just under 11 months—a figure that climbed to 32.2% by the three-year mark. 2 What makes these numbers particularly alarming is the associated mortality risk. Schranz et al. demonstrated that patients who developed NODM faced hazard ratios of 2.02 and 1.56 for one-year and two-year mortality, respectively. 3 These are not trivial statistics; they underscore the urgent need for better predictive tools.
Interestingly, the risk profile differs substantially depending on the type of surgery performed. Distal pancreatectomy (DP) appears to carry a higher metabolic burden than pancreaticoduodenectomy (PD). In a prospective study employing rigorous oral glucose tolerance testing, Imamura et al. reported a striking 74.1% cumulative diabetes incidence at 36 months post-DP. 16 Lee et al. provided further clarity by directly comparing the two procedures: DP conferred a 4.29-fold higher risk of NODM compared to PD, with notable differences in β-cell functional recovery. 17 These procedure-specific variations highlight why a one-size-fits-all prediction model may fall short.
Understanding the pathophysiology behind these numbers is equally important. Type 3c diabetes mellitus—the formal classification for pancreatogenic diabetes—is not simply a matter of losing insulin-producing cells. Wayne et al. provided a comprehensive review of the multifactorial mechanisms involved: direct islet loss, cytokine-mediated β-cell dysfunction, hepatic insulin resistance, and disruption of the incretin axis all play interconnected roles. 4 This mechanistic complexity suggests that prediction models capturing only clinical variables may miss important tissue-level changes that precede overt diabetes.
Existing predictive models and their limitations
Several research groups have attempted to develop clinical prediction tools for post-pancreatectomy diabetes, with varying degrees of success. Chen et al. constructed a nomogram specifically for NODM prediction after distal pancreatectomy, incorporating age, BMI, resection length, intraoperative blood loss, and splenectomy status. The model achieved a C-index of 0.739 in the training cohort and 0.719 in external validation—respectable but hardly definitive. 5 Similarly, Wang et al. demonstrated that combining preoperative and postoperative fasting blood glucose measurements could yield an AUC of 0.745 for diabetes prediction in patients with pancreatic ductal adenocarcinoma, compared to 0.623 for postoperative FBG alone and 0.588 for preoperative FBG alone. 7
The common thread running through these models is their heavy reliance on clinical and laboratory variables alone. While such parameters are readily available and easy to collect, they may not capture the full picture. Kato et al. identified preoperative HbA1c levels, main pancreatic duct dilatation, and pancreatic atrophy as significant predictors of long-term pancreatic insufficiency—notably, two of these three factors are imaging-derived. 6 This observation points to a critical gap: the quantitative information embedded in routine CT scans remains largely untapped for metabolic risk stratification. Bridging this gap could substantially enhance our predictive capabilities.
Radiomics in pancreatic disease and diabetes prediction
Radiomics has emerged as a powerful approach for extracting hidden information from medical images. Unlike traditional qualitative assessment, radiomics systematically mines quantitative features that reflect tissue heterogeneity, texture patterns, and microstructural changes invisible to the human eye. 8 The potential of this technology in pancreatic disease has been demonstrated convincingly. In a landmark study, Mukherjee et al. developed a radiomics-based machine learning model capable of detecting pancreatic cancer on CT scans obtained up to three years before clinical diagnosis, achieving an impressive AUC of 0.98. 10 If subtle pre-malignant changes can be detected this early, it stands to reason that pre-diabetic parenchymal alterations might also be identifiable.
Direct evidence supporting radiomics for NODM prediction is beginning to accumulate. Donovan et al. analyzed 426 patients undergoing pancreatic resection and identified several CT-derived predictors of post-surgical diabetes, including hepatic steatosis (OR 1.777), pancreatic volume reduction (OR 0.989 per cubic centimeter), and visceral adipose tissue volume. 11 These findings are particularly relevant because they demonstrate that imaging biomarkers can provide independent predictive value. Yamazaki et al. further strengthened this evidence by showing a robust correlation between remnant pancreatic volume and C-peptide index (ρ=0.619, P = .008), establishing a clear physiological link between imaging features and endocrine function. 18
The technical foundation for radiomic analysis rests on well-established mathematical frameworks. Texture features derived from gray-level co-occurrence matrices (GLCM), run-length matrices (GLRLM), and size zone matrices (GLSZM) quantify spatial relationships between pixel intensities, capturing patterns that correlate with underlying histopathology. 19 Recent reviews by Zeng et al. and Spilseth et al. have comprehensively summarized the imaging characteristics of diabetic pancreata—including decreased volume, altered signal intensity, and fatty infiltration—while highlighting the untapped potential of radiomics for metabolic prediction.20,21 Importantly, standardization efforts through the Image Biomarker Standardisation Initiative (IBSI) have established consensus definitions and benchmark values, facilitating reproducibility across studies. 9
Machine learning approaches for diabetes prediction
The intersection of machine learning and diabetes care has been a fertile area of research. Oikonomou and Khera provided a comprehensive overview of ML applications spanning diagnosis, prognostication, phenotyping, and treatment optimization, while thoughtfully addressing methodological standards and bias mitigation strategies. 12 What emerges from this literature is a clear picture: ML algorithms can handle high-dimensional data more effectively than traditional regression and are capable of capturing complex, non-linear relationships between predictors and outcomes.
Head-to-head comparisons between algorithms have yielded valuable insights. A meta-analysis by Zhang et al. pooled data from 25 studies on gestational diabetes prediction and found that non-logistic ML models achieved a pooled AUROC of 0.8891, compared to 0.8151 for logistic regression—a meaningful improvement. 13 More recently, Riveros Perez and Avella-Molano compared multiple algorithms for type 2 diabetes prediction and found XGBoost at the top (AUC 0.8168), followed by Random Forest and Logistic Regression, with SVM showing the highest sensitivity but lower overall accuracy. 14 These findings inform algorithm selection and suggest that ensemble methods may offer advantages in certain prediction contexts.
Feature selection is another critical consideration when dealing with high-dimensional radiomic data. Recursive Feature Elimination (RFE) and LASSO regularization are commonly employed techniques. Warkentin et al. applied LASSO to over 2000 radiomic features for pulmonary nodule classification and achieved an AUC of 0.93, demonstrating the effectiveness of regularization-based approaches in radiomics. 22 Equally important is model interpretability. The clinical adoption of ML tools hinges on transparency, and methods like SHAP (Shapley Additive Explanations) have become the gold standard for explaining individual predictions. 23 Kui et al. exemplified this approach by developing an XGBoost model with SHAP analysis for severe acute pancreatitis prediction (AUC 0.81) and deploying it as a clinical web application—a template for translational ML research. 24
Multimodal data integration: lessons from diabetes risk prediction research
While type 1 diabetes (T1D) and post-pancreatectomy diabetes (T3cDM) arise from distinct etiologies—autoimmune destruction versus surgical removal of pancreatic tissue—they share a fundamental pathophysiological endpoint: progressive β-cell dysfunction leading to insulin deficiency. This mechanistic convergence suggests that methodological advances in T1D risk prediction may offer valuable insights for NODM prediction, particularly regarding multimodal data integration strategies. Both conditions involve subclinical metabolic changes that precede overt hyperglycemia, creating an opportunity for early detection through quantitative biomarker analysis.
Recent work in T1D risk prediction illustrates the power of combining complementary data modalities. Montaser et al. demonstrated that a simple one-week continuous glucose monitoring (CGM) home test, when analyzed with support vector machine classification, could predict T1D immunological risk with an AUC of 0.88—using only post-meal glucose variability metrics. 25 The real breakthrough, however, came when the same group integrated CGM-derived glycemic features with genetic risk scores. This multimodal approach substantially improved classification performance, achieving an AUC of 0.93 compared to 0.80 when using all features without targeted selection—a relative improvement of approximately 16%. 26 The key insight from these studies is that different data types capture complementary aspects of disease biology: CGM reflects real-time metabolic function, while genetic scores capture underlying susceptibility.
These findings have been corroborated by other research groups. Cichosz et al. achieved AUCs of 0.91 for prediabetes and 0.97 for dysglycemia classification using XGBoost with CGM-derived glycemic variability indices. 27 A recent systematic review by Mittal et al. surveyed the landscape of AI/ML approaches for early diabetes detection and found that multimodal models incorporating CGM, genetic, and proteomic data could achieve AUCs as high as 0.993. 28
The analogy to our NODM prediction framework is direct and instructive. Just as CGM captures dynamic glycemic patterns reflecting underlying β-cell reserve in T1D risk assessment, CT-derived radiomic features can capture structural and textural changes in remnant pancreatic tissue that precede clinical diabetes after pancreatectomy. Both approaches leverage quantitative biosignals—temporal glucose patterns in one case, spatial image patterns in the other—to detect subclinical disease states. Furthermore, the demonstrated benefit of combining CGM with genetic data in T1D prediction parallels our strategy of integrating radiomic features with clinical variables: each data modality contributes unique, non-redundant information that enhances overall predictive accuracy. The principle is generalizable: when different data sources reflect distinct biological processes contributing to disease risk, their combination typically outperforms any single modality alone.
Current gaps and study rationale
Despite the advances reviewed above, several important gaps remain in the field of post-pancreatectomy diabetes prediction. First, while radiomics has proven valuable for cancer detection and prognosis, its application to metabolic outcome prediction after pancreatic surgery remains largely unexplored. Second, existing NODM prediction models rely almost exclusively on clinical variables, missing the tissue-level information encoded in routine imaging. Third, and perhaps most importantly, no study has systematically leveraged the comparison between preoperative and postoperative radiomic features to capture surgery-induced changes predictive of diabetes risk. Current models achieve discrimination indices ranging from C-index 0.719–0.739 5 to AUC 0.745, 7 leaving considerable room for improvement.
The present study addresses these gaps head-on. Building on the multimodal integration principles demonstrated in T1D risk prediction, we develop a machine learning model that combines radiomic features from sequential CT imaging with established clinical predictors. By employing explainable ML techniques, we aim to not only improve predictive accuracy but also provide clinically interpretable insights into the factors driving long-term NODM risk after pancreaticoduodenectomy. If successful, this approach could enable proactive identification of high-risk patients and inform personalized postoperative surveillance strategies.
Materials and methods
Development environment
The experiments in this study were conducted using a system equipped with an NVIDIA GeForce GTX 1050Ti (NVIDIA, Santa Clara, CA), an Intel® Core™ i9-10900 (Intel, Santa Clara, CA), and 32 GB of RAM. All experiments were performed on a 64-bit CPU using Python (version 3.7.0; Python Software Foundation, Wilmington, DE). Model training was conducted using a framework based on Scikit-learn (version 1.0.2), PyRadiomics (version 3.0.1), opencv-python (version 4.6.0), and shap (version 0.46.0) libraries. Statistical analyses were performed using MedCalc (version 19.6.1; MedCalc Software, Ostend, Belgium).
Data collection
This retrospective cohort study analyzed data from 126 patients who underwent pancreaticoduodenectomy at Gachon University Gil Medical Center between January 1, 2005, and December 31, 2023. Among these patients, 47 developed diabetes more than 6 months after surgery, as defined by fasting blood glucose levels of 126 mg/dL or higher, while 79 did not develop diabetes during the follow-up period. The collected data included abdominal CT images taken preoperatively and between 3 and 6 months postoperatively, as well as clinical information directly recorded by healthcare professionals.
Patients who underwent pancreaticoduodenectomy for neoplastic lesions without distant metastases at the time of surgery were included in the study. The age range of patients was between 20 and 85 years. Patients with a history of type 1, type 2, or pancreatic diabetes prior to surgery were excluded from the study. CT images were acquired using Siemens SOMATOM Definition Edge scanners with tube voltages ranging from 80 to 150 kVp and tube currents ranging from 51 to 641 mA. The slice thickness ranged from 3 to 5 mm, and the pixel spacing was between 0.58 and 0.97 mm.
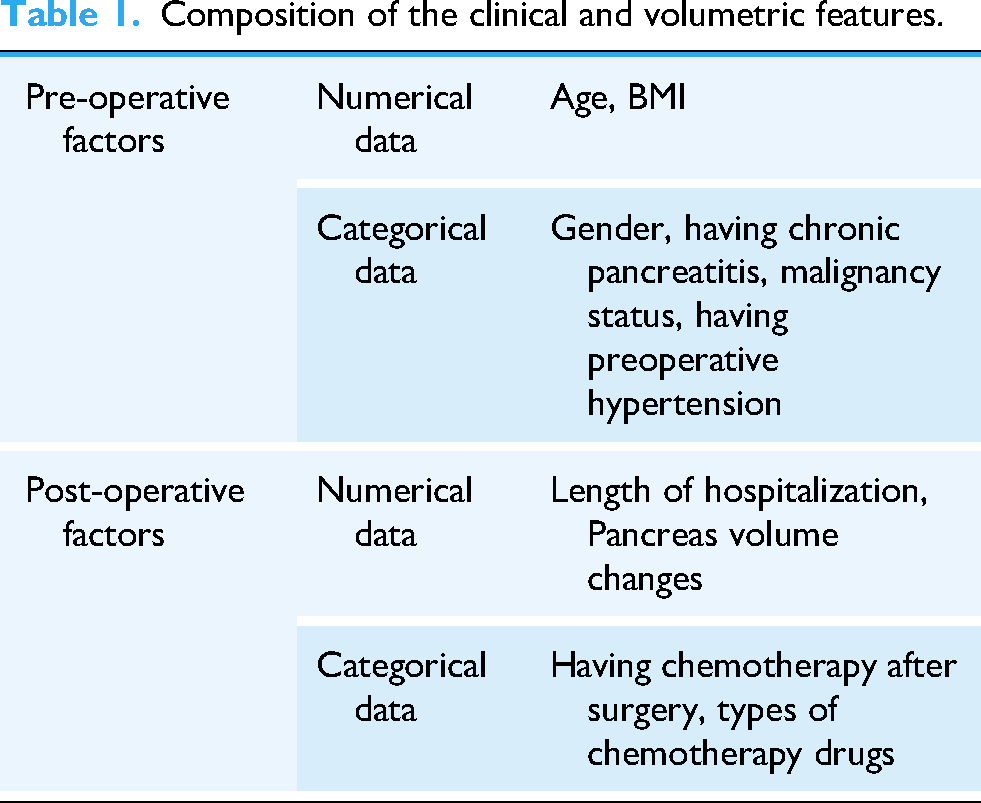
The clinical data included ten variables: sex, age, BMI, length of hospital stay, history of chronic pancreatitis before surgery, presence of hypertension before surgery, malignancy of the lesion, administration of postoperative chemotherapy, type of chemotherapy, and changes in pancreatic volume before and after surgery as shown in Table 1. Changes in pancreatic volume were calculated manually from CT images, and the length of hospital stay was defined as the period from the date of surgery to the date of discharge. Chemotherapy regimens included gemcitabine, 5-FU + leucovorin, and FOLFIRINOX.
Composition of the clinical and volumetric features.
Feature extraction and selection
The step-by-step workflow of the study is illustrated in Figure 1. All CT images were manually labeled for the pancreatic region in 2D slices, and the labeling results were cross-validated by a hepatobiliary surgeon. 29 The mask images of the labeled regions and original CT images were resized to 512 × 512 pixels for analysis.

Schematic overview of the study workflow.
Quantitative radiomic features were extracted from pancreatic regions using multiple methods. These included 18 features based on first-order statistics describing histogram characteristics, 24 features from the Gray Level Co-occurrence Matrix analyzing inter-pixel relationships, 16 features from the Gray Level Run Length Matrix identifying contiguous pixels with identical gray levels, 16 features from the Gray Level Size Zone Matrix analyzing pixel cluster intensity and scale, 5 features from the neighboring gray tone difference matrix evaluating intensity correlation, and 14 features from the Gray Level Dependence Matrix describing gray-level dependencies.30–33 A total of 93 features were extracted.
Clinical data were divided into categorical and numerical variables. Categorical variables were mapped to integers and converted to the corresponding numbers, whereas all variables were normalized to a range between 0 and 1 to ensure compatibility with the machine learning input. The dependent variable, fasting glucose, was binary coded as 1 for diabetes (≥126 mg/dL) and 0 otherwise.
A total of 196 features, including 93 from preoperative CT images, 93 from postoperative CT images, and 10 clinical features, were refined using Recursive Feature Elimination (RFE) to select the most significant features.34,35 RFE is an iterative feature selection method that recursively removes the least important features based on model coefficients (for Logistic Regression) or feature importances (for three-based models), ranking features by their contribution to predictive performance. The algorithm was configured to identify the optimal subset of features by minimizing cross-validation error.
To prevent data leakage, feature selection was performed independently within each training fold of the 5-fold cross-validation process. Ten key features were consistently identified across folds, which included Strength, 90Percentile, GrayLevelNonUniformity, and ClusterProminence from preoperative CT images; Strength, RunVariance, ZonePercentage, and SizeZoneNonUniformity from postoperative CT images; changes in pancreatic volume before and after surgery; and the presence of hypertension before surgery.
Model training and validation
The machine learning classification models employed in this study included LR, SVM, RF, and XGB. LR is a well-established method for binary classification that estimates class probabilities using a logistic (sigmoid) function. 36 SVM, introduced by Vapnik and Chervonenkis in 1963, is a classification model that transforms nonlinear inputs into higher-dimensional linear spaces using kernel functions.37,38 RF, developed by Breiman in 2001, is an ensemble model designed to prevent overfitting while maintaining statistical efficiency. 39 XGB is an improved version of Gradient Tree Boosting that incorporates techniques to prevent overfitting and to accelerate classification through parallel learning. 40
The hyperparameters for each model were optimized using Grid Search with 5-fold cross-validation. 41 The optimal parameters identified were: LR (C = 10, max_iter=5000, penalty = l2, solver = liblinear); SVM (C = 10, gamma=0.1, probability = true); RF (max_depth=6, min_samples_split=25, n_estimators=400); and XGB (learning_rate=0.1, max_depth=8, n_estimators=400). Detailed optimization procedures and parameter search ranges are available from the corresponding authors upon reasonable request to facilitate reproducibility.
Model performance was evaluated using 5-fold cross-validation with balanced metrics, including AUC, sensitivity, and specificity, which are appropriate for imbalanced datasets and less sensitive to class distribution than accuracy alone. The dataset exhibited class imbalance (37.3% NODM vs 62.7% non-NODM), making these balanced evaluation metrics particularly suitable for assessing model performance.
Statistic analysis
To evaluate the statistical significance between the diabetes and control groups, continuous variables were analyzed using the independent samples t-test, whereas categorical variables were analyzed using the chi-square test.
Comparison of AUC values between different machine learning models was performed using DeLong's test for correlated ROC curves. 42 This non-parametric test accounts for the correlation between AUCs derived from the same dataset and provides a statistically rigorous method for comparing model performance. Statistical significance was defined as P < .05.
The importance of each independent variable in predicting diabetes was quantified using permutation importance, which was implemented using Scikit-learn algorithms.
43
The importance score (
The relationships between all independent variables and the prediction results of the four models were further analyzed using SHAP values. SHAP (Shapley Additive exPlanations) values, derived from cooperative game theory, address the “black-box” problem in artificial intelligence models by illustrating the impact and directionality of each variable. 15
Results
Demographics of dataset
This study included 126 patients who underwent pancreaticoduodenectomy without a prior diagnosis of diabetes mellitus. The clinical and volumetric features used in this study are summarized in Table 1. Of these patients, 47 developed long-term NODM postoperatively, whereas 79 remained non-diabetic during the follow-up period. The baseline demographic and clinical characteristics of both groups are presented in Table 2 (preoperative factors) and Table 3 (postoperative factors).
Baseline preoperative characteristics of patients undergoing pancreaticoduodenectomy.

Comparison of postoperative characteristics between NODM and non-NODM groups.

The mean age across all patients was 63.1 years, with no significant difference between the NODM (63.47 ± 9.58 years) and non-NODM (62.86 ± 11.91 years) groups (P = .77). Similarly, other factors such as sex distribution and BMI showed no significant differences between the two groups (P > .05). However, a significantly higher proportion of the NODM group received postoperative chemotherapy than the non-NODM group (P < .01), as detailed in Table 3. This finding suggests that chemotherapy may be associated with an increased risk of long-term NODM, potentially owing to its impact on pancreatic function.
Prediction models performance
To predict long-term NODM risk, we developed four machine learning models–LR, SVM, RF, and XGB–using clinical and radiomic features. The performance of each machine learning model was evaluated using 5-fold cross-validation. The results, including sensitivity, specificity, accuracy, and AUC, are summarized in Table 4.
Performance metrics of machine learning models for NODM prediction.
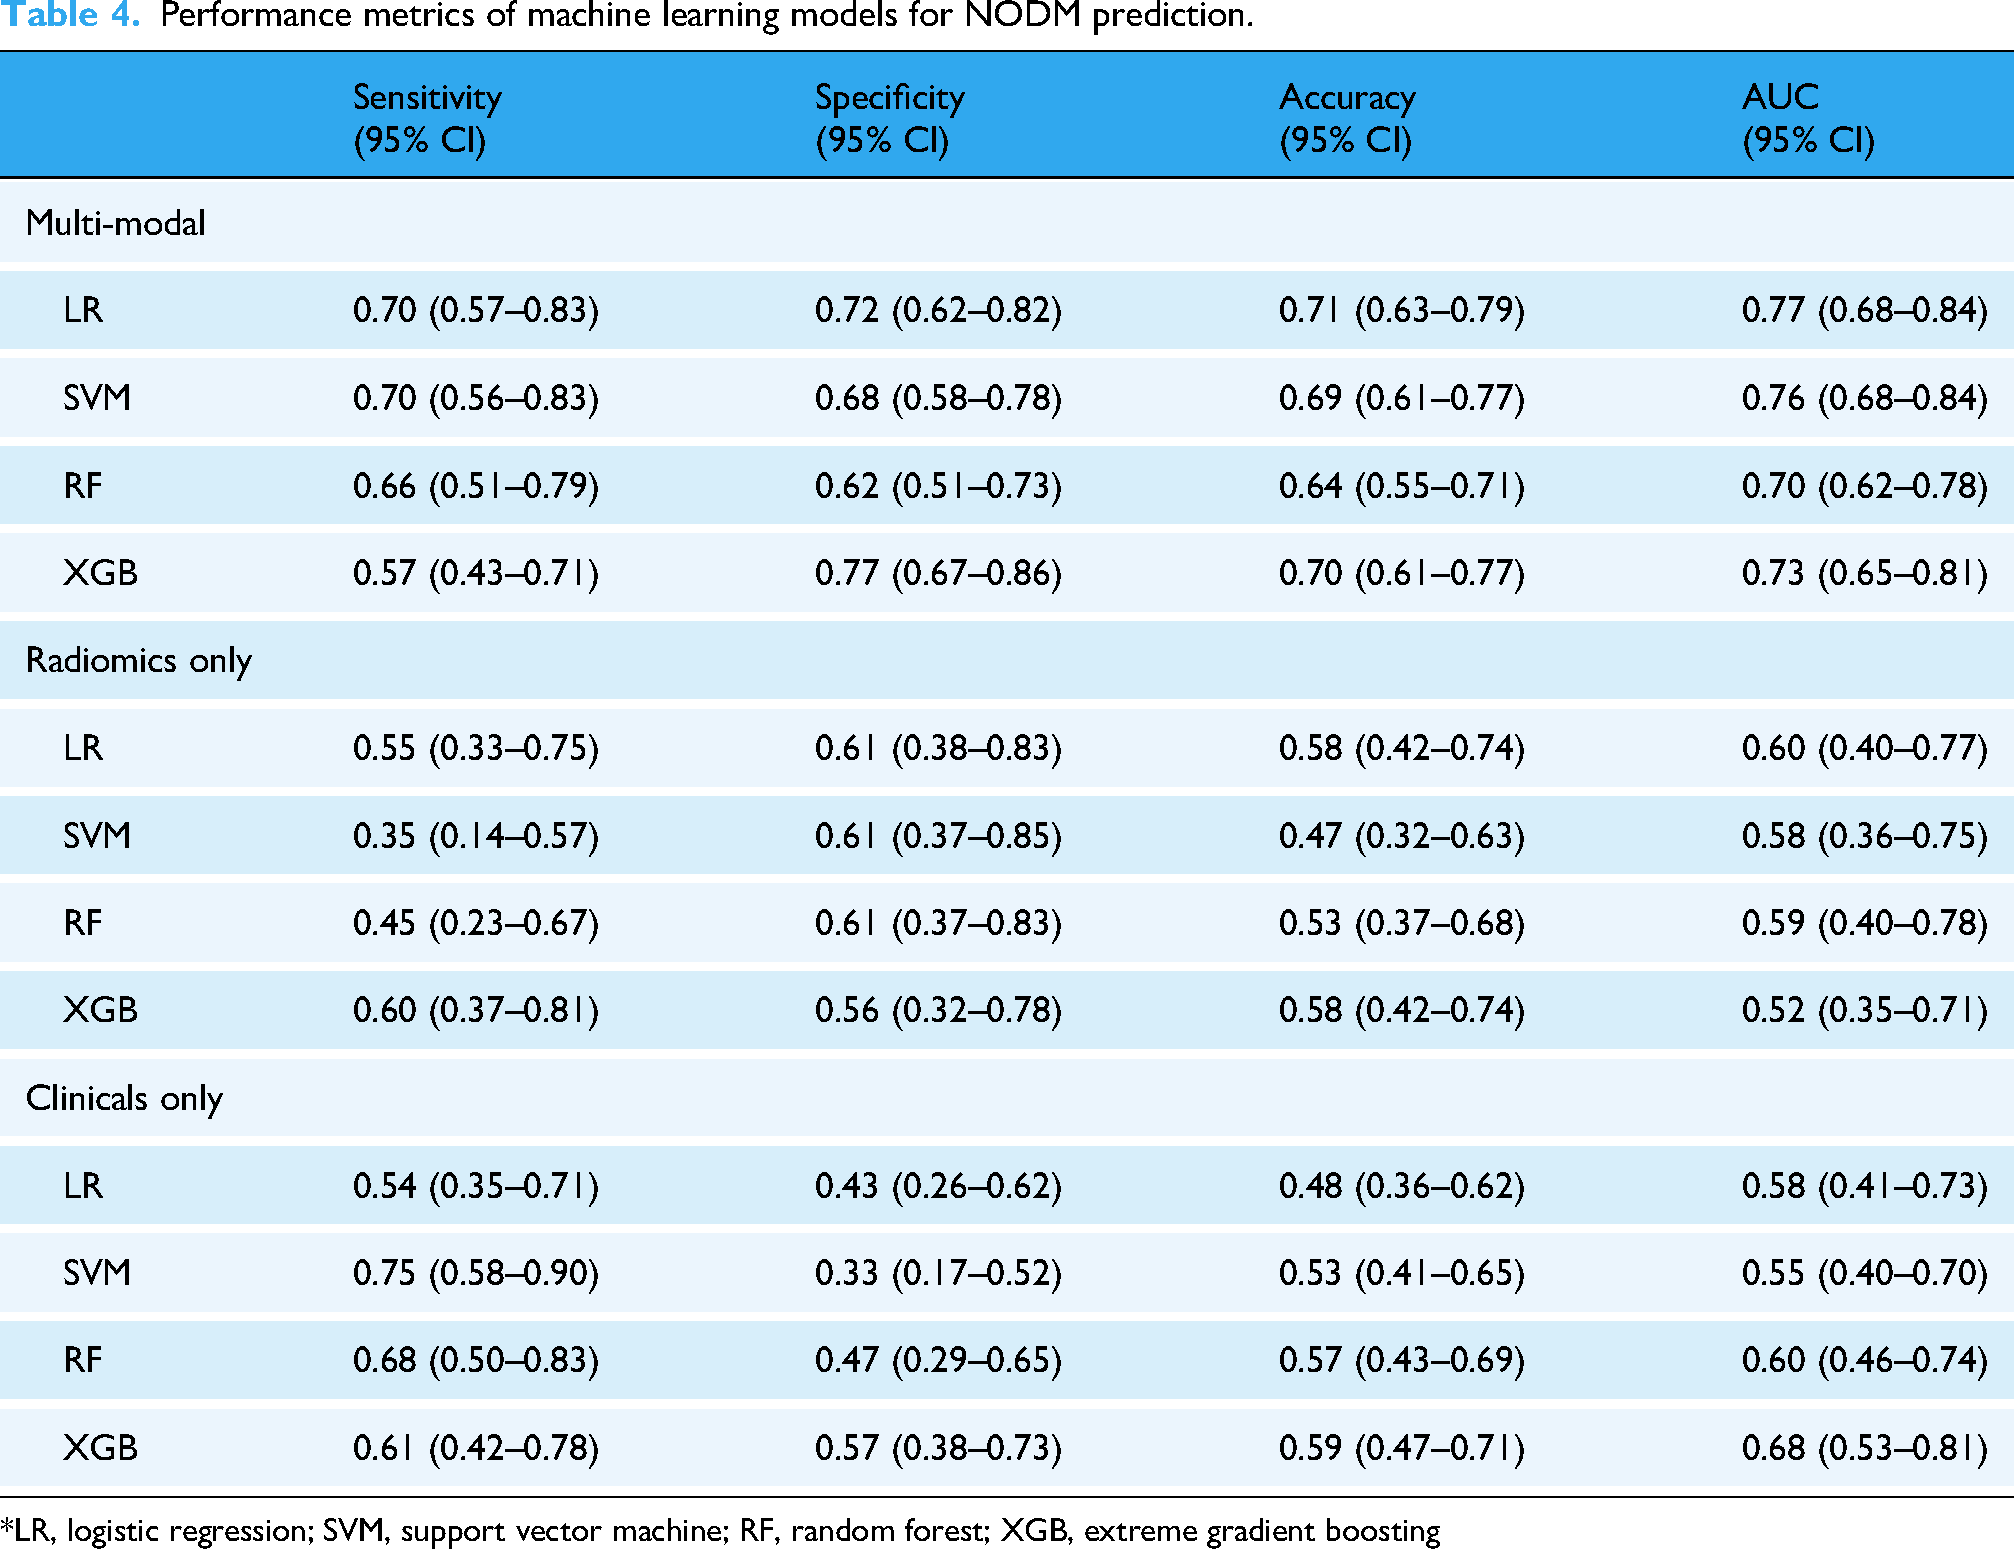
*LR, logistic regression; SVM, support vector machine; RF, random forest; XGB, extreme gradient boosting
The LR model demonstrated the highest predictive performance with an AUC of 0.77 (95% CI: 0.68–0.84), indicating good discriminatory power in this patient population. The SVM model followed closely with an AUC of 0.76 (95% CI: 0.68–0.84), suggesting that both models performed similarly in distinguishing between NODM and non-NODM cases. LR showed a sensitivity of 70% (95% CI: 0.57–0.83) and a specificity of 72% (95% CI: 0.62–0.82), resulting in an overall accuracy of 71%.
In contrast, the RF and XGB models showed lower AUC values of 0.70 (95% CI: 0.62–0.78) and 0.73 (95% CI: 0.65–0.81), respectively, indicating reduced predictive ability for these models compared with LR and SVM. The ROC curves for all four models are depicted in Figure 2, demonstrating that LR and SVM achieved superior discrimination between NODM and non-NODM cases compared to RF and XGB. In the ROC comparison of the four models, LR and SVM, unlike XGB, showed statistically significant differences compared with RF, with P-values of .02 and .03, respectively. Additionally, conventional multivariable logistic regression using the same 10 features exhibited model instability with extreme coefficients and uninterpretable odds ratios, as detailed in Supplementary Table 1.

Comparison of ROC curves of machine learning models for NODM prediction, (a) multimodal model, (b) radiomics-based model, (c) clinical-data-based model.
Feature importance
To better understand which factors contributed the most to long-term NODM prediction, we conducted feature importance analyses using SHAP values and permutation importance methods across all models tested. Radiomic features such as Strength, GrayLevelNonUniformity, and ClusterProminence were identified as significant predictors of NODM risk—features that capture subtle textural variations within the pancreatic tissue that may reflect underlying pathological changes, such as fibrosis or inflammation associated with diabetes development. Postoperative CT images revealed additional important features, such as SizeZoneNonUniformity and ZonePercentage, both indicative of changes in tissue homogeneity following surgery, which may be linked to impaired pancreatic function or regeneration capacity after resection (Figure 3).

ROC curves for demographic subgroup analysis; ROC curves of the multimodal logistic regression model across gender and age subgroups. (a) Male patients (n = 72, AUC=0.81, 95% CI:0.65–0.93, sensitivity 85%, specificity 55%); (b) female patients (n = 54, AUC=0.72, 95% CI: 0.63–0.89, sensitivity 79%, specificity 57%), P = .72 vs. male; (c) patients aged ≤65 years (n = 71, AUC=0.77, 95% CI: 0.60–0.88, sensitivity 64%, specificity 78%); (d) patients aged >65 years (n = 55, AUC=0.79, 95% CI: 0.63–0.93, sensitivity 88%, specificity 52%), P = .83 vs. age ≤65.
The mean feature importance values for the top 10 predictive variables across all models are presented in Figure 4, emphasizing the consistency of certain predictors, such as pancreatic volume changes, across models. The SHAP value analysis for individual predictions, highlighting the contribution of key features to long-term NODM risk prediction, is illustrated in Figure 5.

Top 10 most influential features in NODM prediction models
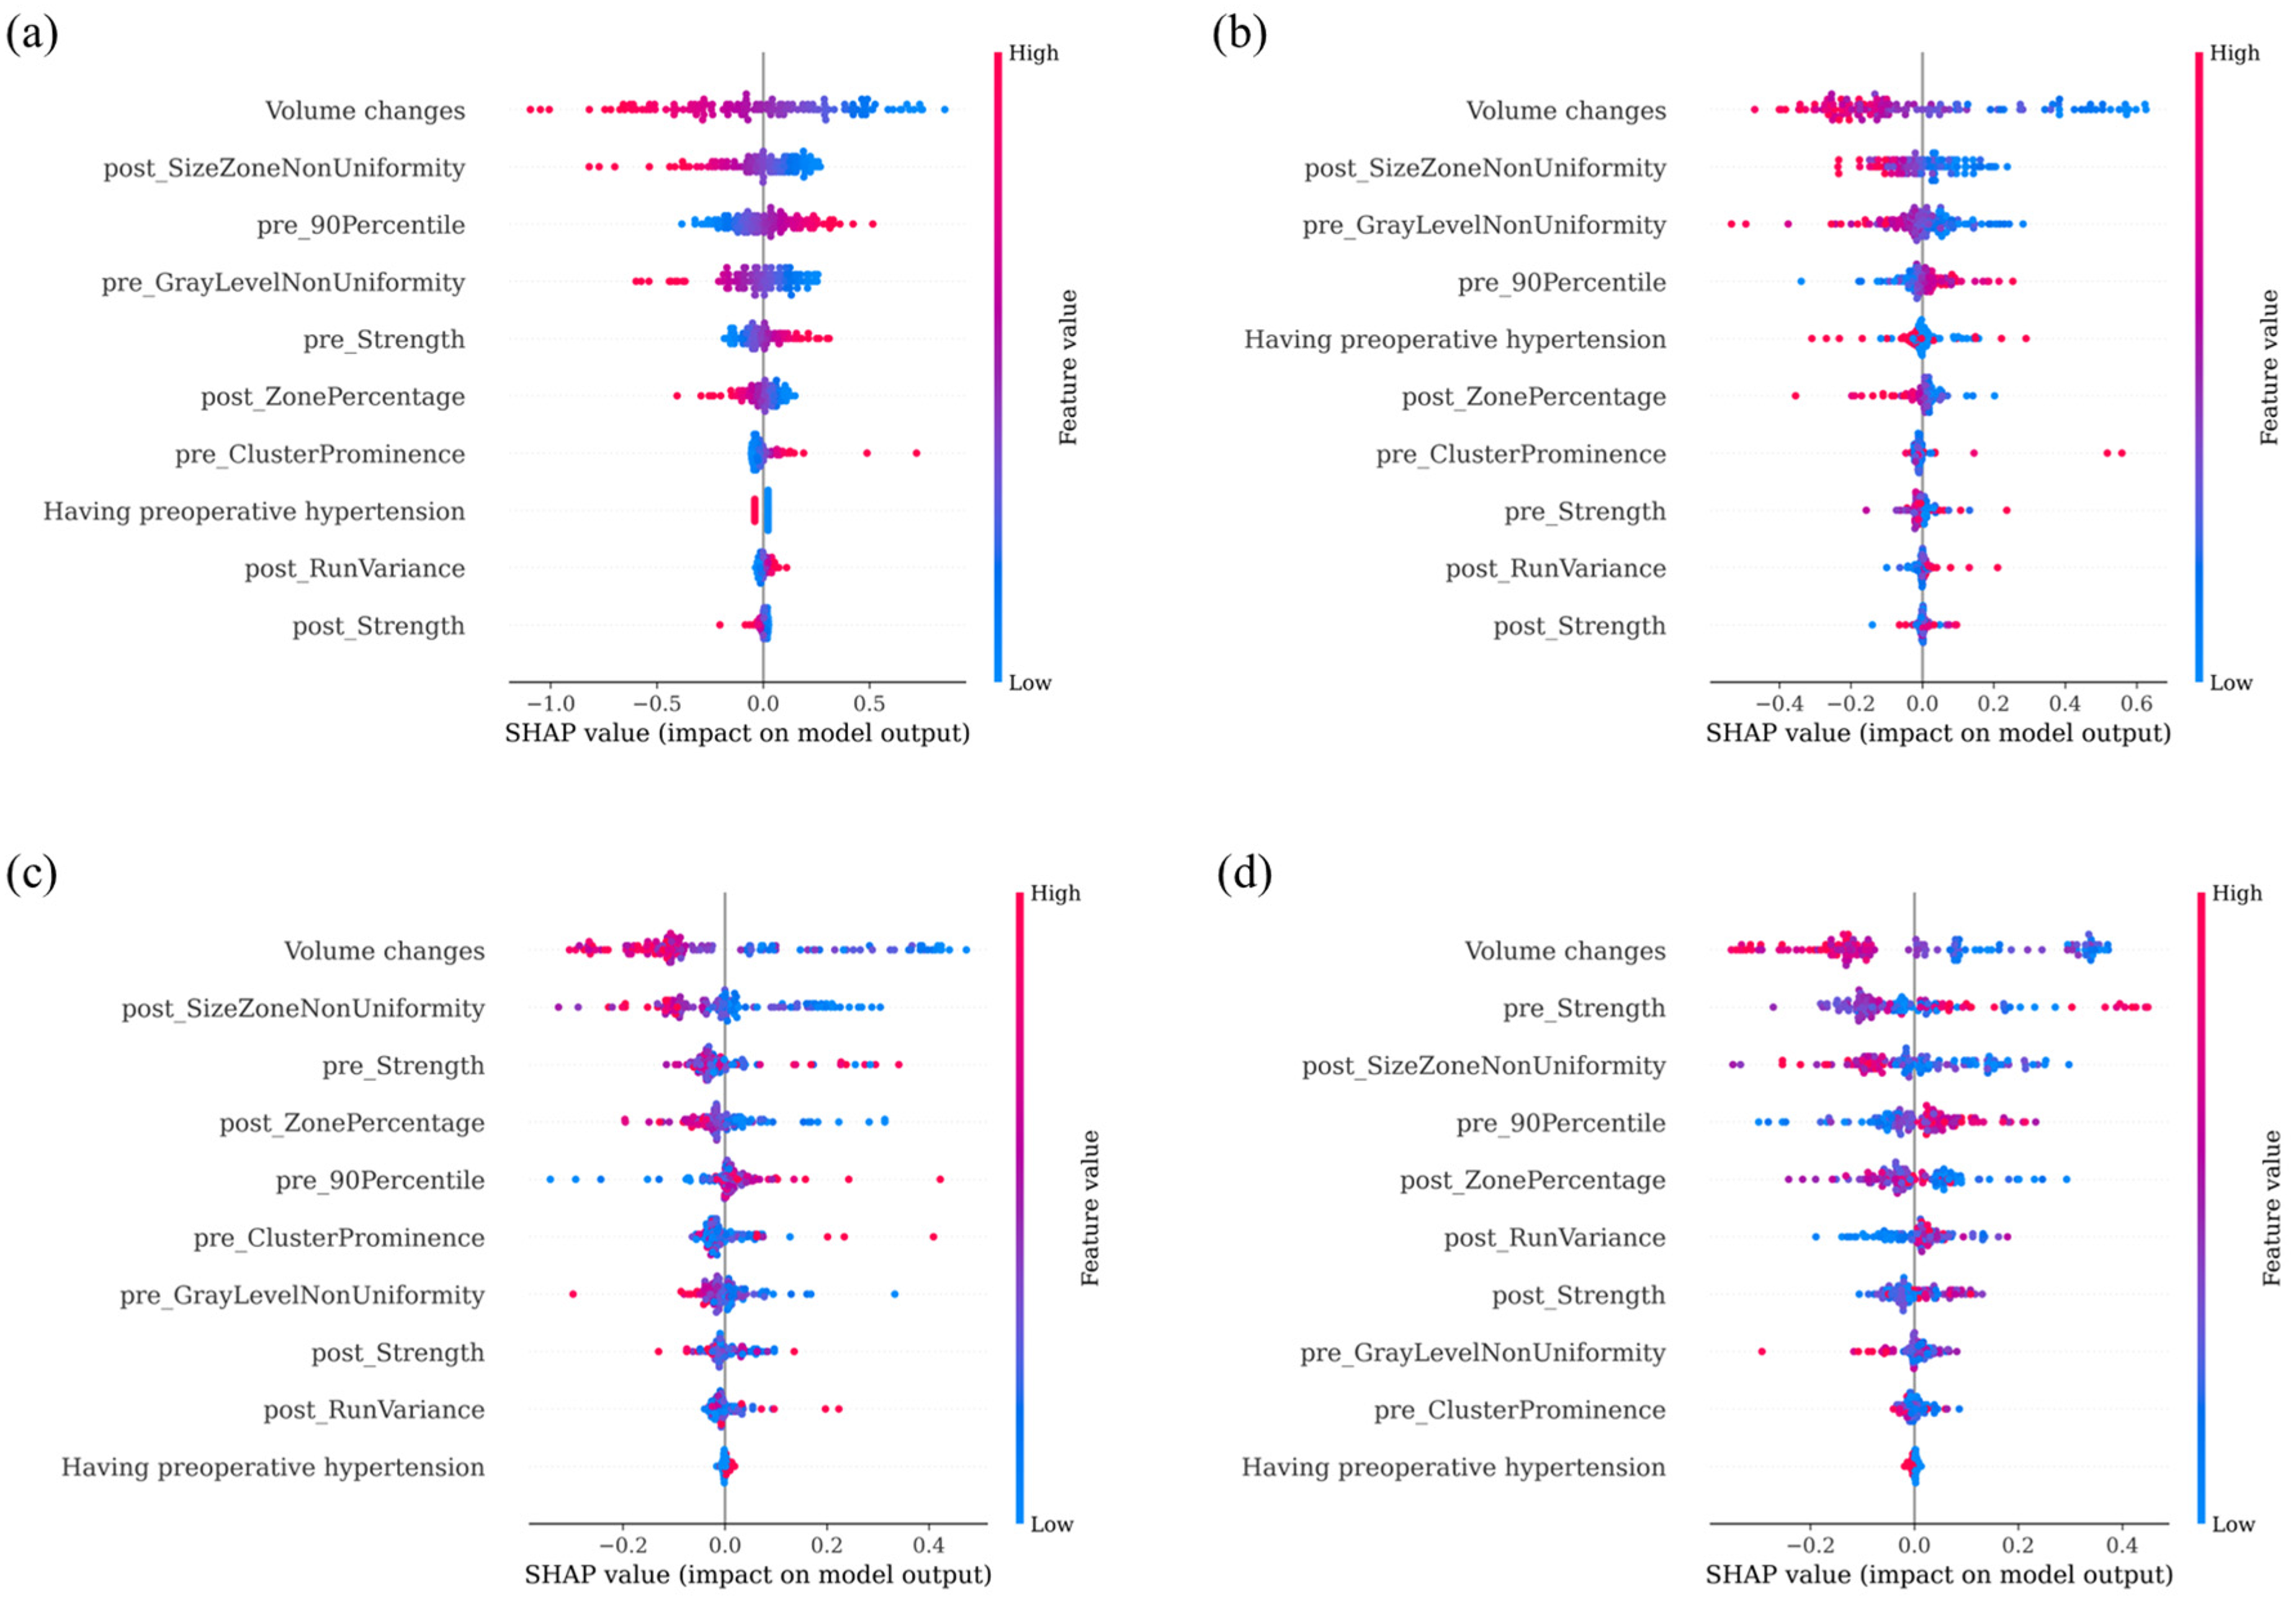
SHAP value analysis of feature importance across prediction models: (a) LR, (b) SVM, (c) RF, and (d) XGB* pre_Strength, A measure of the uniformity and magnitude of pixel intensity patterns, indicating structural coherence of pancreatic tissue in preoperative CT; post_SizeZoneNonUniformity, A GLSZM-derived feature quantifying variability in the size of homogeneous intensity zones in postoperative CT; post_ZonePercentage, A GLSZM feature representing the proportion of the image occupied by homogeneous intensity zones in postoperative CT; pre_90Percentile, The intensity value below which 90% of voxel intensities are distributed in preoperative CT; pre_GrayLevelNonUniformity, A GLRLM feature describing variability in gray-level values across the pancreatic region in preoperative CT; post_RunVariance, A GLRLM-derived feature capturing variance in run lengths of similar-intensity pixels in postoperative CT; pre_ClusterProminence, A GLCM feature reflecting the skewness and asymmetry of intensity clusters in preoperative CT; post_Strength, A measure of the uniformity and magnitude of pixel intensity patterns, indicating postoperative structural coherence of pancreatic tissue.
Subgroup analysis by gender and age
To evaluate the robustness and generalizability of the Logistic Regression model across demographic groups, we conducted subgroup analyses stratified by gender (male vs. female) and age (
Multimodal machine learning-based logistic regression performance by demographic subgroups. a
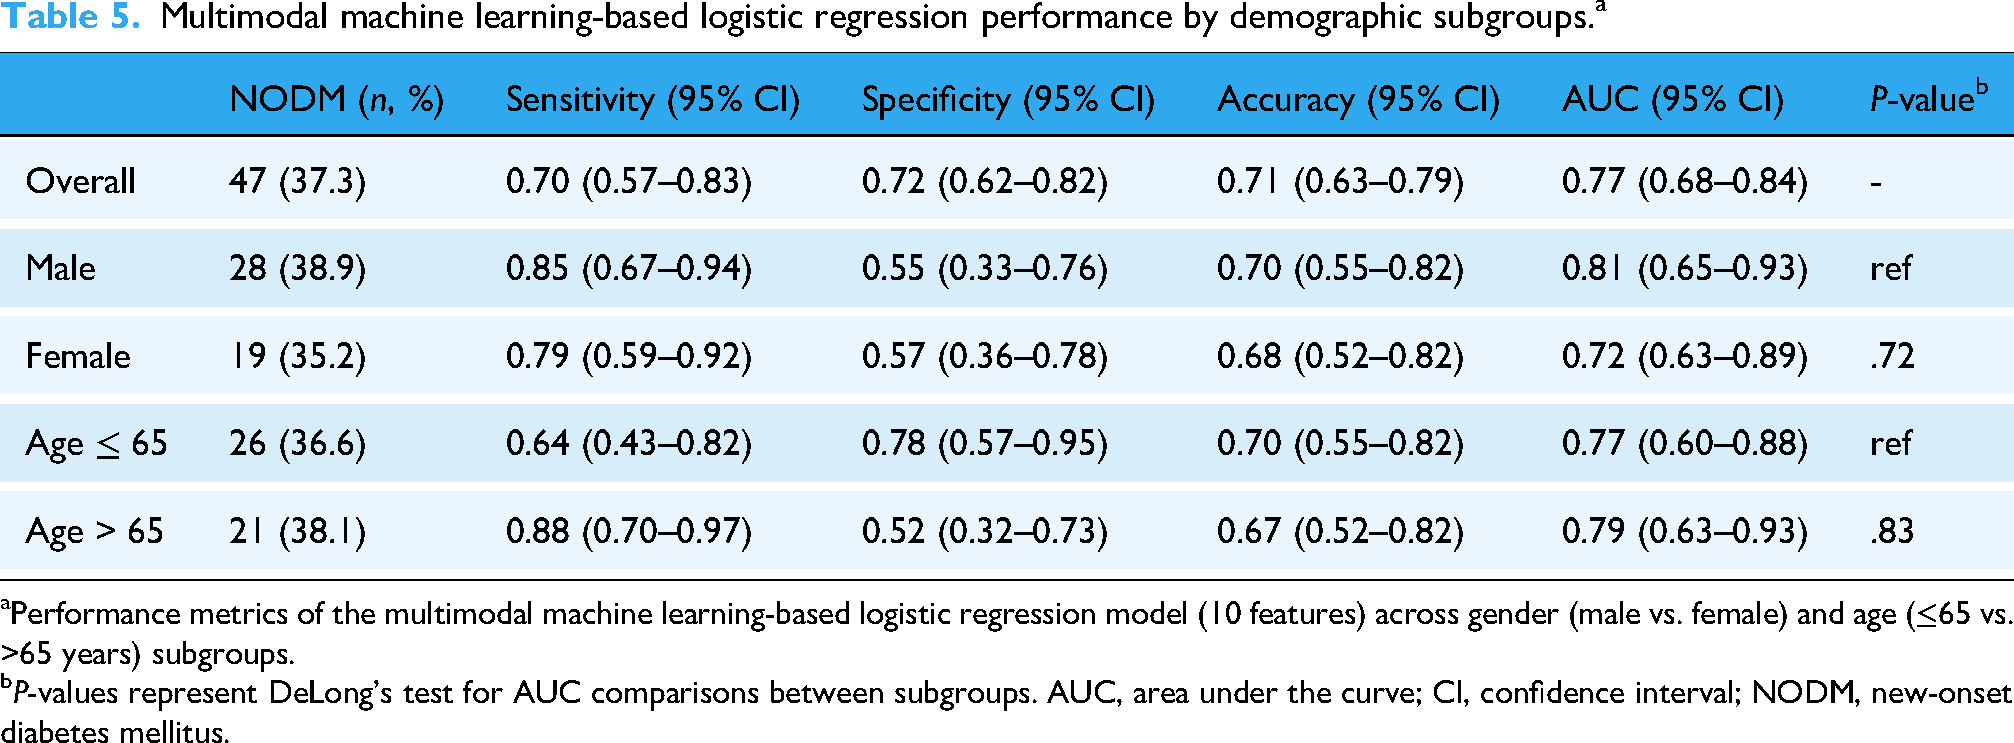
Performance metrics of the multimodal machine learning-based logistic regression model (10 features) across gender (male vs. female) and age (≤65 vs. >65 years) subgroups.
P-values represent DeLong's test for AUC comparisons between subgroups. AUC, area under the curve; CI, confidence interval; NODM, new-onset diabetes mellitus.
For the age-stratified analysis, 26 of 71 patients (36.6%) aged ≤65 years and 21 of 55 patients (38.1%) aged >65 years developed NODM. The model performance remained stable across age groups, with an AUC of 0.77 (95% CI: 0.60–0.88) for patients aged ≤65 years and 0.79 (95% CI: 0.63–0.93) for patients aged >65 years. No statistically significant difference in AUC was observed between age subgroups (P = .83). Interestingly, younger patients (≤65 years) exhibited higher specificity (78% vs. 52%) but lower sensitivity (64% vs. 88%) compared to older patients, reflecting potential differences in disease presentation or pancreatic reserve between age groups.
Overall, these findings demonstrate that the multimodal machine learning-based Logistic Regression model maintains robust predictive performance across diverse demographic subgroups. The observed sensitivity–specificity trade-offs across subgroups (higher sensitivity in males and older patients; high specificity in females and younger patients) may reflect biological heterogeneity in NODM pathogenesis but do not compromise the model's overall reliability. This supports the model's generalizability for clinical application in varied patient populations without requiring demographic-specific recalibration. The ROC curves for each subgroup are presented in Figure 3.
Discussion
This study presents a machine learning-based model to predict the risk of long-term NODM after pancreaticoduodenectomy. By combining radiomic features extracted from both preoperative and postoperative CT images with clinical data, the model demonstrated promising predictive performance. Specifically, the LR model achieved the highest AUC (0.77), surpassing the SVM (0.76), RF (0.70), and XGB (0.73) models for discriminative power. Notably, the LR model demonstrated 70% sensitivity and 72% specificity, highlighting its balanced performance in distinguishing both true positives and true negatives. These results suggest that the LR model is effective in differentiating between patients with and without long-term NODM risk. When the same feature set was analyzed using conventional multivariable logistic regression, the model showed numerical instability with clinically uninterpretable odds ratios (Supplementary Table 1), whereas the regularized ML-based logistic regression provided stable and reproducible performance (AUC 0.77).
The superior performance of the simpler LR model over complex ensemble methods (RF, XGB) may be attributed to the relatively small dataset size (n = 126), where simpler models are less prone to overfitting and demonstrate better generalization capability. Complex models like RF and XGB, while powerful with large datasets, may suffer from overfitting when applied to smaller cohorts, leading to reduced performance on unseen data. This finding underscores the importance of model selection based on dataset characteristics rather than model complexity alone.
Although postoperative chemotherapy was significantly associated with NODM in univariate analysis (P < .01), it was not selected by RFE for the final model. This exclusion may be due to its correlation with other included variables such as malignancy status and pancreatic volume changes, or because the feature selection algorithm identified other variables with stronger predictive power. The interplay between chemotherapy, tumor characteristics, and pancreatic functional reserve may be captured indirectly through the selected radiomic and clinical features.
Existing NODM prediction models have predominantly relied on clinical variables such as age, BMI, and hypertension but have limitations in accounting for subtle tissue changes following surgery.5,7 Our study presents a model that integrates radiomic features with clinical data, offering a more accurate prediction by reflecting tissue changes occurring post-surgery.5,7 Specifically, radiomic features such as Strength, GrayLevelNonUniformity, and ClusterProminence indicate subtle pathological changes such as inflammation and fibrosis, which are closely linked to NODM.8,44 These features were crucial for achieving superior performance, as shown in the ROC curve comparison in Figure 2, where the LR and SVM models outperformed the RF and XGB models in terms of predictive accuracy.
Recent studies, such as those by Ferrara et al. and Chen et al., have examined the incidence and risk factors of immediate post-resection diabetes and the role of radiomic features in predicting NODM after pancreatic surgery.45,46 These studies highlight the importance of radiomic features and their role in predicting diabetes risk following surgery, supporting the findings of our study. For example, Chen et al. developed a clinical model for stratifying risk and predicting NODM after distal pancreatectomy, which further aligns with our findings regarding the predictive power of radiomic features after pancreatic surgery. 45
Predicting long-term NODM risk is crucial for managing patients after pancreaticoduodenectomy. As shown in Table 3, postoperative factors such as pancreatic volume change (P < .01) were significantly associated with NODM, suggesting that pancreatic atrophy after surgery can be a key marker of diabetes risk. By integrating radiomic features into a machine learning model, personalized risk assessments are possible, allowing healthcare providers to implement targeted interventions for high-risk patients. This will enable personalized postoperative care and long-term diabetes prevention strategies.
The SHAP value analysis offers insights into how radiomic features contribute to model predictions. As shown in Figure 5, pancreatic volume changes and preoperative hypertension consistently contributed to the decision-making process across all the models, reinforcing their clinical relevance as predictors of long-term NODM risk. This transparency helps clinicians trust and understand the model's predictions, facilitating the integration of machine learning tools into clinical decision support systems. Moreover, integrating radiomic features into clinical practice provides a non-invasive and cost-effective tool for monitoring postoperative complications. As shown in Figure 4, feature importance analysis highlights that imaging markers such as SizeZoneNonUniformity and ZonePercentage play significant roles in predicting long-term NODM. Thus, these markers may serve as biomarkers for monitoring pancreatic regeneration and functional recovery after surgery.
The subgroup analyses demonstrated that our model maintains consistent predictive performance across demographic groups, with no statistically significant differences in AUC between males and females (P = .72) or between age groups (P = .83). The observed sensitivity–specificity trade-offs—higher sensitivity in males and older patients versus higher specificity in females and younger patients—may reflect biological heterogeneity in NODM pathogenesis, such as differences in residual pancreatic reserve or disease manifestation patterns. Importantly, these variations do not compromise the model's overall reliability, supporting its generalizability across diverse patient populations without requiring demographic-specific recalibration.
This study had several important limitations. First, the study included only 126 patients from a single institution, which may have limited the generalizability of the model. Therefore, a larger multicenter cohort study is necessary to validate this model across diverse populations and different healthcare settings. Second, the retrospective design introduced potential bias in patient selection and data collection. Future prospective studies could help mitigate these limitations and improve the reliability of our results. Third, although 5-fold cross-validation was used to optimize the model's performance, the risk of overfitting remains a concern, particularly for models such as RF and XGB. Further external validation using independent datasets is essential to ensure the robustness of our findings. Fourth, the model focuses on radiomic and clinical features, but integrating additional biomarkers, such as genetic or metabolic factors, could further enhance the predictive accuracy. For instance, biomarkers such as HbA1c or C-peptide levels should be considered in future studies to improve long-term NODM prediction. Finally, while this study addressed long-term NODM prediction using postoperative imaging data, extending the follow-up period and incorporating multiple time points would provide insights into the model's ability to predict diabetes progression and offer more actionable clinical guidance.
Conclusion
This study demonstrated that a multimodal machine learning model integrating radiomic and clinical features can effectively predict long-term NODM risk after pancreaticoduodenectomy. The proposed multimodal framework outperformed single-modality prediction models and provides meaningful research value by addressing key limitations of prior studies. By offering a more comprehensive and reliable assessment of long-term diabetes risk, the model holds promise as a supportive tool for clinical decision-making in establishing personalized postoperative management strategies. Although the clinical applicability of the model requires further validation in larger, multicenter cohorts, the results highlight the potential of personalized care strategies that could improve the long-term quality of life of patients undergoing pancreaticoduodenectomy.
Supplemental Material
sj-docx-1-dhj-10.1177_20552076261415943 - Supplemental material for Machine learning-based prediction of long-term new-onset diabetes mellitus risk after pancreaticoduodenectomy using radiomics
Supplemental material, sj-docx-1-dhj-10.1177_20552076261415943 for Machine learning-based prediction of long-term new-onset diabetes mellitus risk after pancreaticoduodenectomy using radiomics by Jihyun Yoon, Seon Min Lee, Byoungduck Han, Yang-Hyun Kim, Young Jae Kim, Jaehun Yang, Yeon Ho Park, Doojin Kim, Doo-Ho Lee and Kwang Gi Kim in DIGITAL HEALTH
Footnotes
Ethical considerations
This study was approved by the Gil Medical Center Institutional Review Board (IRB, GDIRB2020-121). All data collection procedures were performed in accordance with the relevant guidelines and regulations. This study was performed in accordance with the Declaration of Helsinki.
Consent to participate
Written informed consent was obtained from all patients participating in this study as required and approved by the Gil Medical Center Institutional Review Board. During the data collection process, informed consent was obtained from all patients, and this was explicitly stated and approved by the IRB.
Contributorship
Conceptualization: JY, SML, DHL, KGK; data curation: JY, BH, JY (Jaehun Yang), YHK, YHP, DK; formal analysis: SML, YJK, KGK; funding acquisition: KGK; investigation: JY, BH, YHK, JY (Jaehun Yang), YHP, DK, DHL; methodology: JY, SML, YJK, KGK; project administration: DHL, KGK; resources: DHL, KGK; software: SML, YJK; supervision: DHL, KGK; validation: SML, YJK; visualization: SML, YJK; writing—original draft: JY, SML; writing—review and editing: all authors.
Funding
The authors disclosed receipt of the following financial support for the research, authorship, and/or publication of this article: This study was supported by Gachon University College of Medicine (GCU-202410470001/202107270001). This work was supported by the GRRC program of Gyeonggi province [GRRC-Gachon2023(B01), Development of AI-based medical imaging technology]. This work was supported by the Technology Innovation Program-Biotechnology Industry Technologies)(RS-2025-02305698) funded By the Ministry of Trade Industry & Energy(MOTIE, Korea).
Declaration of conflicting interests
The authors declared no potential conflicts of interest with respect to the research, authorship, and/or publication of this article.
Data availability
The data that support the findings of this study are available from the corresponding authors, but restrictions apply to the availability of these data, which were used under license from the Gil Medical Center for the current study, and so are not publicly available. Data are, however, available from the corresponding authors (email: kimkg@gachon.ac.kr) upon reasonable request and with permission from the Institutional Review Board at the Gil Medical Center.
Supplemental material
Supplemental material for this article is available online.
References
Supplementary Material
Please find the following supplemental material available below.
For Open Access articles published under a Creative Commons License, all supplemental material carries the same license as the article it is associated with.
For non-Open Access articles published, all supplemental material carries a non-exclusive license, and permission requests for re-use of supplemental material or any part of supplemental material shall be sent directly to the copyright owner as specified in the copyright notice associated with the article.