
Abstract
Objective
Breast cancer detection is critical for timely and effective treatment, and automatic detection systems can significantly reduce human error and improve diagnosis speed. This study aims to develop an accurate and robust framework for classifying breast cancer into benign and malignant categories using a novel machine learning architecture.
Methods
We propose a dense-ResNet attention integration (DRAI) architecture that combines DenseNet and ResNet models with three attention mechanisms to enhance feature extraction from the BreakHis dataset. The attention mechanisms focus on regionally important features, improving classification accuracy. A triple-level ensemble (TLE) method combines the performance of multiple models, further enhancing prediction accuracy.
Results
The proposed DRAI architecture with TLE achieves an accuracy of 99.58% in classifying breast cancer into benign and malignant categories, surpassing existing methodologies. This high accuracy demonstrates the effectiveness of the fusion architecture and its ability to reduce manual errors in breast cancer diagnosis.
Conclusion
The DRAI architecture with TLE provides a robust, automated framework for breast cancer classification. Its exceptional accuracy lays a solid foundation for future advancements in automated diagnostics and offers a reliable method for aiding early breast cancer detection.
Keywords
Introduction
Cancer is a disease in which some of the body’s cells grow uncontrollably and spread to other parts of the body. 1 Breast cancer, in its various forms, originates in the breast tissue when abnormal cells multiply uncontrollably, resulting in the formation of a mass or tumor, most commonly found within the milk ducts or lobules. 2 Tumors manifest in two distinct forms: non-cancerous, known as benign, or cancerous, referred to as malignant. Siegel et al. 3 performed a study where they claim that the mortality of breast cancer is very high when compared to other types of cancer. In 2020, breast cancer diagnoses affected 2.3 million women worldwide, resulting in 685,000 fatalities. Based on information from the World Health Organization, by the close of that year, 7.8 million women previously diagnosed with breast cancer within the past 5 years were alive, solidifying its status as the most widespread cancer globally. 4 Breast cancer incidence is noted to be higher in developed nations than in other parts of the world. 5
One crucial factor contributing to the global disparity in mortality rates was the delay in diagnosis. 6 It was found that timely detection of breast cancer significantly reduced its health impact.7,8 However, various detection methods—mammography, histopathological examinations, clinical/self-assessments, ultrasound, magnetic resonance imaging (MRI), molecular imaging, liquid biopsies, and 3D mammography—experienced intrinsic limitations. Challenges in dense breast tissue elevated the risk of false results in mammography. 9 Inherent errors were identified in histopathology, and clinical and self-assessments were subject to subjective judgment. Manual disease diagnosis necessitated a high clinician expertise. 10 The effectiveness of ultrasound varied, MRI incurred high costs, and biopsies lacked absolute precision, collectively impeding comprehensive breast cancer diagnosis.
Physicians grappled with interpreting subtle indicators like dense breast tissue and experienced fatigue from exhaustive assessments, impacting timely and accurate detection. Pathologists meticulously analyzed tissue samples, causing delays in cancer detection. Diagnosis and interpretation errors stem from inadequate training, memory lapses, biases, and failures in secondary reviews. 11 The morphological standards employed to categorize histopathological images carried some subjectivity, resulting in an average diagnostic agreement among pathologists of around 75%. 12 The conventional treatment pathway, involving confirmatory tests and specialist consultations, prolonged the duration before commencing therapy.
Automatic detection systems, particularly computer-aided diagnosis (CAD) emerged as a cornerstone in addressing the limitations inherent in traditional diagnostic approaches for various diseases, including breast cancer. CAD leverages computer algorithms to improve the accuracy and efficiency of medical diagnoses.13,14 The manual analysis of complex-natured histopathological images was found to be a time-consuming and tedious process prone to errors. To address the limitations of human interpretation, CAD systems were deemed essential and crucial in the breast cancer classification problem to facilitate the diagnosis process and improve survival chances. 15 CAD algorithms utilize advanced technologies, such as artificial intelligence (AI) and machine learning (ML),16–19 to enhance the accuracy and efficiency of detection.20,21 Supervised classification was often utilized for the quantitative analysis of biomedical imaging. 22 The potential of AI to supplant traditional expert systems was acknowledged, enabling the swift attainment of preliminary diagnoses within remarkably brief periods. By swiftly analyzing vast amounts of data from imaging scans and pathology samples, CAD systems identify subtle abnormalities that might be missed or misinterpreted by human assessment. This rapid and meticulous analysis significantly reduced the time required for diagnosis, enabling earlier detection and intervention. 23
Consequently, CAD not only enhanced accuracy but also expedited the diagnostic process, ultimately leading to improved patient outcomes. 24 Research demonstrated that the performance of radiologists could be enhanced by supplying them with the outcomes generated by a CAD system. In the proposed approach, a custom convolutional neural network (CCNN) model was utilized, integrating the robust architectures of DenseNet (DN) and ResNet (RN), to automate the classification of breast cancer images into distinct categories, particularly benign and malignant. This integration with advanced convolutional neural network (CNN) models significantly elevated the precision and efficiency of detection processes. By rapidly processing extensive datasets obtained from imaging scans and pathology samples, these CAD systems demonstrated a superior ability to discern subtle abnormalities that might evade human assessment. This heightened ability for rapid and meticulous analysis substantially reduced the time required for accurate diagnosis, facilitating early detection and intervention strategies. This acceleration in the diagnostic workflow ultimately translated to improved patient outcomes.
Motivated by the remarkable strides in computer vision and image processing facilitated by deep learning (DL), numerous researchers were prompted to employ this approach in histopathological image classification. The realm of ML and DL methodologies was explored through multiple studies, revealing substantial opportunities for advancement. Significant interest and potential for enhancing diagnostic applications in healthcare were demonstrated by advances in ML and DL methodologies. 25 In prior attempts to automate breast cancer detection, challenges were encountered in accurately discerning nuanced irregularities, handling diverse imaging datasets inefficiently, and relying on basic classification models ill-equipped to handle complex features, leading to a diminished accuracy. Furthermore, vulnerabilities were observed in certain techniques for managing variations in imaging quality and breast tissue compositions, emphasizing the demand for more refined models capable of intricate feature extraction and streamlined classification processes. These limitations paved the way for novel methods, notably the integration of sophisticated architectures such as DN and RN, aimed at addressing these shortcomings and propelling advancements in breast cancer detection.
In previous studies on breast cancer classification, researchers encountered a range of challenges, including imbalanced datasets that impacted the ability of models to generalize and make accurate predictions for minority classes. A notable gap existed in the careful tailoring of CNN architectures specifically for breast cancer images, potentially limiting the performance of models. Furthermore, there were limitations in the exploration of advanced techniques to achieve optimal accuracy in breast cancer classification. 26 Effective data pre-processing, such as selecting the most relevant features, was also often overlooked, impacting the overall model performance. 27 Sophisticated transfer learning (TL) methods were underutilized, and there was a lack of emphasis on integrating multiple data modalities, leading to a lack of comprehensive understanding. Moreover, transparency in the decision-making processes of models was lacking, and ethical considerations were not adequately addressed in previous research efforts within this domain. These gaps highlight the need for further investigation and improvement in breast cancer classification methodologies.
Ensembling techniques were found to be underutilized within this domain. However, multilevel ensembling emerged as a pivotal strategy for addressing challenges and enhancing the dependability and precision of classification models. Analogous to insights gathered from diverse perspectives, predictions were amalgamated from disparate sources through multilevel ensembling, thereby encapsulating a broader spectrum of patterns and features present in the data. 28 Consequently, this amalgamation fostered the development of more robust models with superior overall performance. Moreover, comprehension of the confidence and reliability associated with final classification decisions was facilitated by integrating predictions from multiple models through multilevel ensembling. Such transparency was deemed paramount in medical image analysis, wherein decisions had a tangible impact on patient care and treatment planning. Despite these features, ensembling techniques have been underutilized. A better generalized profound could be built by employing them.
To address the above-mentioned limitations, our focus has been directed toward gaining a comprehensive understanding of the challenges inherent in breast cancer classification. Recognizing the subtleties associated with imbalanced datasets, the customization of CNN architectures, and the exploration of advanced techniques, targeted research questions were meticulously formulated. These questions served as a strategic pathway for overcoming the limitations observed in prior research. The first and foremost step is to address the major research inquiries listed below, which must be answered to establish a robust architecture and enhance the acceptability of the study.
To overcome the inherent limitations of previous research and effectively address the research mentioned above questions, a multifaceted approach was meticulously developed, consisting of the following strategic steps:
To address the issue of an imbalanced dataset, the training set was augmented using techniques such as rotating, shifting, zooming, and flipping. A fill mode of “nearest” was used to ensure that the augmented images remained realistic and useful for training. These augmentations helped to increase the diversity and size of the dataset, which in turn improved the model’s ability to generalize and perform better on minority classes.
DN and RN were integrated into the model architecture, leveraging their pre-trained weights through TL. TL allowed us to significantly reduce the amount of data and time required to train the models while improving their performance. Fine-tuning and necessary customizations were applied to optimize these pre-trained models for the specific task, ensuring better accuracy and efficiency.
Attention mechanisms such as channel attention (CA), soft attention (SA), and squeeze, and excitation attention (SEA) were implemented to identify important features from different regions of an image. These attention mechanisms enhanced the model’s ability to focus on relevant features, improving feature extraction and overall model performance. By incorporating these techniques, it was ensured that the model could better distinguish between significant and less significant features, leading to improved classification results.
To enhance overall performance, an ensemble approach was applied by combining the outputs of different models. This ensemble method increased the reliability and robustness of the predictions, making the model more applicable to various scenarios. By leveraging the strengths of multiple models, better generalization and higher accuracy on unseen data were achieved.
The remaining part of this article is organized as follows: the “Dataset description” section outlines the datasets employed. The “Method” section covers the research methodology. The experimental results are discussed in the “Results” section. Comparisons with recent studies and methodologies are presented in the “Literature review” section. The “Threats to validity” section addresses the study’s limitations. Lastly, the “Conclusion and future work” section presents the conclusion.
Literature review
The landscape of breast cancer detection witnessed significant progress in healthcare, particularly through the integration of tailored CNN models. 33 Recent advancements highlighted the effectiveness of CCNN architectures in breast cancer image classification, surpassing generic models by capturing specific diagnostic features. A pioneering hybrid CNN-RNN approach by Szegedy et al. 34 and Yosinski et al., 35 utilizing pre-trained Inception-V3 through transfer learning, marked a promising stride in enhancing breast cancer detection accuracy. The integration of recurrent neural networks (RNNs), specifically long short-term memory (LSTM) networks, 36 retained contextual information, presenting a compelling pathway for refining breast cancer diagnosis. Additionally, DL methods 37 demonstrated remarkable results in various computer vision tasks.
In parallel, TL has emerged as a pivotal strategy in medical image analysis, utilizing pre-trained models from extensive annotated databases such as ImageNet. The primary benefits of TL include the reduction of training duration, enhancement of neural network performance, and the requirement for only a small amount of data. 38 The effectiveness of fuzzy TL, which leveraged neural networks to manage uncertainty, was demonstrated in applying model parameters across tasks, illustrating the potential for improving predictive accuracy in dynamic environments. 39 Byra et al. 40 employed the VGG19 pre-trained TL model in their work. Yan et al. 41 extended TL to breast cancer classification, demonstrating that fine-tuning pre-trained models can achieve high accuracy comparable to expert performance, highlighting TL’s versatility across various classification tasks. Deniz et al. 42 utilized the AlexNet 43 pre-trained model structure for feature extraction from histopathological images. Moreover, addressing the challenge posed by the large size of pathological images through segmentation into patches, combined with the use of RNNs for retaining contextual information, represents a substantial advancement in breast cancer detection.
The accuracy of cancer diagnosis, hindered by statistical, distributional, and human errors arising from the manual analysis of extensive tumor tissue slides by pathologists, has been a longstanding challenge. Momentum has been gained in the pursuit of automated and reproducible methodologies. A robust tool in medical image-based examinations, CAD, has been recognized for its cost-effective solutions and the minimization of unnecessary expenses. 44 However, the diagnostic process has been impeded by the laborious pre-processing, segmentation, and manual feature extraction required by traditional image processing and ML techniques.
The revolution of cancer diagnosis by automating intricate feature extraction from medical images by DL was marked by the advent of CNNs. 45 A significant milestone in large-scale image and video recognition was achieved using CNNs, showcasing remarkable success. 45 According to Spanhol et al.’s study, 46 the AlexNet model was applied to categorize breast cancer pathology images, distinguishing between benign and malignant classifications. Fuzzy logic was integrated into CNNs to enhance the model’s ability to handle ambiguities in genomic data, offering high interpretability and reasonable accuracy. 47 The ability of neuro-fuzzy systems to combine rule-based knowledge and neural network training was utilized to offer a mechanism for improving classification performance. 48 The potential of diverse DL network architectures, including GoogLeNet, 49 AlexNet, VGG16, and ConvNet, in identifying breast cancer traits has been underscored by recent successes, ranging from nucleus detection in colon cancer to mitosis detection in breast cancer images.
Prominence in breast cancer detection has been gained by CCNN models due to their efficacy in analyzing medical images. The utilization of a CNN image recognition and classification model in the ImageNet competition is likely to have occurred first. 50 A custom shallow CNN model for breast cancer classification was developed by the authors in the study by Masud et al. 51 In the study by Sohail et al., 52 a multi-phase deep CNN-based mitosis detection framework for H&E stained breast cancer images was suggested. The study by Wang et al. 53 introduced a multiview CNN utilizing the Inception-V3 pre-trained model for the classification of breast lesions into malignant and benign categories using breast ultrasound images.
Efficiency in CAD was enhanced by the research paper on histopathological breast cancer image classification using multiple instance learning (MIL). 54 MIL was compared with single instance classification, and its advantages were highlighted, influencing histopathological image analysis and potentially advancing breast cancer diagnosis systems. The MIL approach was employed in the study by Sarath et al., 55 wherein patch-level features were aggregated through a weighted average to facilitate a thorough image-level representation for predicting benign or malignant masses in mammograms. Furthermore, the ResHist model proposed by Gour et al. 56 offers a crucial solution for automated breast cancer diagnosis from histopathological images, addressing the growing need for accurate and swift diagnostic tools amid rising breast cancer cases worldwide. Its potential to revolutionize clinical practice is highlighted by its high accuracy, stability, and effectiveness in tumor classification.
To address the limitations identified in breast cancer classification, a comprehensive ML approach was employed. Data augmentation techniques were implemented to mitigate the challenges posed by the imbalanced dataset, ensuring a more balanced representation of both benign and malignant cases. Fine-tuning of pre-trained models was conducted to enhance performance, tailoring them specifically to the breast cancer dataset. Additionally, customized attention integration was incorporated, allowing the model to focus on critical cancer regions, significantly improving diagnostic accuracy while reducing human errors associated with manual slide analysis. For efficient feature extraction and the learning of complex patterns from large pathological images, DN and RN architectures were utilized. Their capacity to preserve feature flow and model deep relationships proved essential in improving classification outcomes. Finally, model ensembling was performed, combining multiple model predictions to overcome individual limitations and boost overall performance.
Dataset description
Despite the rapid advancements, histopathological image analysis was identified as a predominant method for diagnosing breast cancer.
57
The efficacy of CNNs depends on the availability of a comprehensive and diverse dataset, that is, accurately annotated.
58
The publicly available “BreakHis” dataset,
59
was utilized in the study, comprising 7909 breast tumor tissue images from 82 patients and serving as a pivotal resource for breast cancer histopathological image classification research. A comprehensive array of images at varying magnification levels (40
Structured into benign and malignant categories, the dataset consisted of 2480 benign and 5429 malignant images. Each standardized image was sized at
The “BreakHis” dataset was meticulously curated in collaboration with the P&D Laboratory – Pathological Anatomy and Cytopathology, located in Parana, Brazil. The dataset’s credibility and relevance in the field of breast cancer research were underscored by this collaborative effort. The dataset had been designed with the utmost care to facilitate future benchmarking, research, and evaluation endeavors. Researchers consider the “BreakHis” dataset to be an invaluable resource for advancing the understanding of breast cancer histopathological images, providing a robust foundation for the development and evaluation of diagnostic and classification algorithms. Figures 1 and 2 showcase the sample images of the benign and malignant classes, respectively, sourced from the “BreakHis” dataset.

Image samples of benign class.

Image samples of malignant class.
The dataset was augmented, and the resulting augmented dataset was made publicly available. This dataset can be found by Mohammad Sakif Alam. 61 It is organized into three directories: train, test, and validation, each containing two classes: benign and malignant. Table 1 presents the distribution of images across these directories.
Augmented dataset image numbers by directory and class.

Method
The research methodology employed in this study encompassed a systematic process aimed at enhancing classification performance. Initially, raw data was collected and preprocessed to create a refined dataset. This processed dataset was then partitioned into training, test, and validation sets, with augmentation techniques applied to the training set to improve model generalization.
Our proposed approach, DRAI architecture, integrates attention mechanisms into DN and RN models. Specifically, channel, soft, squeeze, and excitation attention mechanisms were incorporated to augment feature extraction and classification performance. Various pre-trained models including DenseNet-121, DenseNet-169, DenseNet-201, ResNet-50, ResNet-101, and ResNet-152 were utilized in this architecture.
Histopathological images, such as those in the “BreakHis” dataset, require models capable of capturing fine-grained features across varying resolutions. DN’s dense connections facilitate efficient feature reuse and gradient flow, effectively integrating low- and high-level features while reducing the risk of overfitting. ResNet’s skip connections resolve the vanishing gradient problem, enabling deeper architectures to capture hierarchical features essential for distinguishing between cancerous and non-cancerous tissues.
Other models, such as VGG and inception, were not chosen due to their limitations and suboptimal performance on the BreakHis dataset. VGG’s high parameter count increases the risk of overfitting on small datasets, while inception’s complex architecture struggles to generalize effectively for texture-rich datasets like “BreakHis.” In contrast, DenseNet and ResNet demonstrated superior performance, and their hybrid architecture combines DN’s feature reuse with RN’s depth and robustness, offering an optimal balance of feature extraction and computational efficiency, making it particularly well-suited for histopathological image analysis using augmentation techniques.
Ensembling techniques were systematically employed across three layers to amalgamate predictions from various models, employing majority voting, softmax averaging, and weight averaging. Initially, independent ensembles of DN and RN models were constructed in the first layer. Subsequently, outputs from the initial layer were amalgamated and integrated with predictions from both DN and RN models in the subsequent layer. Finally, in the third layer, results from the preceding layer were consolidated utilizing majority voting, softmax averaging, and weight averaging techniques, culminating in the triple level ensemble (TLE) strategy, which produced the ultimate output classification.
To assess the effectiveness of our proposed methodology, comprehensive testing and validation processes were conducted. The combined TLE output classification served as the outcome of the model, representing a culmination of the integrated attention mechanisms and ensemble techniques employed in this study. This innovative approach was not only aimed at maximizing classification accuracy but also held promise for advancing the frontiers of medical image analysis, paving the way for more precise and reliable diagnostic tools in clinical practice. The sequential workflow is depicted in Figure 3.

Sequential workflow of the research methodology.
Data preprocessing
Preprocessing played a vital role in both data and feature selection processes.62,63 In this study, the BreakHis dataset serves as the primary source of data, subjected to meticulous preprocessing procedures to optimize its suitability for training a DL model. The series of preprocessing steps are delineated as follows:
Through the meticulous execution of these preprocessing steps, the dataset is meticulously primed for subsequent training of the DL model. The resultant preprocessed data embodies heightened diversity, standardization, and compatibility, thereby laying a robust foundation for the forthcoming stages of model training and evaluation.
These augmentation techniques help balance the dataset by generating additional samples for both benign and malignant classes, addressing the class imbalance issue. By increasing the diversity of the training data, the model is better equipped to generalize to new, unseen images, reducing overfitting. This makes it more effective in recognizing subtle patterns across different tumor forms, thereby improving performance in breast cancer classification.
Proposed DRAI architecture
The proposed architecture integrated two renowned pre-trained models, DN and RN, each offering three distinct variants: DN-121, DN-169, DN-201 for DN, and RN-50, RN-101, and RN-152 for RN. However, as these models were primarily designed for ImageNet datasets, challenges arose in adapting them to diverse datasets due to inherent design biases. They were augmented with additional custom convolutional layers to mitigate these limitations and tailor the models to our dataset.
The architecture was comprised of two primary blocks of convolutional layers designed to extract and refine features from breast cancer images. Initially, the input tensor, shaped as (none, height, width, and channels), underwent a series of four convolutional layers. Each layer was utilized with 128 filters having varying kernel sizes of (
The second block was designed to mirror the first, with four additional convolutional layers using 256 filters of the same kernel sizes, allowing for the extraction of more complex and high-level features. Similar to the first block, batch normalization, max-pooling, and attention modules were applied sequentially, ensuring that the model was able to learn from the most significant features while maintaining stability and efficiency.
The incorporation of attention modules was motivated by the necessity to enhance the model’s capacity to focus on relevant features within the data. These modules facilitated the reduction of redundant features, thus improving the efficiency of feature extraction. By selectively attending to informative features, the attention mechanisms aided in streamlining the learning process and enhancing the model’s generalization capabilities across diverse datasets.
Three distinct mechanisms such as channel attention (CA), soft attention (SA), and squeeze-and-excitation attention (SEA) were integrated into the attention module to achieve these objectives. CA allowed the model to adaptively recalibrate channel-wise feature responses, emphasizing informative channels while suppressing irrelevant ones. More details about CA can be found in the “Channel attention” part. SA mechanisms enabled the model to dynamically attend to different regions of the input, effectively capturing spatial dependencies and enhancing feature representation. Further information about SA is provided in the “Soft attention” part. Meanwhile, the SEA mechanism facilitated the model in learning to selectively emphasize important features by recalibrating channel-wise feature responses. Additional insights into the SEA mechanism can be found in the “Squeeze-and-excitation attention” part.
Activation functions, 64 crucial for handling nonlinear problems, were employed across all convolutional layers. In the proposed architecture, rectified linear unit (ReLU) activation functions were utilized to mitigate the vanishing gradient problem and enhance feature extraction capabilities.
The outputs from the second block were flattened and passed through three dense layers housing 1024, 512, and two neurons, respectively. The initial two fully connected layers employed ReLU activation to capture complex features, while the final layer utilized sigmoid activation for class probability representation. Figure 4 depicts a detailed architectural overview of the proposed CCNN model. The interaction between these layers ensures a comprehensive analysis of the input data, facilitating improved classification accuracy in breast cancer detection.

Proposed dense-ResNet attention integration (DRAI) architecture.
Feature extraction process
We implemented a TL approach using the DN and RN models, which were pre-trained on ImageNet. The top fully connected layers were excluded (
Figure 5 presents the feature map activations across different layers of the TL model. Each row corresponds to activations from a unique layer in the network:
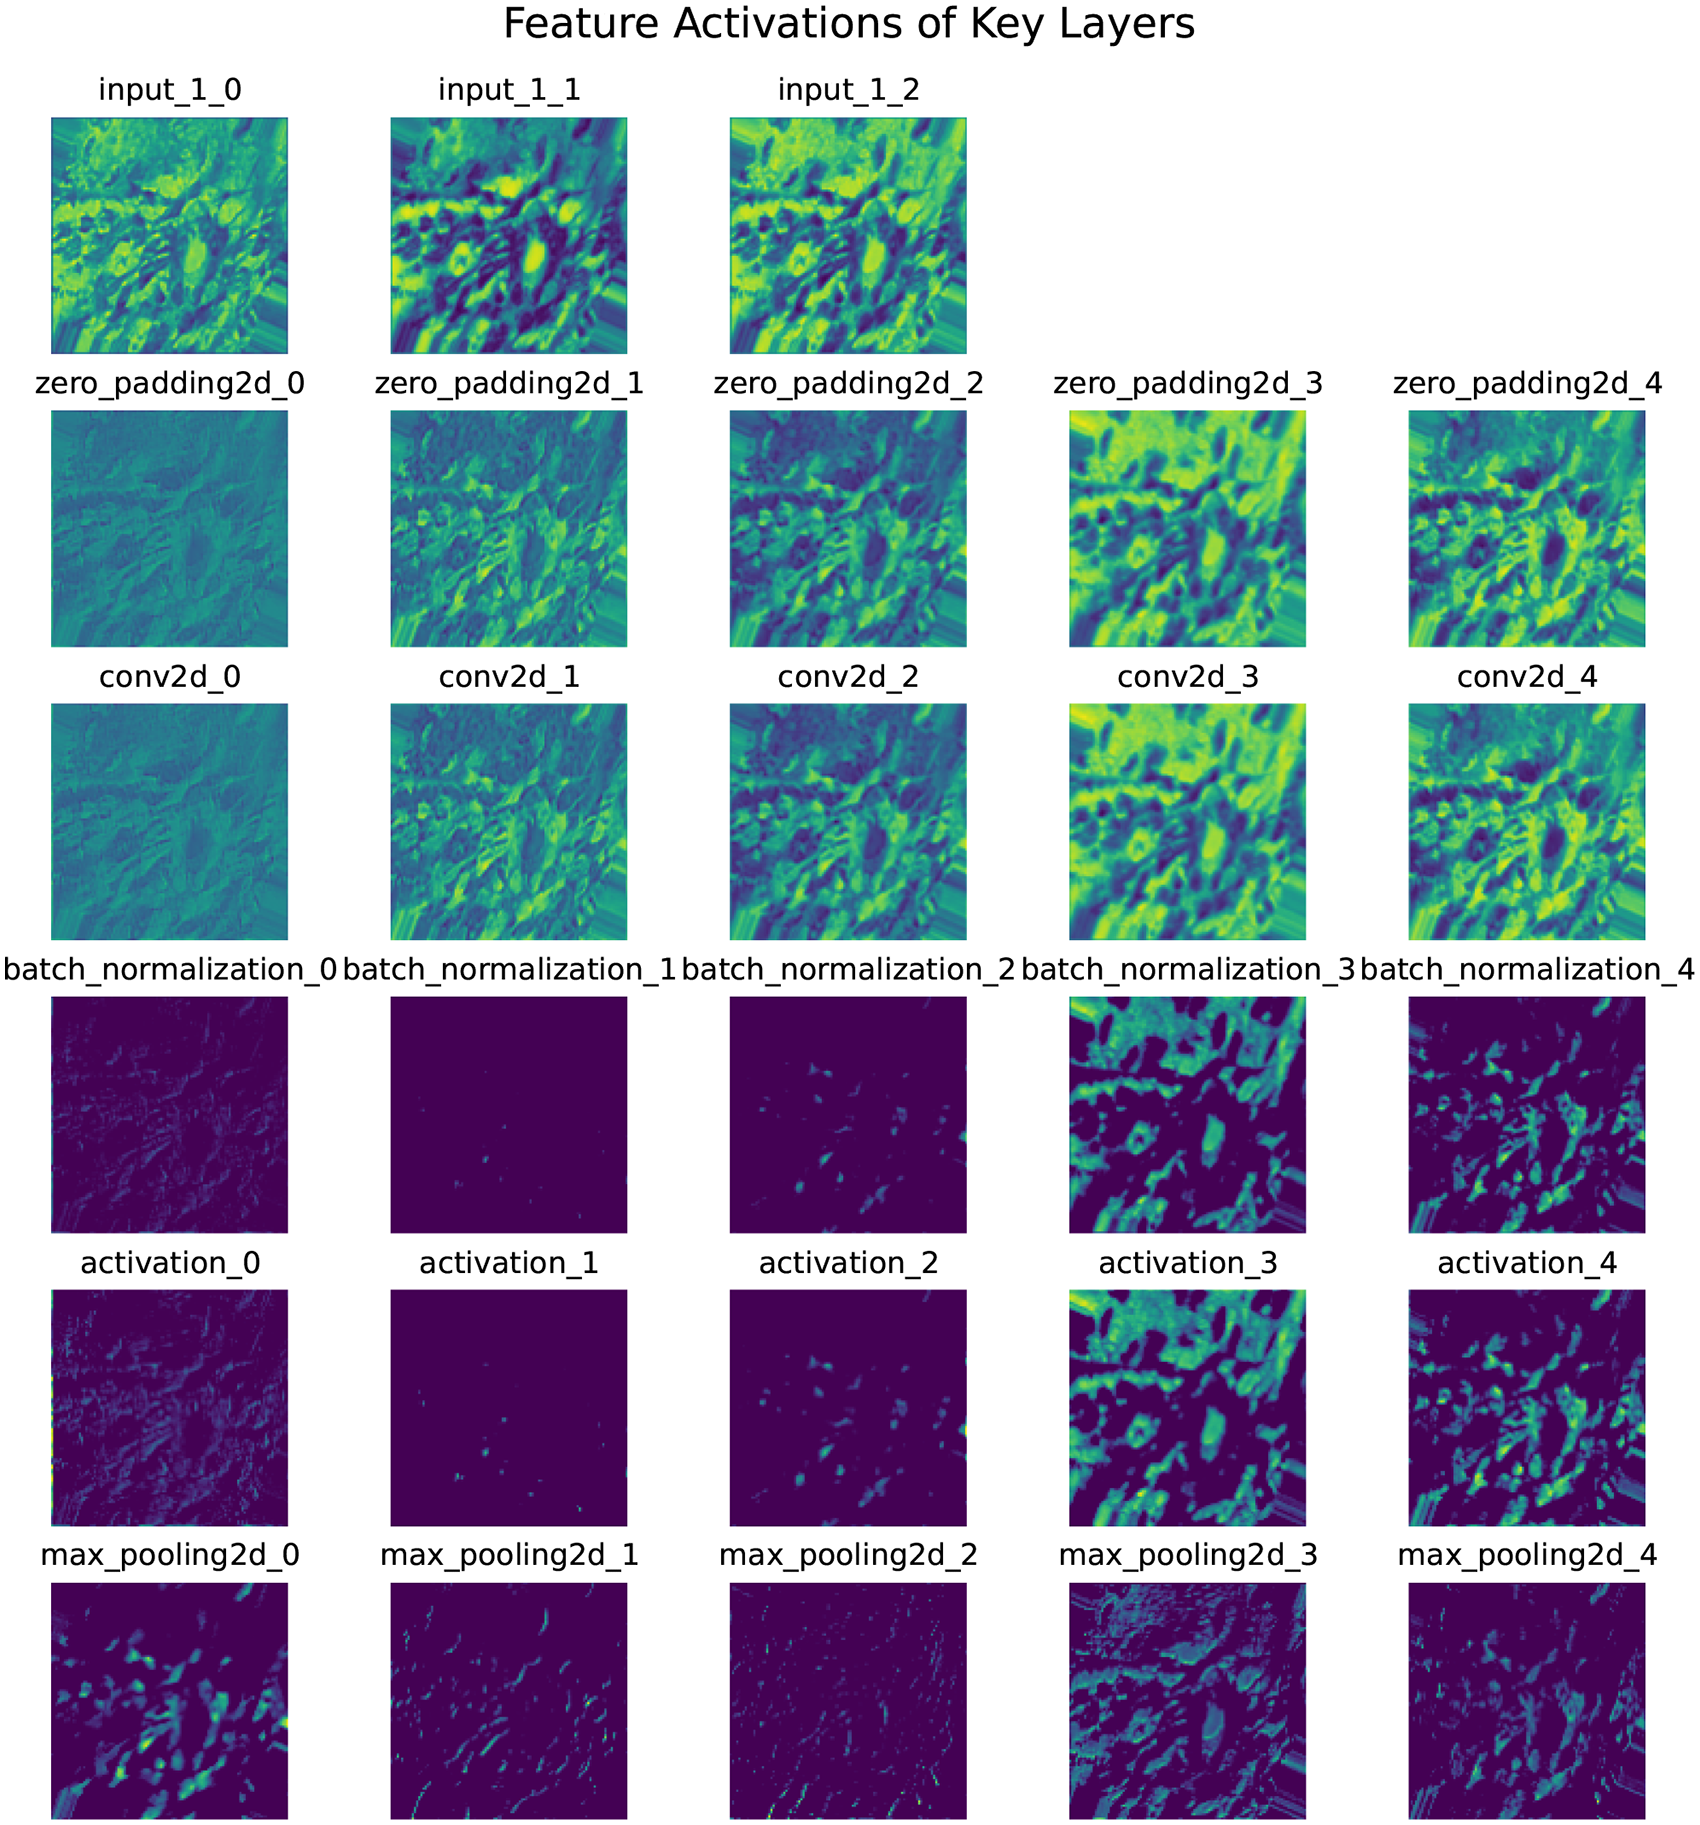
Feature extraction after activation of each layer (one image as example).
Each subplot visualizes up to five filters per layer, rendered with the “viridis” colormap for better clarity. The figure demonstrates how the model progressively processes and transforms input data through successive layers, extracting hierarchical features critical for classification. The dense layer activations provide class probabilities via the sigmoid function. While the example focuses on a single sample and a subset of layers, this methodology allowed the generation of thousands of feature maps, significantly improving algorithm performance.
Attention mechanisms
In our study, different combinations of three attention blocks were leveraged to underscore the importance of selectively emphasizing pertinent features in the input. Each attention mechanism is crucial as it extracts information from various regions of the input, as illustrated by the gradient-weighted class activation map (Grad-CAM) images.


Figure 6 illustrates the region visualization for CA. The first image shows the original input from the dataset, while the second image shows the Grad-CAM visualization, highlighting the regions that the CA mechanism focuses on for feature extraction.

Channel attention: (a) original image from the dataset, (b) Grad-CAM image highlighting the regions focused on by the CA mechanism. Grad-CAM: gradient-weighted class activation map; CA: channel attention.
Figure 7 illustrates the region visualization for SA. The first image shows the original input from the dataset, while the second image shows the Grad-CAM visualization, highlighting the regions that the SA mechanism focuses on for feature extraction.

Soft attention: (a) original image from the dataset, (b) Grad-CAM image highlighting the regions focused on by the SA mechanism. Grad-CAM: gradient-weighted class activation map; SA: soft attention.


Hu et al.
70
proposed a “Squeeze-and-Excitation (SE)” network focusing on channel-wise attention. The SE module, depicted by the solid line box in Figure 8, comprises three components: squeezing, excitation, and scaling. Squeezing involves global average pooling (GAP) to produce a

Squeeze and excitation block.
Figure 9 illustrates the region visualization for SEA. The first image shows the original input from the dataset, while the second image shows the Grad-CAM visualization, highlighting the regions that the SEA mechanism focuses on the feature extraction.
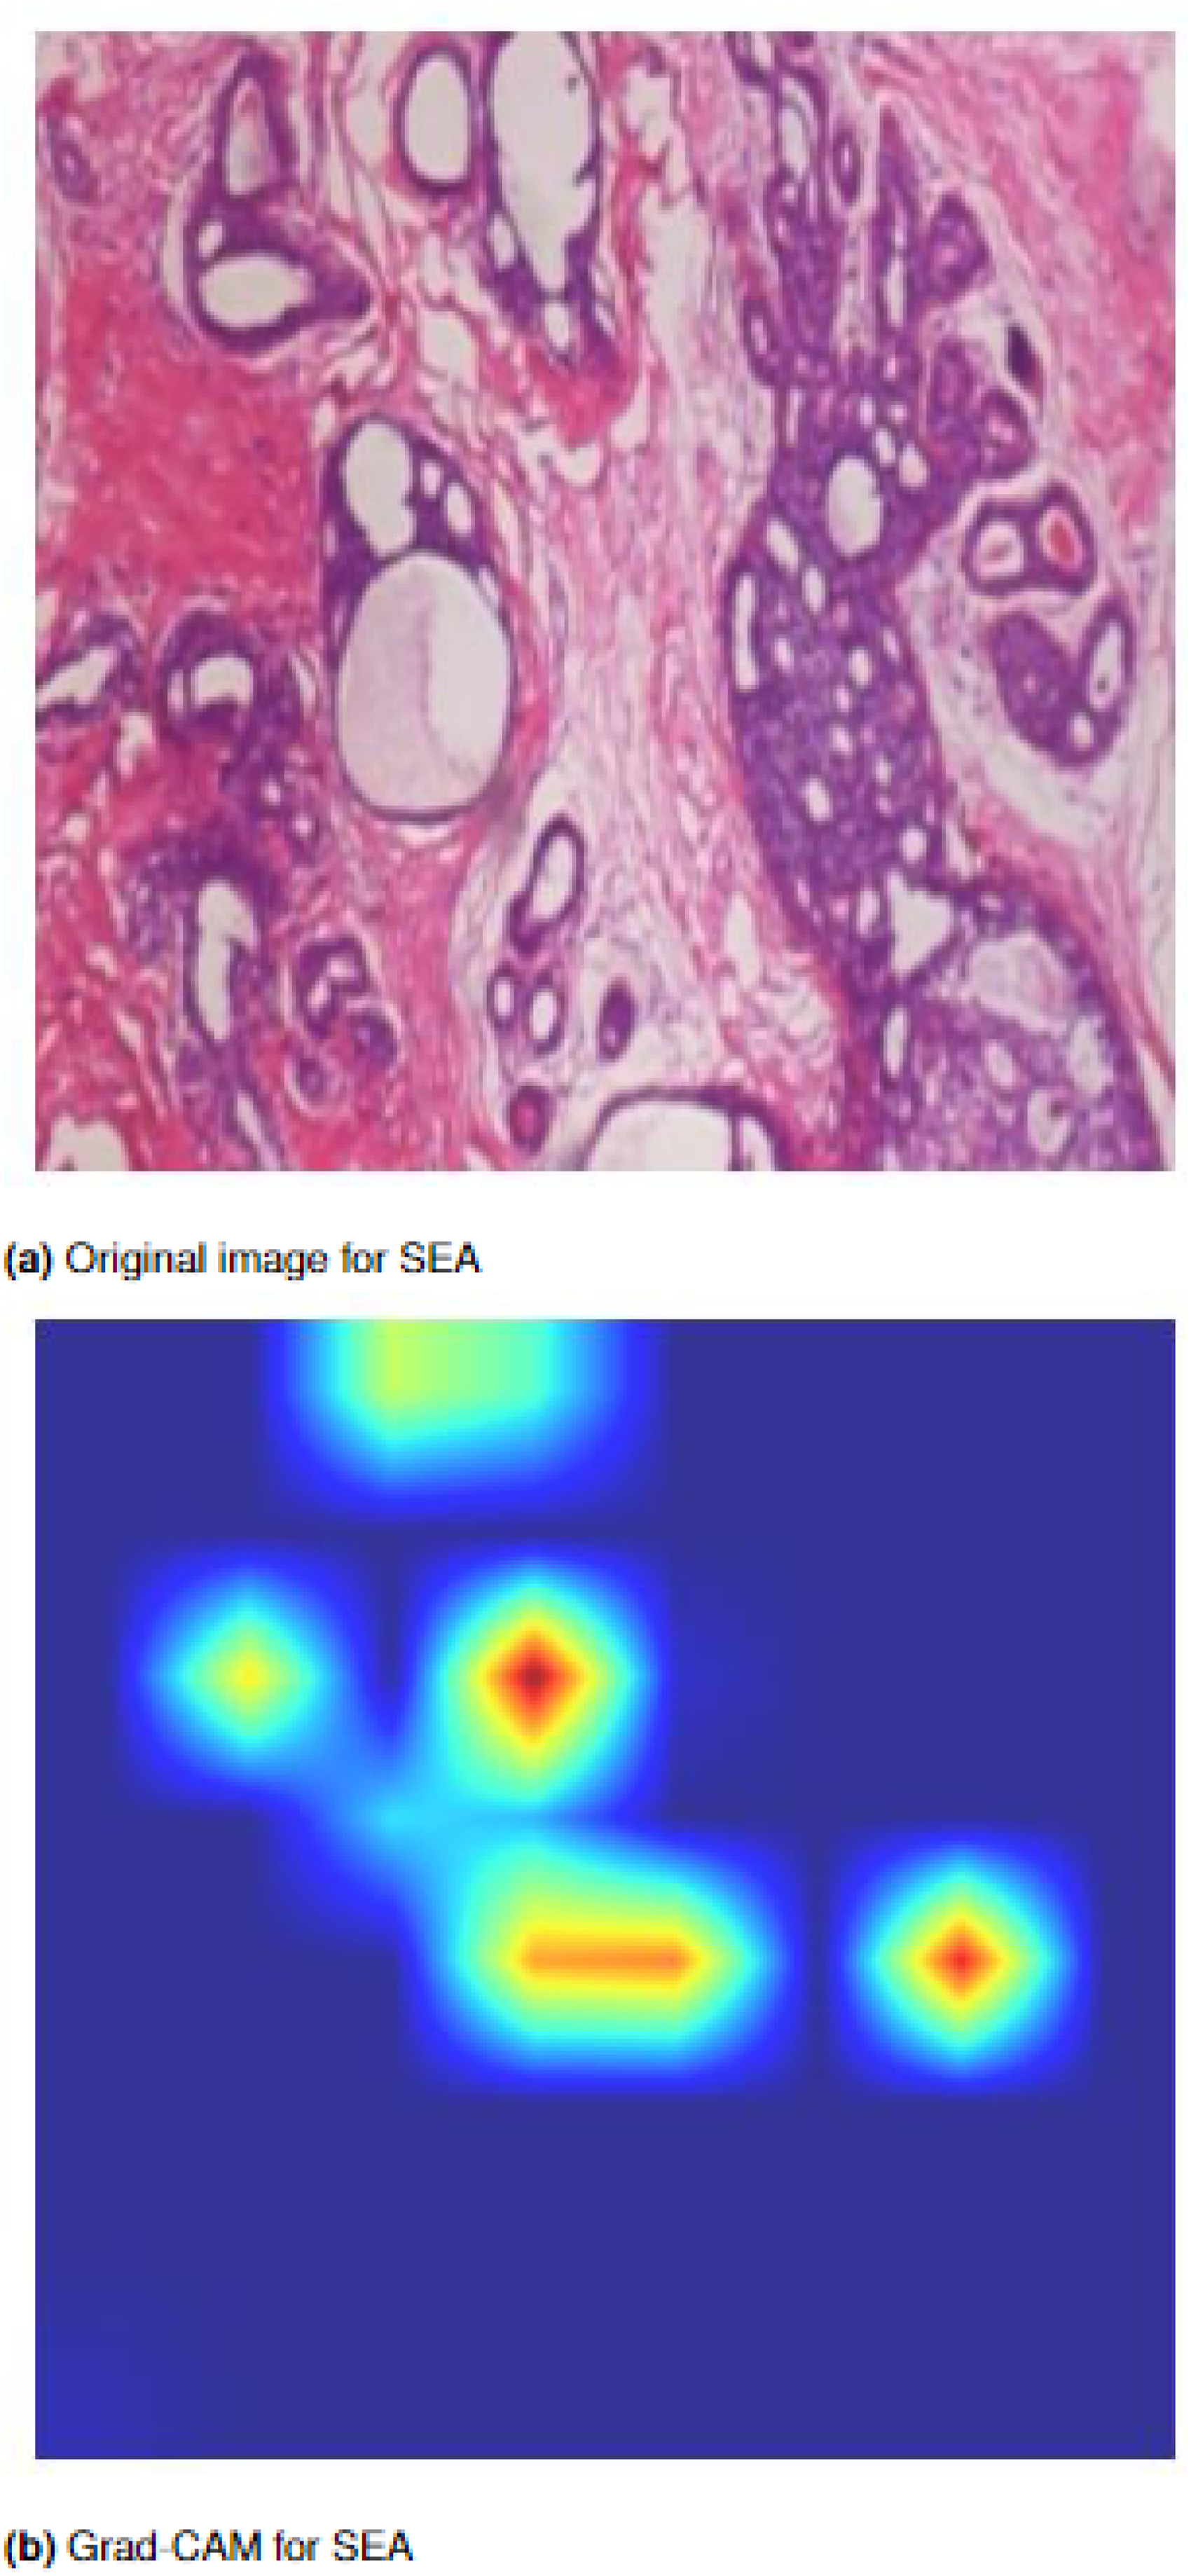
Squeeze-and-excitation attention: (a) original image from the dataset, and (b) Grad-CAM image highlighting the regions focused on by the SEA mechanism. Grad-CAM: Grad-CAM: gradient-weighted class activation map; SEA: squeeze-and-excitation attention.
Triple-level ensemble
The integration of pre-trained DN and RN models using weighted averaging (WAvg), softmax averaging (SAvg), and majority voting (MV) techniques across three hierarchical levels was conducted in the research. This process resulted in the development of the final dense-ResNet (DR) attention integration model.
In the first layer, each variant of DN and RN was paired with various attention modules and merged into a unified variant of DN or RN. For instance, DN-121 CCNN, channel attention CNN (CACNN), soft attention CNN (SACNN), and squeeze and excitation attention neural network (SEACNN) versions were combined into a single DN-121 version using majority voting, softmax averaging, and weighted averaging techniques. This procedure was replicated for every variant of DN and RN.
In the second layer, the outputs from the first layer of DN were aggregated, and the same procedure was applied to RN. For example, the outputs from DN-121 (MV, SAvg, and WAvg), DN-169 (MV, SAvg, and WAvg), and DN-201 (MV, SAvg, and WAvg) obtained from the first layer were merged into DN (WAvg), and similarly for all RN versions into RN (WAvg).
In the third layer, the outputs from the second layer were combined. DN and RN were merged to produce the final ensemble result, predicting the ultimate output from the model. This ensemble technique was referred to as triple-level ensemble (TLE), which generated the final output of the model. The TLE is denoted in Figure 10.

Triple-level ensemble (TLE) approach.
Justification of our proposed architecture
The core aim of this research was to develop an ensemble-based architecture tailored for precise breast cancer diagnosis and classification. The strategic use of kernels with diverse sizes within the model was considered an effective approach, enabling the capture of crucial details present in sample images, even in instances where certain areas were small or less distinct. This methodology ensured the preservation of vital information, facilitating the model’s ability to identify a wide spectrum of features. Smaller kernels, such as (
The integration of batch normalization after each convolutional layer served to counteract internal covariate shifts, thereby ensuring proper centering and normalization of input data. This normalization facilitated faster and more robust training by standardizing the inputs and enhancing the network’s adaptability. The inclusion of learnable parameters for scaling and shifting within batch normalization contributed to the network’s flexibility and assisted in mitigating overfitting. Max-pooling was justified in this context as it aided in dimensionality reduction by capturing the most salient features, allowing the model to focus on essential elements while discarding less critical information. This selective downsampling enhanced computational efficiency and prevented overfitting by promoting translation invariance.
Adam optimization, known for its adaptive learning rates, iteratively adjusted the network’s weights during training to minimize the disparity between predicted and actual values. By amalgamating the benefits of AdaGrad and RMSprop, Adam optimally balanced the advantages of different optimization algorithms, enhancing the model’s convergence speed and performance. Furthermore, the incorporation of SA, CA, and SEA mechanisms into the breast tumor CCNN model significantly amplified overall performance. These mechanisms bolstered feature extraction, aided in cancer cell localization, and facilitated contextual understanding, thereby augmenting accuracy and robustness in classification tasks.
Performance evaluation measures
To evaluate the models’ effectiveness, various metrics have been utilized, encompassing accuracy, precision, recall (sensitivity), F1-score, and specificity. The mathematical expressions defining these measures are provided below for clarity and reference.


Experimental setup
The architectural model was fully executed on a Kaggle notebook utilizing an NVIDIA TESLA P100 GPU operating at a frequency of 1327 MHz. After obtaining distinct images with an input size of (224, 224, 3), the dataset was partitioned into three distinct subsets: training set (70%), validation set (15%), and test set (15%). Throughout the training phase, a batch size of 16 was employed, in conjunction with the Adam optimizer set at a learning rate of 0.001 and an epsilon value of 0.1.
Table 2 provides a comprehensive overview of the model complexities, including the number of parameters for each model, the total number of epochs, and the total time taken for training. Each model utilized the categorical cross-entropy loss function and was designed to be trained for a duration of 50 epochs. However, due to the implementation of an early stopping mechanism, some models were trained for fewer than 50 epochs. This mechanism was introduced to halt training when validation accuracy did not exhibit improvement over a specified number of consecutive epochs.
Model complexities and time.
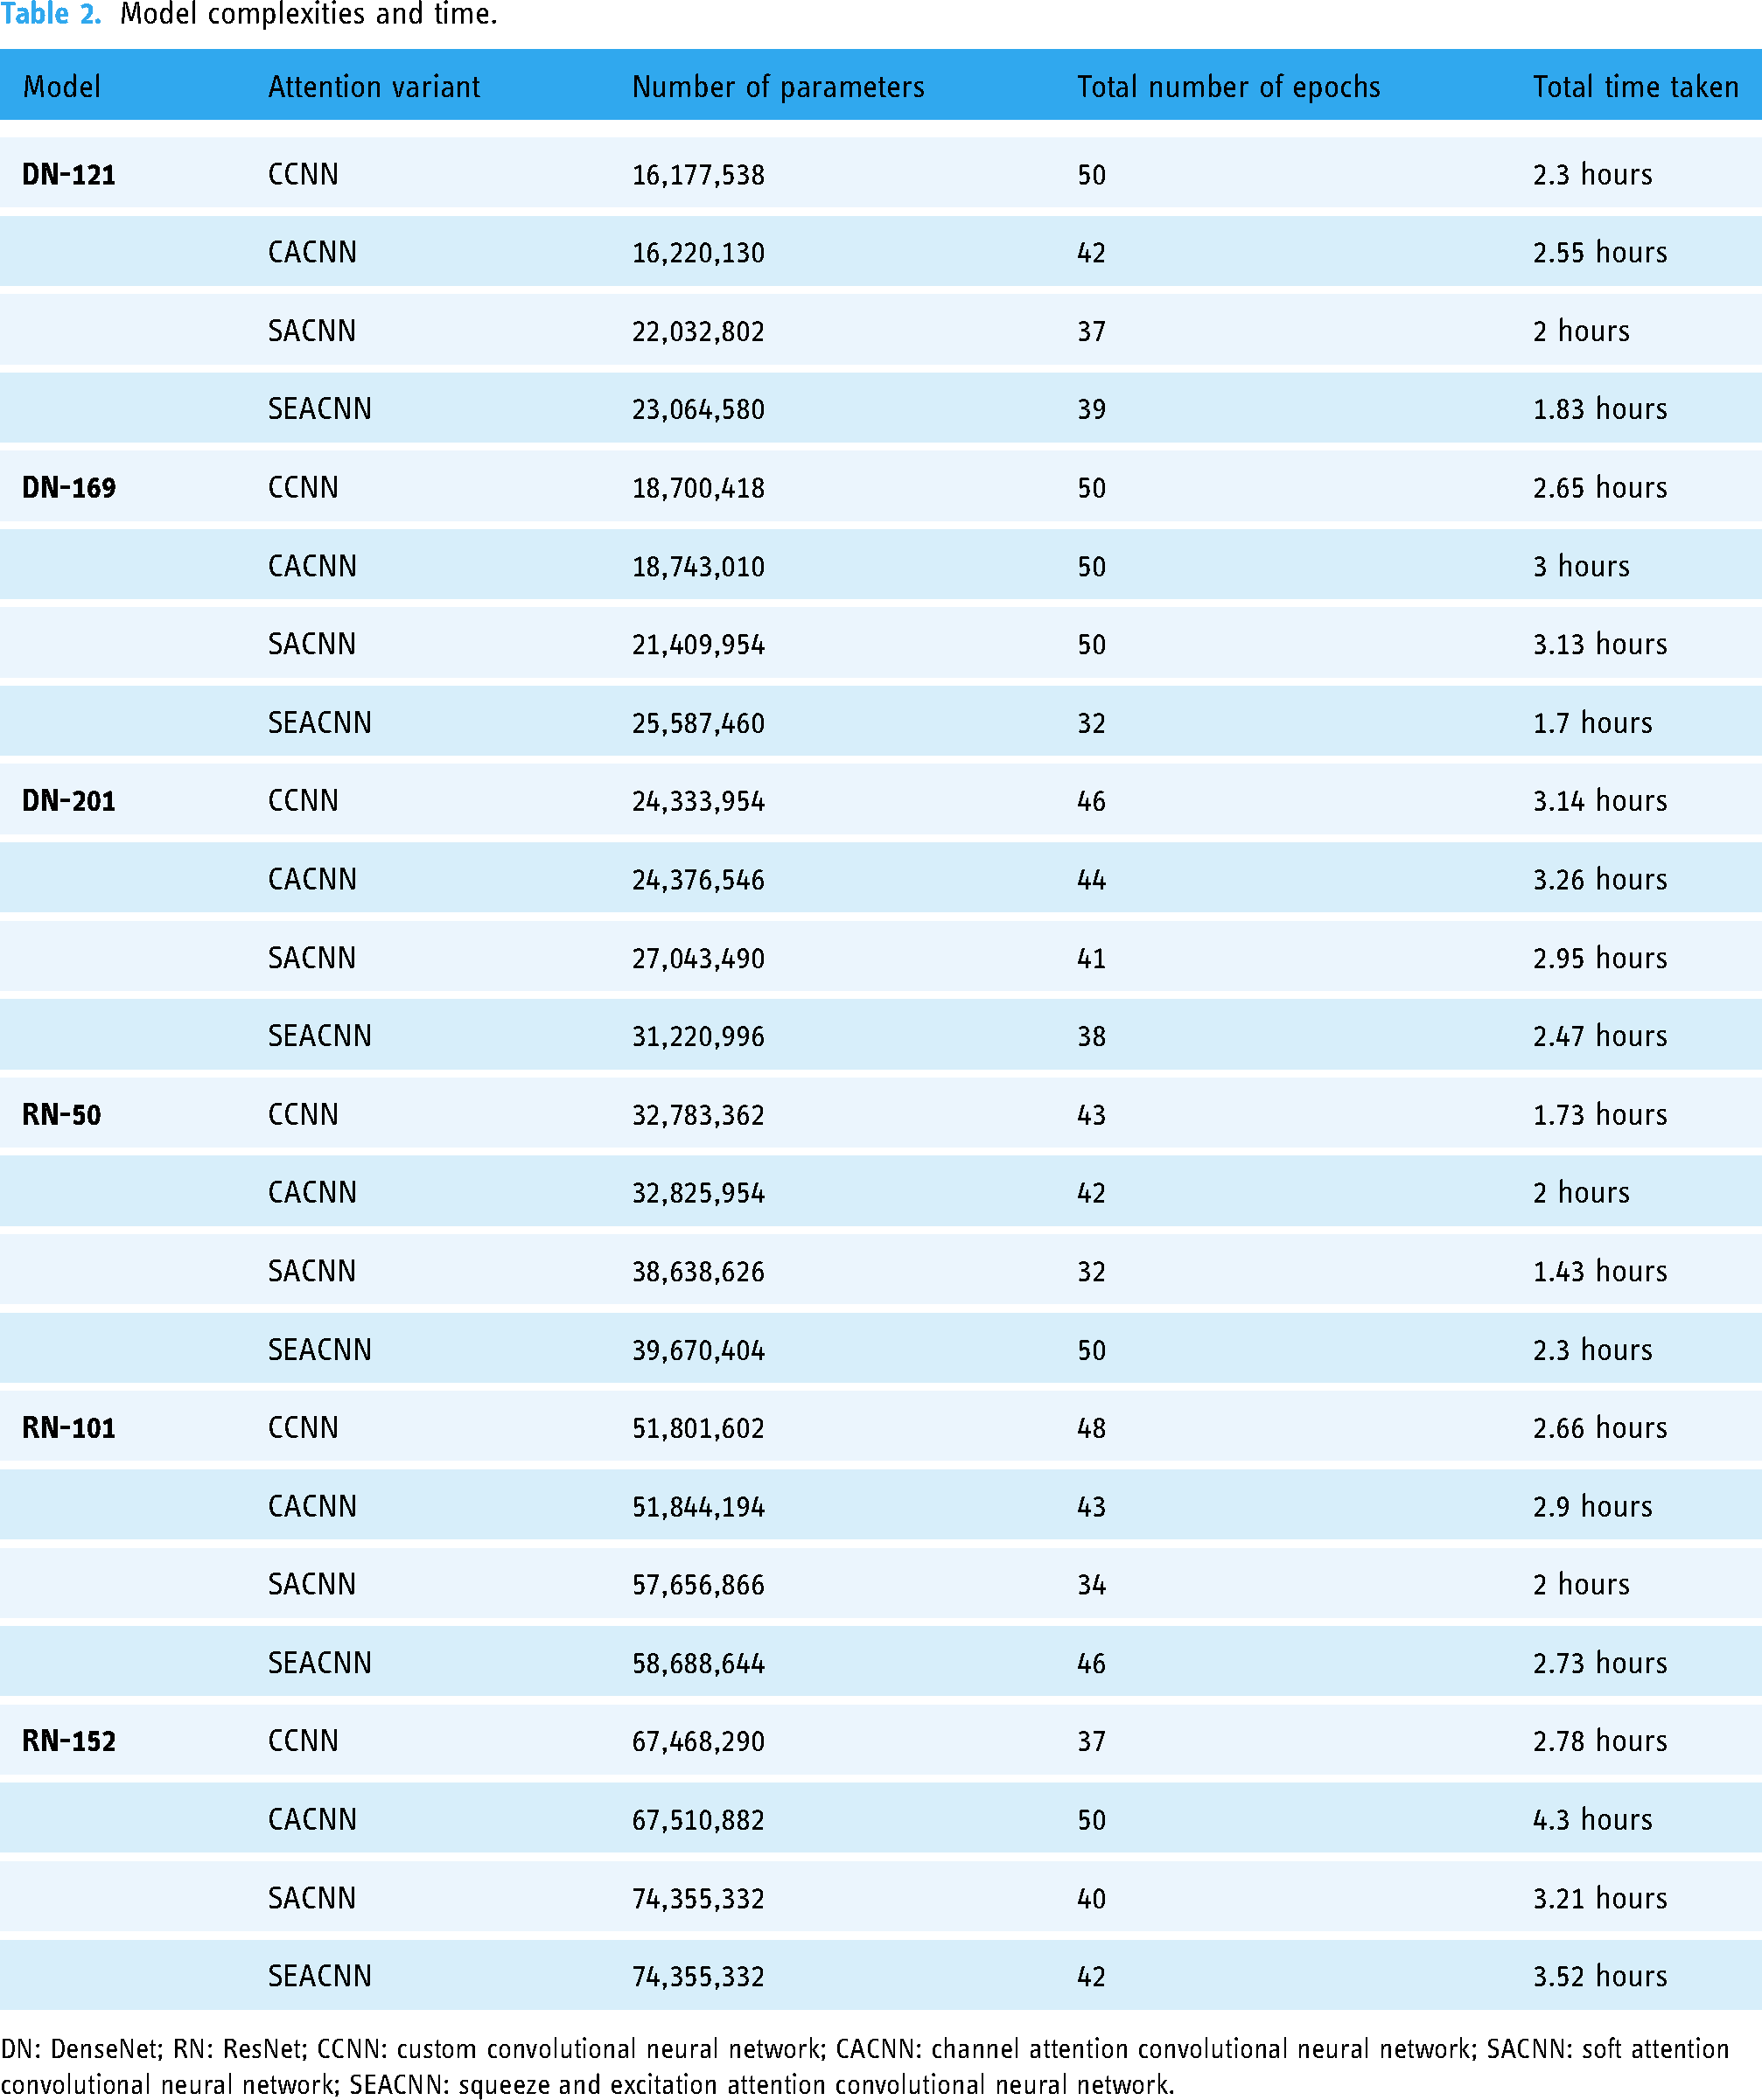
DN: DenseNet; RN: ResNet; CCNN: custom convolutional neural network; CACNN: channel attention convolutional neural network; SACNN: soft attention convolutional neural network; SEACNN: squeeze and excitation attention convolutional neural network.
The time taken for training varied across models and is reported in the table. This time reflects the total duration required for each model to complete its training across the specified epochs, illustrating the relationship between model complexity and computational time. The detailed analysis provided in the table allows for a better understanding of how varying model architectures impact both the number of parameters and the time required for training, thereby contributing to the optimization of computational resources in DL applications.
The individual models’ time complexity, DN and RN, varies before the blending process. Table 3 shows the time complexities before and after blending. The DN models (DN121, DN169, and DN201) have time complexities ranging from 160 to 226 ms/step, while the RN models (RN50, RN101, and RN152) range from 148 to 273 ms/ step. These values reflect the computational demands of each model when evaluated individually.
Comparison of time complexity for models before and after blending.

DN: DenseNet; RN: ResNet.
After blending, using an ensembling technique that combines the outputs of these models, the time complexity increases to 285 ms/step for the ensembled model. This increase is expected, as blending typically adds extra computational overhead due to the aggregation of predictions from multiple models. However, the improvement in accuracy or robustness gained from the ensemble may justify this additional time cost.
Results
This section presents a comprehensive analysis of the classification performance of the proposed model, substantiated by both numerical evidence and graphical representations. We provide detailed results and insights into the performance of different models and their ensemble combinations. The model comprises two main parts: the first part focuses on training the primary model using various pre-trained DN and RN architectures, enhanced through fine-tuning, customization, and the application of attention mechanisms to improve performance. The second part employs an ensembling approach to combine and generalize the results from the first part, thereby increasing robustness and overall improving accuracy, efficiency, and performance in the classification task. The proposed model utilizes a sophisticated three-level ensemble procedure to enhance classification accuracy. In the initial ensemble stage, three techniques—WAvg, SAvg, and MV—were employed. The outputs from these initial ensemble techniques were further refined through subsequent ensemble stages, where the highest values obtained were amalgamated using WAvg to achieve the final results.
Based on the classification performance metrics presented in Table 4, it is evident that the integration of CA and SA blocks with DenseNet-121 (DN121) does not yield significant performance improvements. Specifically, the DN121-CACNN variant, incorporating CA, shows a lower accuracy (97.39%) compared to the CCNN variant without any attention blocks, which achieves an accuracy of 98.99%. Similarly, the DN121-SACNN variant, which includes SA, also underperforms relative to the DN121-CCNN with an accuracy of 98.65%. In contrast, the DN121-SEACNN variant, which incorporates SEA, demonstrates superior performance with the highest accuracy of 99.07%, surpassing all other variants. This suggests that while the CA and SA blocks do not significantly enhance performance when combined with DN121, the SEA block effectively boosts the model’s accuracy and overall performance. These insights highlight the importance of selecting appropriate attention mechanisms to maximize the efficacy of DL models in classification tasks.
Classification performance of DN121 variants.

Acc: accuracy; Pre: precision; Re: recall; F1: F1-score; Spe: specificity; DN: DenseNet; CCNN: custom convolutional neural network; CACNN: channel attention convolutional neural network; SACNN: soft attention convolutional neural network; SEACNN: squeeze and excitation attention convolutional neural network.
Following the classification performance metrics outlined in Table 5, the DenseNet-169 (DN169) variants show that the integration of CA significantly enhances performance, with DN169-CACNN achieving the highest accuracy of 99.16%, along with superior precision, recall, F1-score, and specificity. The DN169-SACNN variant, incorporating SA, also performs well with an accuracy of 98.99%. In contrast, the DN169-SEACNN variant, which includes SEA, has a lower accuracy of 98.65%, indicating less effectiveness than the other attention variants. The DN169-CCNN variant without any attention mechanisms achieves an accuracy of 98.48%, demonstrating strong performance but slightly lower than the CA, SA, and SEA variants. These results suggest that CA is the most effective mechanism for improving DN169 model performance, followed by SA, while SEA offer less benefit.
Classification performance of DN169 variants.

Acc: accuracy; Pre: precision; Re: recall; F1: F1-score; Spe: specificity; DN: DenseNet; CCNN: custom convolutional neural network; CACNN: channel attention convolutional neural network; SACNN: soft attention convolutional neural network; SEACNN: squeeze and excitation attention convolutional neural network.
According to the classification performance metrics provided in Table 6, the DenseNet-201 (DN201) variants demonstrate varying levels of effectiveness across different attention mechanisms. The DN201-SACNN variant, which incorporates SA, achieves the highest accuracy of 98.99%, indicating its strong performance. The DN201-CCNN variant without any attention mechanisms also performs well, with an accuracy of 98.82%. The DN201-CACNN variant, which includes CA, shows a slightly lower accuracy of 98.48%. The DN201-SEACNN variant, incorporating SEA, has the lowest accuracy of 98.06%, suggesting it is the least effective for this model. These results indicate that SA is the most beneficial for the DN201 architecture, followed closely by the model without any attention mechanisms, while CA and SEA offer less improvement.
Classification performance of DN201 variants.

Acc: accuracy; Pre: precision; Re: recall; F1: F1-score; Spe: specificity; DN: DenseNet; CCNN: custom convolutional neural network; CACNN: channel attention convolutional neural network; SACNN: soft attention convolutional neural network; SEACNN: squeeze and excitation attention convolutional neural network.
Based on the classification performance metrics outlined in Table 7, the ResNet-50 (RN50) variants demonstrate varying effects of the attention mechanisms. Notably, the RN50-SEACNN variant, incorporating SEA, achieves the highest accuracy of 98.48%, indicative of its effectiveness. Additionally, the RN50-CCNN variant, devoid of attention mechanisms, also performs commendably with an accuracy of 98.40%. In contrast, the RN50-CACNN variant, integrating CA, exhibits a slightly lower accuracy of 98.15%. Furthermore, the RN50-SACNN variant, embedding SA, records the lowest accuracy of 97.56%, suggesting its limited efficacy for this model. These findings underscore the superior efficacy of SEA in optimizing the RN50 architecture, while also highlighting the competitive performance of the model without any attention mechanisms. Conversely, CA and SA contribute less to performance improvement in this context.
Classification performance of RN50 variants.
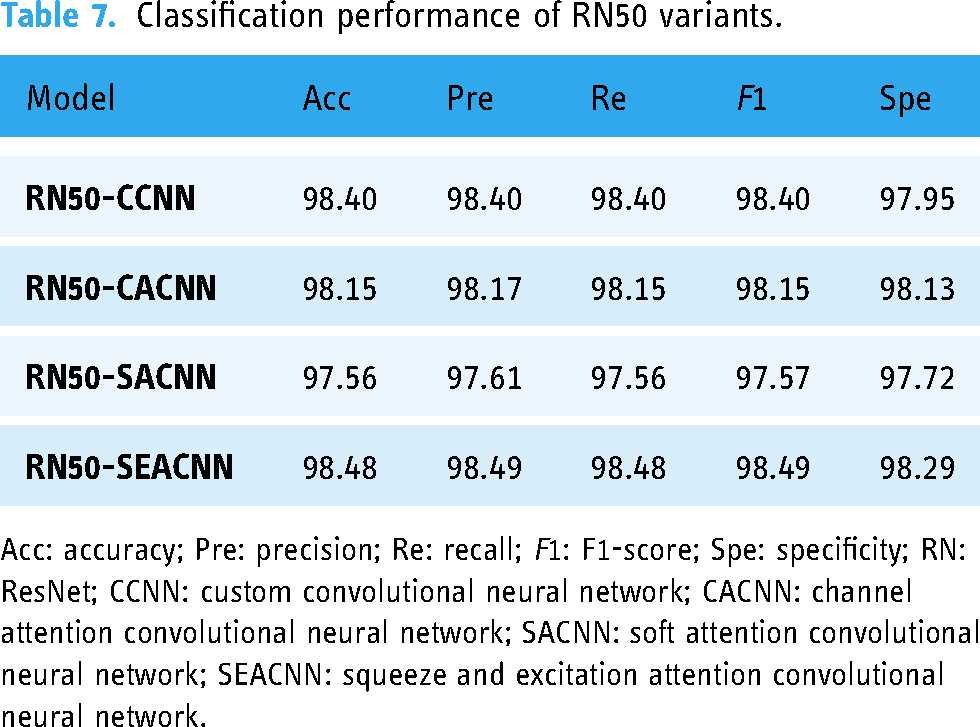
Acc: accuracy; Pre: precision; Re: recall; F1: F1-score; Spe: specificity; RN: ResNet; CCNN: custom convolutional neural network; CACNN: channel attention convolutional neural network; SACNN: soft attention convolutional neural network; SEACNN: squeeze and excitation attention convolutional neural network.
By examining the results in Table 8, it is evident that the RN101-SEACNN variant, which incorporates SEA, achieves the highest accuracy of 98.90%, indicating its effectiveness. Similarly, the RN101-CACNN variant, integrating CA, also demonstrates strong performance with an accuracy of 98.82%. In contrast, the RN101-SACNN variant, utilizing SA, exhibits a slightly lower accuracy of 98.40%. Notably, the RN101-CCNN variant, devoid of any attention mechanisms, records the lowest accuracy of 96.88%. These findings suggest that both SEA and CA significantly enhance the performance of the RN101 model, underscoring the importance of attention mechanisms in improving classification accuracy. Conversely, SA appears to be less effective, while the absence of attention mechanisms leads to diminished performance.
Classification performance of RN101 variants.

Acc: accuracy; Pre: precision; Re: recall; F1: F1-score; Spe: specificity; RN: ResNet; CCNN: custom convolutional neural network; CACNN: channel attention convolutional neural network; SACNN: soft attention convolutional neural network; SEACNN: squeeze and excitation attention convolutional neural network.
The classification performance metrics provided in Table 9 reveal varying effectiveness among the ResNet-152 (RN152) variants with different attention mechanisms. Notably, the RN152-CACNN variant, integrating CA, achieves the highest accuracy of 98.99%, indicating superior performance. Conversely, the RN152-SEACNN and RN152-SACNN variants, embedding SEA and SA respectively, demonstrate strong yet slightly lower accuracies of 98.32% and 98.23%, compared to the CA variant. Remarkably, the RN152-CCNN variant, devoid of attention mechanisms, records the lowest accuracy of 97.64%. These findings underscore the significance of CA in optimizing the RN152 architecture, while also highlighting the contributions of SEA and SA, albeit to a lesser extent. Moreover, the absence of attention mechanisms correlates with diminished performance, emphasizing the importance of incorporating attention mechanisms for enhanced classification accuracy.
Classification performance of RN152 variants.

Acc: accuracy; Pre: precision; Re: recall; F1: F1-score; Spe: specificity; RN: ResNet; CCNN: custom convolutional neural network; CACNN: channel attention convolutional neural network; SACNN: soft attention convolutional neural network; SEACNN: squeeze and excitation attention convolutional neural network.
The tables above illustrate the results obtained for the 24 variants of the CNN models used in this study before any ensemble techniques were applied. These tables provide a comprehensive overview of key evaluation metrics, including accuracy, precision, recall, F1-score, and specificity, for each model variant. From the performance evaluation, it is evident that different attention mechanisms yield varying degrees of effectiveness across different models. For some models, CA demonstrated superior performance, while for others, SA or SEA proved more effective. Additionally, there are instances where models without any attention mechanisms performed better. Given this variability, it is clear that relying on a single model or one specific attention mechanism is not optimal. Instead, employing an ensemble approach is justified to combine outputs from various models, thereby creating a more generalized and robust model for breast cancer classification. The ensemble approach is executed in three levels using techniques such as MV, WAvg, and SAvg.
The performance metrics in Table 10 illustrate that for all DN and RN models, the first level of ensembling using MV, SAvg, and WAvg generally results in the same or improved accuracy compared to individual model performance. Notably, the WAvg technique consistently outperforms MV and SAvg across almost all models, delivering better precision, recall, F1-score, and specificity. This superior performance of WAvg is the reason it was exclusively used in the subsequent second and third ensemble layers. The highest accuracy was achieved by the DN121 variant, with an accuracy of 99.58%, while the RN50 variant had the lowest accuracy at 98.99%.
Performance measure indices (first ensemble).

Acc: accuracy; Pre: precision; Re: recall; F1: F1-score; Spe: specificity; DN: DenseNet; RN: ResNet; MV: majority voting; SAvg: softmax averaging; WAvg: weighted averaging.
The performance metrics presented in Table 11 indicate the results of the second level of ensembling for DN and RN models. The DN ensemble achieves a high accuracy of 99.58%, with equally high precision, recall, F1-score, and specificity, all at 99.58% and 99.37%, respectively. The RN ensemble shows slightly lower but still impressive performance metrics, with accuracy, precision, recall, and F1-score of 99.16%, and specificity of 99.18%. These results confirm the effectiveness of the second ensemble layer in maintaining or improving model performance, with DN variants continuing to outperform RN variants in this stage of the ensemble process.
Performance measure indices (second ensemble).

Acc: accuracy; Pre: precision; Re: recall; F1: F1-score; Spe: specificity.
Confusion matrix elements are essential components in evaluating the performance of classification models. True negative (TN) represents the instances where the model correctly identifies negatives, indicating the absence of a condition or event. False positive (FP) occurs when the model incorrectly identifies negatives as positives, suggesting a false alarm. Conversely, false negative (FN) denotes the instances where the model incorrectly identifies positives as negatives, indicating a missed detection. True positive (TP) reflects cases where the model correctly identifies positives, accurately detecting the presence of a condition or event. Together, these elements provide a comprehensive understanding of the model’s predictive capabilities, enabling insights into its accuracy, precision, recall, and overall performance.
Figures 11 to 13 depict the confusion matrices containing TN, FP, FN, and TP values at different ensemble layers.

TN, FP, FN, and TP values after layer 2 DenseNet ensemble. TN: true negative; FP: false positive; FN: false negative; TP: true positive.

TN, FP, FN, and TP values after layer 2 ResNet ensemble. TN: true negative; FP: false positive; FN: false negative; TP: true positive.

TN, FP, FN, and TP values after layer 3 final ensemble. TN: true negative; FP: false positive; FN: false negative; TP: true positive.
Table 12 of the dense-ResNet final ensemble showcases outstanding performance metrics across benign and malignant classes, with an impressive overall accuracy, precision, recall, and F1-score of 99.58%. This uniform excellence highlights its robustness in accurately classifying instances from both classes. These results underscore the dense-ResNet ensemble’s significant contribution to improving classification accuracy.
Performance measure indices for dense-RresNet (final ensemble).

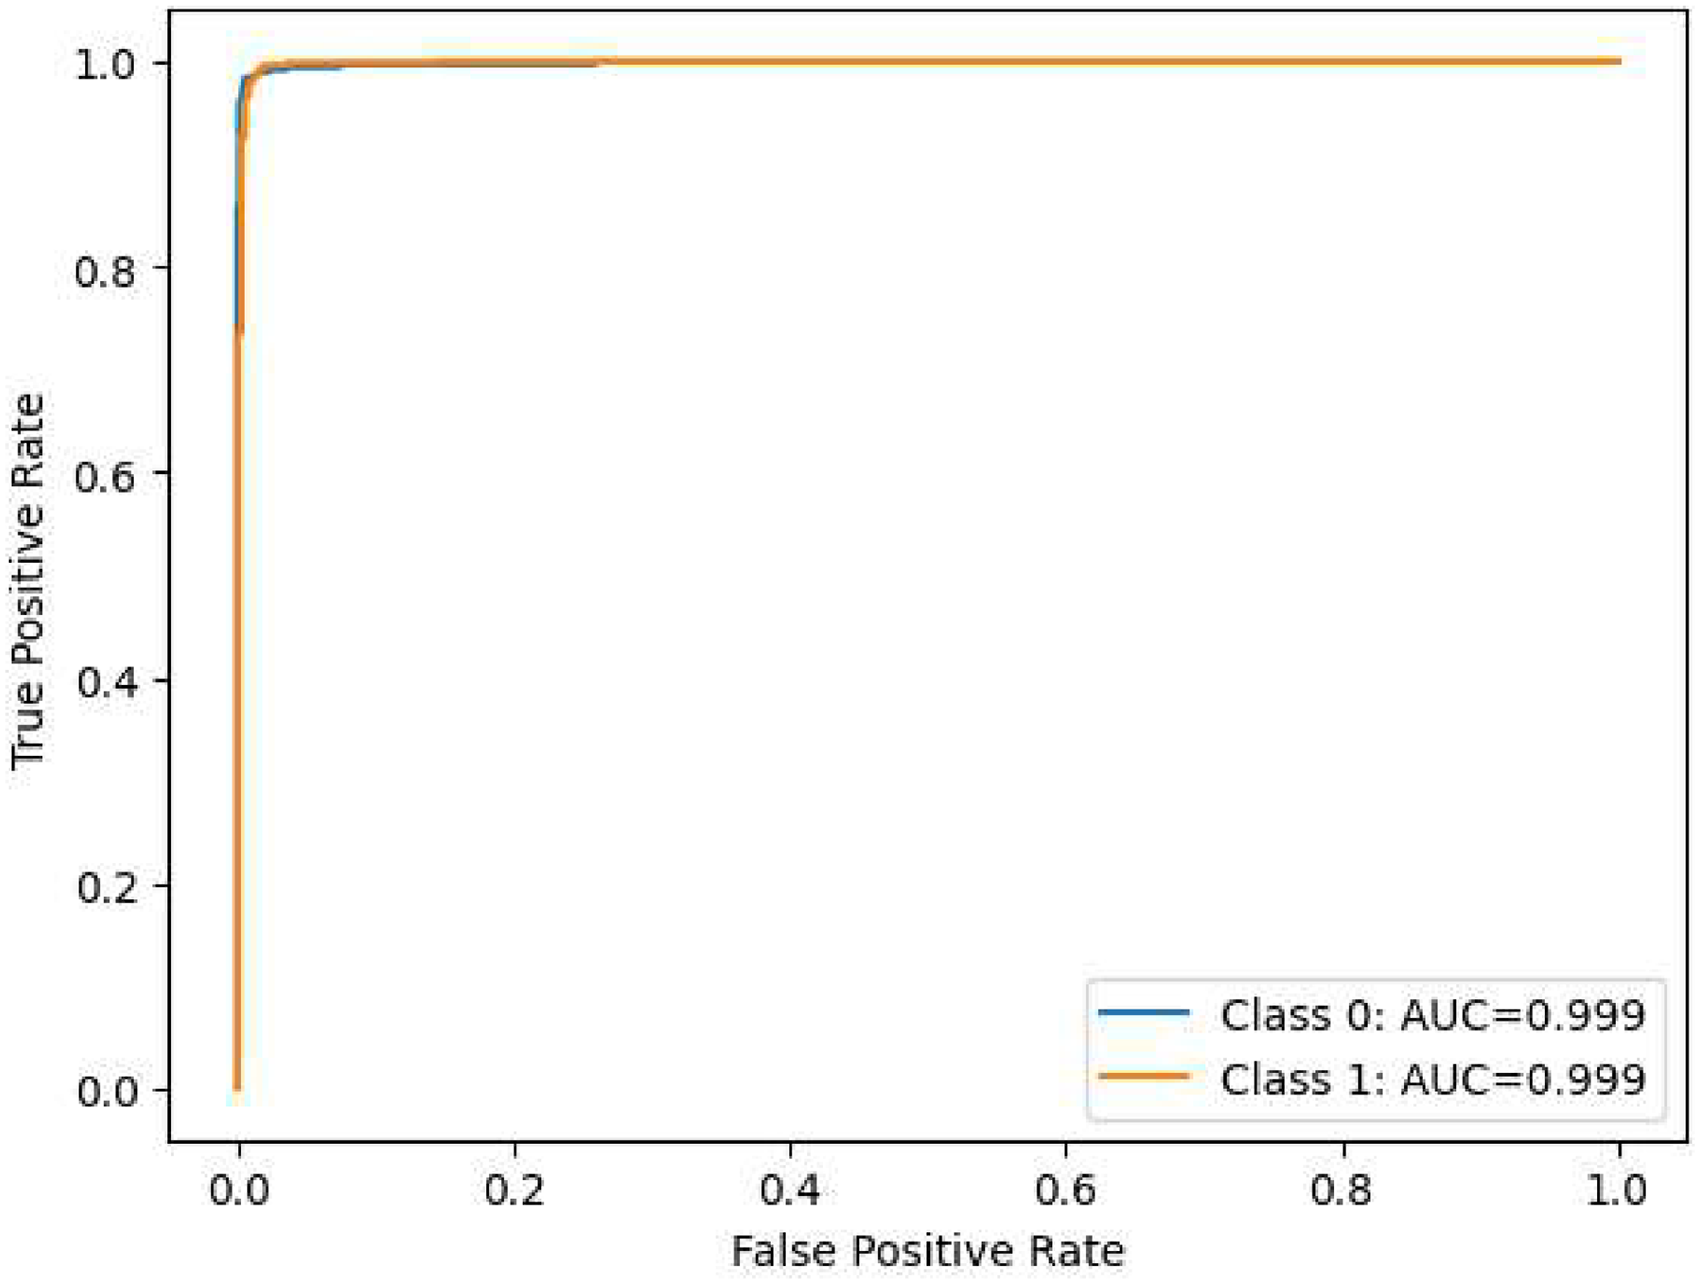
The performance assessment of our model across various layers is depicted through nine visualizations: Figures 14 to 22. The initial six visualizations showcase the ROC curves for the ensemble of DN and RN architectures at the first layer of ensembling, integrating the CCNN, CACNN, SACNN, and SEACNN variants. Specifically, Figure 20 portrays the ROC curves for the ensemble of DN at the subsequent layer, while Figure 21 presents the ROC curves for the ensemble of RN at the same layer. Lastly, Figure 22 illustrates the ROC curves for the ultimate ensemble, amalgamating both RN and RN architectures at the third layer. These visual representations provide a comprehensive insight into the model’s classification efficacy at different evaluation stages, facilitating a thorough analysis of its performance in breast cancer detection. Furthermore, the ROC curves vividly demonstrate the model’s capability to differentiate between various classes, offering valuable insights into its discriminatory prowess.

Area under the receiver operating characteristic curve (ROC-AUC) of ensembled DenseNet-121.
Area under the receiver operating characteristic curve (ROC-AUC) of ensembled DenseNet-169.

Area under the receiver operating characteristic curve (ROC-AUC) of ensembled DenseNet-201.

Area under the receiver operating characteristic curve (ROC-AUC) of ensembled ResNet-50.

Area under the receiver operating characteristic curve (ROC-AUC) of ensembled ResNet-101.

Area under the receiver operating characteristic curve (ROC-AUC) of ensembled ResNet-152.

Area under the receiver operating characteristic curve (ROC-AUC) of ensembled DenseNet.

Area under the receiver operating characteristic curve (ROC-AUC) of ensembled ResNet.

Area under the receiver operating characteristic curve (ROC-AUC) of ensembled DenseNet and ResNet.
The tables presented earlier vividly demonstrated significant improvements following each successive ensemble iteration. Substantial enhancements were observed not only after the initial ensemble but also following subsequent second and third-level ensemble procedures. After the final (third) ensemble, this model achieved impressive performance metrics with accuracy, precision, recall, and F1-score reaching 99.58%. Additionally, the specificity score stood at 99.37%.
Statistical analysis for performance validation
To ensure the robustness of our proposed model, we conducted a random train-test splitting procedure, wherein the dataset was randomly partitioned into training, validation, and test sets three times. Each split generated a unique configuration for the training and testing datasets, thereby allowing us to evaluate the model’s performance comprehensively. After applying the model to each of the three datasets, we recorded the accuracy for both the benign and malignant classes. The results demonstrated a remarkable accuracy of 100% for two of the datasets. However, the second dataset exhibited an accuracy of 98.5%. This systematic approach underscores the reliability of our model in classifying breast cancer images. Table 13 presents the results of the statistical analysis conducted to evaluate the model’s performance across the different datasets.
Accuracy results for randomly split datasets.

Answers to the research question
Ensemble techniques are noted for their advantages over single algorithms. By amalgamating predictions from multiple models, these techniques effectively mitigate the impact of outliers and help alleviate overfitting tendencies. Additionally, ensemble architectures capitalize on the strengths of diverse models, fostering improved decision-making and enhanced generalization capabilities, contributing significantly to the higher accuracy observed.
Discussion
The innovative dense-ResNet model, an amalgamation of DN and RN architectures, exhibited superior performance in breast cancer classification compared to individual pre-trained models. Table 14 presents for a comprehensive comparison, highlighting the efficacy of the dense-RN attention integration architecture alongside existing models documented in the literature. This evaluation focused on overall results, providing a broader perspective on the model’s superiority and effectiveness within the breast cancer classification domain.
Comparison of proposed dense-ResNet model with existing models.

Acc: accuracy; Pre: precision; Re: recall; F1: F1-score; Spe: specificity; DRAI: dense-ResNet attention integration.
Table 14 highlights the remarkable performance of the dense-RN attention integration architecture, particularly when contrasted with existing models in the literature. The comprehensive array of metrics reported in this study—accuracy, precision, recall, specificity, and F1-score—demonstrate a significant improvement over those observed in previous research. For instance, while the highest accuracy reported in prior studies reached 99.16%, 73 our model achieved an impressive accuracy of 99.58%. Furthermore, dense-RN not only outperformed all other models in terms of accuracy but also excelled in precision, recall, specificity, and F1-score, with values of 99.58%, 99.58%, 99.37%, and 99.58%, respectively. This indicates that the dense-RN attention integration architecture excels across multiple performance metrics, underscoring its potential as a superior solution for breast cancer classification. This performance level is noteworthy and indicates that no other methods in prior research have achieved such promising outcomes across all evaluated metrics.
The performance of the dense-RN model can be attributed to several key factors. First, the integration of attention mechanisms enhances the model’s ability to focus on critical features within the images, thereby improving the overall classification accuracy. By utilizing CA, SA, SE blocks, and other advanced techniques, our architecture can dynamically adjust its focus based on the contextual relevance of features, which is particularly beneficial in medical imaging scenarios where subtle distinctions can significantly impact diagnostic outcomes.
Moreover, the ensemble approach employed in our methodology further contributes to the model’s effectiveness. By systematically amalgamating predictions from various model layers through techniques such as MV, SA, and WV, we were able to enhance the robustness of the predictions. This layered ensembling strategy not only reduces the potential for overfitting but also fosters a more comprehensive decision-making process, as it leverages the strengths of different architectures.
The findings from our study advocate for the potential of the dense-RN attention integration architecture as a promising solution for breast cancer classification. The impressive results demonstrate not only its accuracy but also its ability to serve as a reliable diagnostic tool, paving the way for advancements in medical image analysis. The insights gleaned from this research underscore the importance of integrating modern ML techniques with clinical practice, ultimately aiming to enhance the precision and reliability of breast cancer diagnostics.
Threats to validity
While the BreakHis dataset was leveraged in this study, and the dense-RN attention integration architecture was employed to proficiently classify breast cancer instances into benign and malignant categories, several potential limitations and threats to the study’s validity warrant consideration.
To mitigate these threats, future extensions of this research should focus on augmenting the dataset with additional breast cancer subtypes and integrating diverse datasets like curated subsets from DDSM or other repositories. Moreover, exploring metadata attributes related to breast cancer lesions or patients could enhance the model’s accuracy and facilitate a more comprehensive understanding of breast cancer classification.
Conclusion and future work
In conclusion, this study presents a groundbreaking approach to the automated classification of breast cancer using the innovative DRAI architecture. Through rigorous evaluation with TLE, our model achieved an exceptional accuracy rate of 99.58%, surpassing existing methodologies and demonstrating the effectiveness of our fusion architecture in distinguishing between benign and malignant cases. By addressing the challenges inherent in traditional diagnostic methods and leveraging advanced technologies such as AI and ML, our automated classification framework offers a robust and highly accurate methodology for breast cancer diagnosis.
This study’s limitations include reliance on the BreakHis dataset, which may hinder the model’s generalizability to other datasets. Additionally, the focus on only benign and malignant classes limits the analysis, as various breast cancer subtypes are not represented, potentially affecting the model’s broader applicability.
We have shown that augmenting imbalanced datasets, customizing and fine-tuning pre-trained models, integrating attention mechanisms, and employing ensemble approaches are effective strategies for improving the accuracy and reliability of breast cancer classification models. By ensuring a balanced class distribution, optimizing feature extraction, and enhancing model generalization, our approach not only mitigates manual errors but also accelerates the diagnostic process, ultimately leading to improved patient outcomes. Future research should prioritize augmenting datasets with diverse breast cancer subtypes and integrating metadata attributes for comprehensive analysis. Cross-dataset validation on independent datasets, such as DDSM subsets, is crucial to assess model generalization. Exploring advanced architectures and techniques tailored for histopathological image analysis, including attention mechanisms and ensemble strategies, holds promise for improving model accuracy. Additionally, investigating semi-supervised learning and TL can enhance model performance in resource-constrained settings. These endeavors will advance automated breast cancer diagnosis, yielding more reliable models with improved clinical utility and broader applicability.
Footnotes
Acknowledgements
We thank the Computer Science and Engineering Department of Rajshahi University of Engineering and Technology, Bangladesh for supporting the study process.
Contributorship
Mohammad Sakif Alam: conceptualization, methodology, software, validation, data analysis, visualization, and manuscript drafting. Anwar Hossain Efat: conceptualization, methodology, data curation, investigation, validation and manuscript drafting. SM Mahedy Hasan: conceptualization, resources, investigation, manuscript review, and supervision. Md Palash Uddin: investigation, manuscript review, manuscript finalization, and supervision.
Declaration of conflicting interests
The author(s) declared no potential conflicts of interest with respect to the research, authorship, and/or publication of this article.
Ethical approval
This research is not subject to ethical approval since the research did not have participants (humans or animals).
Funding
The author(s) received no financial support for the research, authorship, and/or publication of this article.
Gurantor
MPU.
Consent statement
In accordance with the ICMJE guidelines, we confirm that patient consent was not applicable to this study. This study did not involve human subjects, and all data were obtained from publicly available sources.