
Abstract
Background
Although the prevalence of childhood illnesses has significantly decreased, acute respiratory infections continue to be the leading cause of death and disease among children in low- and middle-income countries. Seven percent of children under five experienced symptoms in the two weeks preceding the Ethiopian demographic and health survey. Hence, this study aimed to identify interpretable predicting factors of acute respiratory infection disease among under-five children in Ethiopia using machine learning analysis techniques.
Methods
Secondary data analysis was performed using 2016 Ethiopian demographic and health survey data. Data were extracted using STATA and imported into Jupyter Notebook for further analysis. The presence of acute respiratory infection in a child under the age of 5 was the outcome variable, categorized as yes and no. Five ensemble boosting machine learning algorithms such as adaptive boosting (AdaBoost), extreme gradient boosting (XGBoost), Gradient Boost, CatBoost, and light gradient-boosting machine (LightGBM) were employed on a total sample of 10,641 children under the age of 5. The Shapley additive explanations technique was used to identify the important features and effects of each feature driving the prediction.
Results
Conclusion
The XGBoost classifier was the best predictive model with improved performance, and predicting factors of acute respiratory infection were identified with the help of the Shapely additive explanation. The findings of this study can help policymakers and stakeholders understand the decision-making process for acute respiratory infection prevention among under-five children in Ethiopia.
Keywords
Background
Even though the prevalence of childhood illnesses has significantly decreased, diarrhea and acute respiratory infections (ARI) continue to be the leading causes of death and disease among children in low- and middle-income countries. 1 ARI is an infection that occurs at many sites along the respiratory system and interferes with an individual's regular breathing activity. 2 It is one of the leading causes of illness and death in children under the age of 5. 3 Acute upper respiratory infections affect the airways from the nose to the larynx's vocal cords, whereas acute lower respiratory infections affect the airways from the trachea and bronchi to the bronchioles and alveoli.4,5 “Acute respiratory infection is characterized by cough accompanied by short rapid breathing and commonly resulted in death through co-morbidities with other childhood illnesses”.6,7 Pneumonia is one of the most serious manifestations of ARI among children under five.8,9
ARIs have been attributed to 73% of the estimated 10.4 million deaths of children under the age of 5 worldwide. 10 Sub-Saharan Africa continues to have the highest under-five mortality rate in the world, with 1 in 13 children dying before turning five, although the world as a whole has been making rapid progress in lowering this rate. 11 Five countries, Nigeria, India, Pakistan, the Democratic Republic of the Congo, and Ethiopia, accounted for half of all deaths among children under the age of 5 in 2019, and Nigeria and India alone were present in nearly one-third of all deaths. 11 In 2017, an estimated 5.4 million under-five children died, with Sub-Saharan Africa accounting for almost half of those deaths, and ARIs accounting for the greatest number of deaths. 12 Lower respiratory tract infection was recognized as one of the leading causes of death in children under the age of 5. 13
According to the 2016 Ethiopian demographic and health surveys (EDHS), 7% of under-fives experienced symptoms of ARI in the 2 weeks preceding the EDHS, with 3 out of 10 of these children seeking treatment. 14 Evidence suggests that children are more susceptible to ARIs than adults due to several factors, including sex, age, place of residence, maternal occupation, number of living children, wealth index, region, children's faster breathing rates, and greater metabolic rates. 15 The prevalence of ARI among children under the age of 5 was 13% in 2005; as a result, the magnitude decreased to 7% in the EDHS 2011; however, the prevalence remained at 7% in the EDHS 2016. 4 Although numerous studies have been conducted using classical analysis, as per our search, none of them considered machine learning (ML) approach in Ethiopia. Therefore, the current study was conducted to identify interpretable predicting factors of ARI disease among under-five children in Ethiopia using ML analysis techniques.
Machine-learning techniques have been effectively used to anticipate adverse events in healthcare settings by utilizing statistical techniques to infer correlations between patient variables and outcomes in large datasets. 16 ML solutions began to be presented as the COVID-19 pandemic spread globally, mostly for early disease detection or for determining the severity of the infection. 17 Artificial intelligence is thought to enhance any procedure used in the operation and provision of healthcare. 18 ML technology does not require assumptions regarding the input variables and their relationship with the output. The advantage of this completely data-driven learning without relying on prior assumptions makes ML a reasonable and feasible approach. 19 Despite its benefits, ML has its own drawbacks; The “black-box” nature of ML algorithms makes it challenging to explain why specific predictions should be made. Thus far, the lack of interpretability has hampered the application of more powerful ML methods in medical decision assistance, 16 and one of the primary barriers to ML deployment in the medical industry is the lack of intuitive comprehension of ML models. 20 Understanding what drives a prediction is important for determining targeted interventions in a clinical setting. To address these disadvantages, this study combines an advanced ML technique with a framework based on Shapley additive explanations (SHAP). 21 The findings of this study, which focused on ARI among children under five, will help accomplish Goal 3 of the 2030 Sustainable Development Goals, which aims to eliminate preventable newborn and child mortality in all nations. 22
Methods and materials
Study design and setting
A population-based cross-sectional survey was conducted from January 18 to June 27, 2016, in nine geographic regions and two administrative cities of Ethiopia. During the 2016 EDHS interviews, a standardized and pre-tested questionnaire was used to collect data, and interviewers used tablet computers to record responses. Details of this procedure are available from the Central Statistical Agency. 14 This study employed a predictive modeling approach based on secondary data obtained from EDHS to undertake the analysis.
Data source and population
Data were obtained from the measure of the EDHS program 2016 kid's file (KR). The survey datasets were accessed through the web page of the International Measure of EDHS Program 23 after subscription and the appropriate letter is acknowledged. All mothers aged 15–49 who had at least one child in the five years preceding the survey prior to EDHS 2016 were considered the source population.
Inclusion and exclusion criteria
Children between the ages of 0 and 59 months who resided with their families and whose parents agreed to participate in the study were considered to meet the inclusion criteria. Children whose mothers or caregivers declined to participate in the study, mothers or caregivers of children who were seriously ill at the time of data collection, or children who were receiving treatment for a confirmed severe respiratory illness were excluded.
Sampling procedure and sample size determination
The 2016 EDHS used two stages of stratified sampling technique to select the study participants. Enumeration areas were chosen at random in the first step, and households were chosen in the second stage (Figure 1). The detailed sampling procedure was presented in the full EDHS report.14,24 A total of 11,022 weighted samples and 10,641 actual sample sizes were considered for this analysis.

Sampling procedure for the study predictors of ARI among children under the age of in Ethiopian, 2016 EDHS.
Operational definition
ARI was defined as children who had a history of coughing, short, quick breathing, and/or breathing problems, as reported by their mothers or other caregivers within the two weeks before the survey.6,25 Co-morbidity was defined as the presence of one or more other illnesses that co-occur with the primary illness based on patient-reported information. In this study, comorbid illnesses included medications for intestinal parasites, anemia status, malnutrition, and diarrhea in children under the age of 5.
Study variables
The presence or absence of ARI in a child under the age of 5 was the outcome variable, categorized as (0 = indicate the absence of ARI and 1 = to indicate the presence of ARI). A variety of sociocultural, demographic, and environmental risk factors predispose children under five to experience ARI. 26 Baseline explanatory variables were selected based on previous studies.4,6,25,27–29 Sociodemographic and socioeconomic factors include the sex of the child (male, female), age of the child in months (<6, 6–11, 12–23, 24–35, 36–47, and 48–59), residence (urban and rural), maternal education (no education, primary, and secondary & higher), maternal occupation (not working, professional, and not professional), number of living children (1–3 child, 4–6 child, and six & above), wealth index (poor, middle, and rich), maternal age (15–19, 20–34, and 35–49), and region was identified. Health and nutritional status include breastfeeding (never breastfeeding, ever breastfeeding/not currently, and still breastfeeding), receipt of vitamin A in the last 6 months (yes or no), vaccination status (yes if taking any vaccine and no for never had vaccinated), anemia status of the child (anemic and not anemic), history of diarrhea (yes or no), and children received no drugs for intestinal parasites in the last 6 months (yes or no). Using the WHO-recommended child physical growth indices, z-scores for “height-for-age (stunting)” and “weight-for-height (wasting)” were calculated to assess the nutritional status of children. 14 Environmental factors include types of cooking fuel (safe/clean and unclean/unsafe), source of water (improved and unimproved), and toilet facility (improved and not improved).
Data management and analysis
A total of 10641 actual samples with selected variables were extracted from the measures of EDHS 2016 using STATA software version 17 and exported to the csv file. Then the data was imported into a Jupyter notebook for further analysis. To make data suitable for ML tasks, explanatory data analysis, missing value management, data discretization, outlier detection, balancing target features, and feature selection were applied as preprocessing tasks. After all, data split, training, and test data were performed to fit a model selected for this purpose. Only variable pass feature selection was fitted to the model. In this study, ensemble MLs, such as AdaBoost, eXtreme gradient boosting (XGBoost), Gradient Boost, CatBoost, and LightGBM from boosting technique, were used. The performance of the model was measured on test/unseen data using different metrics like confusion matrix, Jaccard score, and receiver operating curve area under the curve (AUC). Finally, the prediction of ARI disease was made after hyperparameter tuning of the best-performed model. In this study, hyperparameter tuning was performed using the grid search method. The study utilized pattern search using the Apriori algorithm to identify the precise category associated with ARI among under-five children. All analyses were performed using Python 3 programming language in Jupyter Notebook using imblearn, sklearn, 30 XGBoost, 31 and SHAP 21 packages.
Data preprocessing
In this study, dealing with missing or null values, data discretization, data transformation, feature selection, and target variable balance were done as the key pre-processing procedures. The imputation approach was used to fill in the gaps left by the initial raw data's inadequacy. For this purpose, missing values were imputed using k-nearest neighbor imputation for numerical variables, and modes were used for categorical variables. Data on vaccination was available only for children less than 36 months, whereas we were interested in all children below age five. While imputing missing values, the vaccination status of the child had a 63.15% missing value so we decided not to use this variable. In order to deal with ML tasks, data should be transformed into a format that is understandable by ML algorithms. Among various feature engineering techniques encoding categorical variables into numeric values, nominal variables were encoded using one hot encoder, and ordinal variables were encoded using an ordinal encoder.
The process of obtaining a subset from an initial feature set in accordance with a specific feature selection criterion, which chooses the pertinent features of the dataset, is referred to as feature selection. 32 A feature selection technique can pre-process learning algorithms, and effective feature selection outcomes can increase learning accuracy, reduce learning times, and simplify learning outcomes. 33
Dataset target imbalance is a major preprocessing data that should be taken into consideration. In this study, various data-balancing methods such as majority class random under-sampling, random oversampling, and synthetic minority oversampling technique (SMOTE) were applied to the datasets.
Following data balance, data splitting was performed. Every ML needs training and a test dataset to predict accurately certain objectives. In this paper, we used 10-fold cross-validation, a part of the Jack Knife Test. K-fold cross-validation is a method that divides the dataset randomly into training and testing datasets. In this method, the dataset splits into “k” sub-samples, in which one sample is used for testing and the rest k-1 dataset is used for training purposes. 34 In the k-fold cross-validation method, the whole process is repeated k-times by changing the training and testing datasets, and further, the best model is selected by obtaining minimum error based on various error estimation statistical tools. 35 Only features selected by the mutual information selection method were exposed to data split and model development. The summary of steps followed was indicated as follows (Figure 2).

Overview of data preprocessing and model development applied (architecture).
Ethical consideration and consent to participate
There was no need for ethical clearance, as the researcher did not interact with respondents or study attendants. The data used was obtained from the Measure of EDHS program and permission for data access has been granted through an online platform by filling all requirements needed to access data. Data used for this study were publicly available at http://www.dhsprogram.com. There are no names of individuals or household addresses in the dataset. Details of the ethical considerations of the Demographic and Health Survey program can be accessed from; https://dhsprogram.com/methodology/Protecting-the-Privacy-of-DHS-Survey-Respondents.cfm.
Result
Socioeconomic and sociodemographic characteristics
The results show that the majority of the children (88.97%) lived in rural areas, while the rest lived in urban areas. Additionally, there were slightly more male children (51.94%) than female children. The children's ages varied with the largest group falling between 48 and 59 months (21.23%), followed by 36–47 months (19.53%) and 24–35 months (18.70%). Regarding the mothers, most of them were between 20 and 34 years old (71.76%), and the majority had no education (68.57%). In terms of occupation, 63% of mothers were not professional workers, while 22% were professionals. The number of living children varied, with 48.64% having 0–3 children and 35.91% having 4–6 children. A summary of socioeconomic and sociodemographic characteristics is indicated as follows in Table 1.
Socioeconomic and sociodemographic characteristics of children under the age of five in Ethiopia, Ethiopian demographic and health surveys (EDHS) 2016.

Environmental factor characteristics
The results show that the majority of households (86.65%) used unsafe fuel types for cooking and heating, while only 13.35% used clean and safe fuel types. In terms of drinking water, 84.45% of households had access to clean and safe drinking water, while 15.55% had access to improved drinking water sources. Regarding toilet types, the majority of households (83.76%) used unimproved toilets, while only 16.24% used improved toilets (Table 2).
Environmental factor characteristics of children under the age of five in Ethiopia, Ethiopian demographic and health surveys (EDHS) 2016.

Health and nutritional status characteristics
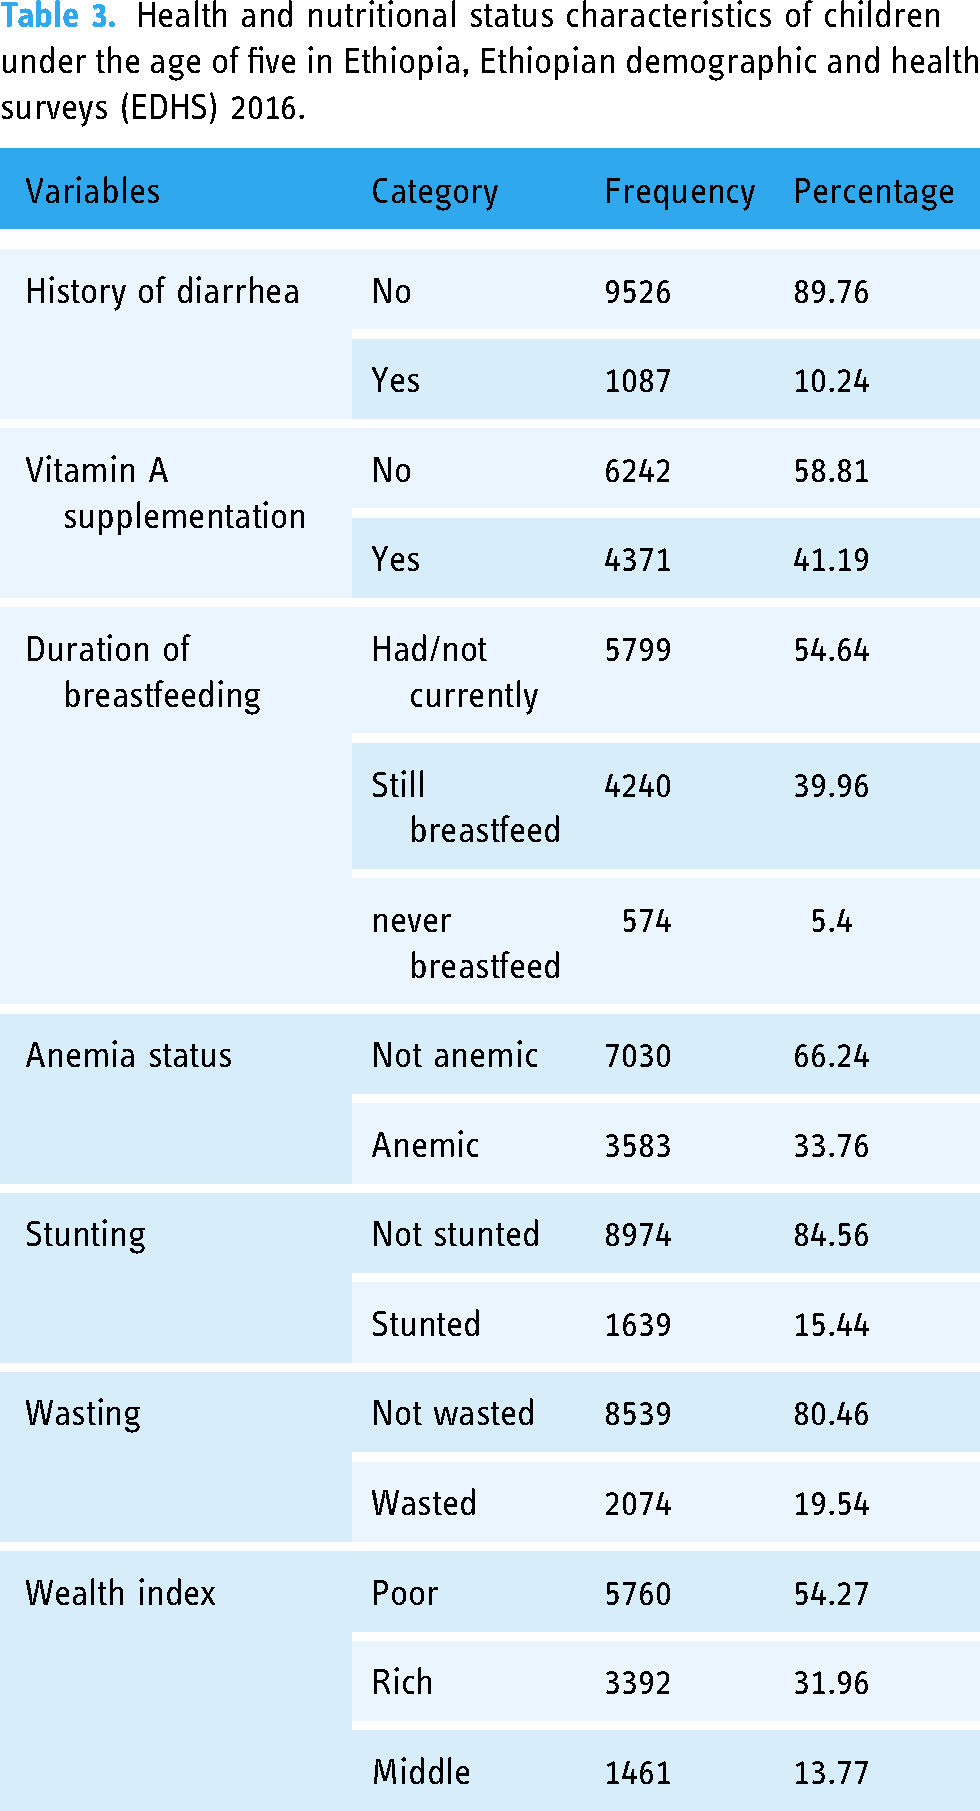
The results indicate that 10.24% of under-five children had a history of diarrhea, while 41.19% received vitamin A supplementation. The majority of children (54.64%) were breastfed but not currently, while 33.76% were anemic. Additionally, 15.44% of children were stunted, and 19.54% were wasted. Finally, the wealth index shows that 54.27% of children belonged to the poor category, while 31.96% were rich and 13.77% were middle-class (Table 3).
Health and nutritional status characteristics of children under the age of five in Ethiopia, Ethiopian demographic and health surveys (EDHS) 2016.
ML analysis of ARI disease
In this study, variance threshold and mutual information from the filter method, recursive feature elimination from the wrapper method, and the Boruta_py algorithm were applied. Finally, mutual information achieved the best performance with 14 features. The performance of all methods was evaluated using f1_score (Figure 3).
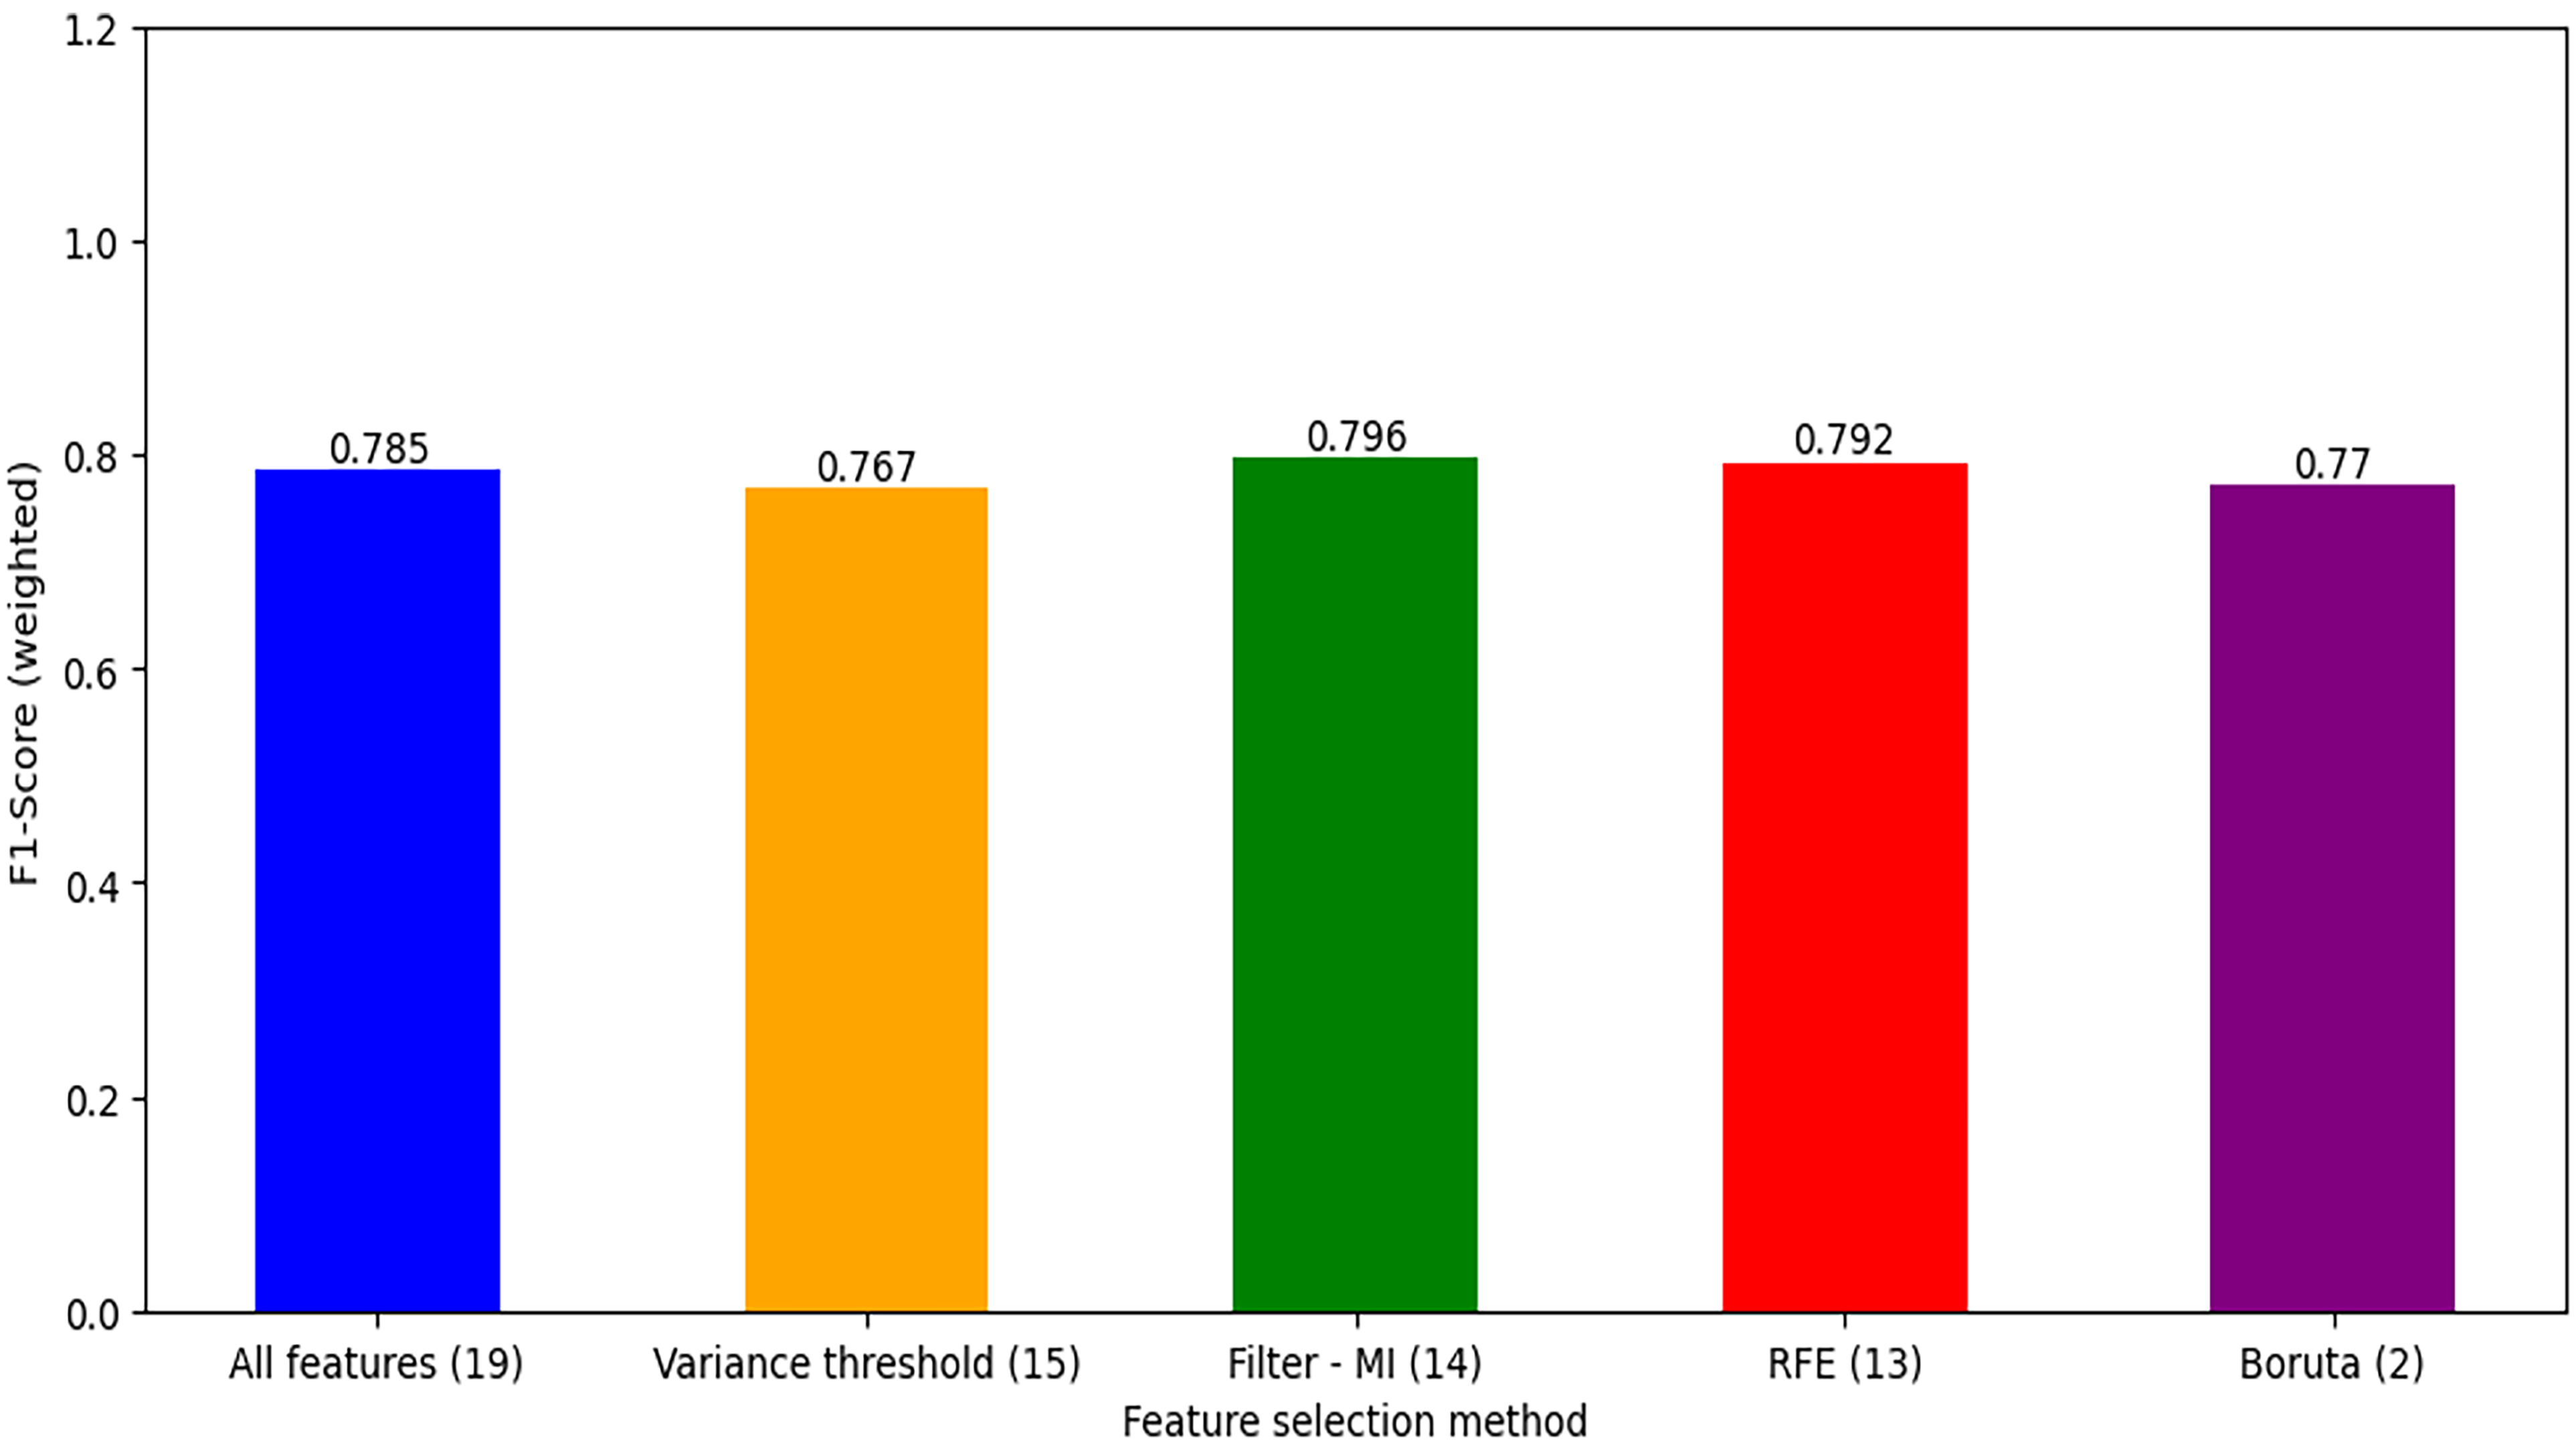
Feature selection method applied.
After applying various data balancing techniques, a model trained on data balanced through SMOTE achieved the best performance and was used to manage class imbalance to the target variable. Figure 4 shows the distribution of the training dataset before and after balancing.

Distribution of acute respiratory infection (ARI) before and after balancing.
Model development
In this study, five different ensemble boosting ML techniques were applied for the prediction of ARI disease. All models were trained both on balanced and unbalanced data with default hyperparameter values (these default hyperparameter values are clearly stated in Scikit-learn API documentation and readers may read it for further understanding). The performance of the model was evaluated using the F1 score, accuracy, and Jaccard score (Table 4). Therefore, this study may contribute to the development of an improved ARI prediction model that considers the entire dataset of the EDHS 2016.
Model performance comparison.

AdaBoost: adaptive boosting; LightGBM: light gradient-boosting machine; XGBoost: extreme gradient boosting.
Before balancing the data, all models had great accuracy, but we noticed that they were all misleading because of their very low f1scores and Jaccard scores. Performance measurement in accuracy is not suitable for more unbalanced data because it measures within the specific point of action and it also depends on only the true positive and true negative observations this leads to bias in the performance. 36 By balancing the target variable, this problem was resolved, and the XGBoost model subsequently achieved the best accuracy of 73.48%, an F1 score of 73.72%, and a Jaccard score of 58.38%.
Hyperparameter tuning was applied to the model that performed best, which is XGBoost in our study. In ML models, there are two different types of parameters: one that can be set up and updated as data is learned, and the other, known as hyper-parameters, which cannot be directly estimated from data learning and must be set up before training an ML model because they specify the model's architecture. 37 Using automated hyperparameter optimization, ML algorithms can perform better (by tailoring them to the problem at hand). This approach has produced cutting-edge results for significant ML benchmarks in numerous research. 38 In this study, hyperparameter tuning was done using the grid search method with 10-fold cross-validation by setting different parameters before training. Then model pulled best parameters as n_estimators = 500, max_depth = 10, learning_rate = 0.1, subsample = 0.8, and colsample_bytree = 1.0. Hyperparameter tuning improved XGBoost model performance from an accuracy of 73.48% to 79.3% and an F1 score of 73.72% to 78.4%.
Prediction of ARI disease
After hyperparameter tuning, the prediction of ARI was made on previously unseen data. In this study, accuracy, precision, recall, and area under the curve are used for evaluating the proposed method adapted from the previous study. 39 Out of 884, the presence of the ARI model predicted 667 of them as true positives and misclassified 217 as false negatives that should be the presence of ARI. The model predicted 752 as true negatives, meaning the absence of ARI, and misclassified 133 as false positives, which should be the absence of ARI. The predicted value is indicated below by decision matrix 2 × 2 table (Figure 5). Overall, the XGBoost model achieved an accuracy of 79.3%, an f1 score of 78.4% recall of 78.3%, a precision of 81.7%, and a receiver operating curve AUC of 86.1% after model optimization. A detail of the decision matrix was adapted from ref. 36, and a summary of model performance indicated by the receiver operating curve AUC is shown in Figure 6.

Decision matrix extreme gradient boosting (XGBoost) on test data.

XGBoost model performances by receiver operating curve (AUC).
Visualization of feature importance using SHAP
After hyperparameter tuning, feature importance was indicated using SHAP 21 packages as shown in Figure 7 on the left. The result shows that child age in months, history of diarrhea in last 6 months, number of living children, duration of breastfeeding, mother’s occupation, and wealth index sex of child were the top predicting factors of ARI among under-five children in Ethiopia 2016 EDHS dataset. The distribution of the top 10 predictors versus the presence of ARI is indicated in Supplemental 1.

Feature importance of ARI among under five children in Ethiopia, EDHS 2016.
SHAP values can be used in ML to quantify the contribution of each feature in the model that collectively delivers the prediction. 40 Shapley value has a number of useful properties such as efficiency (requirement that all feature contributions total up to the difference between the prediction and the average), symmetry, dummy, and additivity. 41 The prediction model's importance is indicated by the feature ranking (y-axis). The SHAP value (x-axis) is a unified index that responds to the influence of a certain feature in the model. In each feature important row, the attributions of all variables to the outcome were drawn with dots of different colors, where the red dots represent the high-risk value and the blue dots represent the low-risk value (Figure 8). The order of the variables is based on how significant each global trait is, with the first variable being the most important and the last one being the least important.

Impact of each feature on model prediction of ARI among under-five children in Ethiopia, EDHS 2016.
Association rule mining
Association rule mining is a technique to discover how features are associated with each other. 42 As a result, it could be decided that features that significantly relate to one another should be used as input during the categorization step. According to association rules, the existence of some item sets will infer the presence of other item sets within the same groups, which helps us find the items that frequently appear together in an application. 43 A popular algorithm of association rule mining, Apriori algorithm, is used for feature selection and rules would be extracted according to the confidence level. 44 The higher the confidence level of a rule, the more important a feature is. The Apriori algorithm generates eight (8) rules that have a confidence level greater than 60.17%.
Rule 1 IF “dur_Bfeed_never Bfeed,” “child_ageM_<6month THEN target_yes, confidence 0.624, lift 1,25.”
Interpretation: if a child never breastfeeds and the age of the child is less than 6 months, then the probability for the presence of ARI is 62.4%.
Rule 2 IF “stunting_not stunted,” “mothers_occu_not working,” THEN target_yes, confidence 0.622, lift 1.224.
Interpretation: If a child is not stunted and the mother is not working, then the probability of the presence of ARI is 62.2%.
Rule 3 IF “dur_Bfeed_never Bfeed,” “stunting_not stunted,” “num_living_child_4-6chil,” “wasting_not wasting” THEN target_yes confidence 0.612 lift 1.22.
Interpretation: If a child never breastfeeds, is not stunted, lives with 4–6 siblings, and is not wasted, then the probability for the presence of ARI is 61.2%.
Rule 4 IF “stunting_not stunted,” “mothers_occu_not working,” “wasting_not wasting THEN target_yes confidence 0.61, lift 1.216.”
If a child is not stunted, the mother is not working, and the child is not wasted, then the probability of the presence of ARI is 61.0%.
Discussion
This study focuses on identifying important predictors that contribute to ARI disease among under-five children in Ethiopia based on the EDHS dataset. For this purpose, we employed five ensemble boosting ML algorithms; Adaboost, Catboost, Gradient boosting, LightGBM, and XGBoost. Data cleaning, missing value imputation, discretization, balancing target variable feature engineering, and feature selection were done as preprocessing tasks before fitting ML models. All ML models were trained on both balanced and unbalanced data after splitting data into train and test datasets using 10-fold cross-validation. Model optimization was applied using the grid search method to the best-performed model, which is the XGBoost model in our study. Finally, the prediction of ARI was made on unseen data or test data that were reserved using k-fold and the performance of the XGBoost model prediction was evaluated using accuracy, precision, recall, f1 score, and receiver operating curve AUC. Generally, the XGBoost model achieved an accuracy of 79.3%, an f1 score of 78.4%, a recall of 78.3%, a precision of 81.7%, and a receiver operating curve AUC of 86.1% after model optimization. In addition, a pattern search was made using the common Apriori algorithm to identify the specific category that is associated with ARI respective to the confidence level. Furthermore, we used SHAP to understand what drives prediction and important features were identified using Tree explainable mean value. According to the result child age in months, history of diarrhea in the last 6 months, number of living children, duration of breastfeeding, and mother’s occupation were the top five predicting factors of ARI among under five children in Ethiopia based on data obtained from EDHS 2016.
Based on a pattern search made by the Apriori algorithm, our findings support that children aged less than 6 months were associated with ARI, which is consistent with previous findings in Ethiopia,25,45 Afghanistan, 46 and Ahmadabad City. 47 Similarly studies conducted in urban areas of Oromia region, Ethiopia, 48 Southern Ethiopia, 49 reported that younger children were more likely to develop ARI compared to an older age. This could be due to the fact that as a child grows older, their immunity grows stronger and they are better able to resist infections such as respiratory infections. Another study conducted in sub-Saharan Africa reported children of older age are more likely to be associated with ARI than those of younger age. 50 This discrepancy may be due to the fact that data they used was across different sub-Saharan countries while this study considered only Ethiopia.
In our study, association rule mining revealed that non-breastfeeding children were a contributing factor to ARI among under-five children. It is not surprising that breastfeeding practices in line with WHO recommendations are associated with the occurrence of ARI. The same findings were reported in Dhaka (Bangladesh) that partial or no breastfeeding was associated with attributable factors to ARI and diarrhea. 51 Early initiation of breastfeeding was predominantly less likely to experience ARI among under-five children. 52 In contrast, breastfeeding status was not a significant factor for ARI in the study conducted in Bangladesh. 53 This could be due to differences in environmental factors like air pollution and related. Breastfeeding is more important to the child's nutrition and the good functionality of the child's immunity system.
Our findings showed that a mother’s occupation not working was associated with ARI among under-five children. This result is supported by a previous study conducted in Kenya 54 and Uganda.55,56 This could be due to a number of factors, including lower household income, reduced access to healthcare, and increased exposure to indoor air pollution. This is contrary to a study conducted in Ethiopia. 57 This may be due to data differences in that the study used 2011 EDHS data, while our analysis used the 2016 EDHS dataset. Our study also supports a number of living children with child size 6–7 found to be associated with ARI. This finding is in line with previous findings reported in Bangladesh. 53 A possible explanation could be that families with more children may have limited resources and access to healthcare, which can increase the risk of respiratory infections.
Limitations and strengths of the study
Even though ML algorithms have become increasingly popular in healthcare research due to their ability to identify complex and non-linear relationships among variables, it has some limitations compared to classical statistical methods. Unlike classical statistical models, which typically report measures of association such as odds ratios or hazard ratios, ML algorithms do not always provide the same level of interpretability. Since this finding depends on secondary data, it may be that the responses were affected by recall and social desirability biases. Saying this still, EDHS data is nationally representative data whose method of collection has been through a validated process and its outcome is generalizable. Despite ML algorithms being considered a black-box approach, meaning that it is difficult to understand the decision-making process of the model, in this study, we used the SHAP technique for the illustration of cumulative domain-specific feature importance and visualized interpretation of feature importance. Additionally, we identified features that were overlooked previously while applying the classical model.
Conclusion
This study employed five ensemble boosting ML algorithms to identify the factors contributing to ARI among under-five children in Ethiopia according to the EDHS dataset. All XGBoost models achieved an accuracy of 79.3%, an F1 score of 78.4%, a recall of 78.3%, a precision of 81.7%, and a receiver operating curve AUC of 86.1% after model optimization. The SHAP technique was used to identify the important features driving the prediction, with child age, history of diarrhea, number of living children, duration of breastfeeding, and mother's occupation being the top five predicting factors of ARI. This study highlights the importance of utilizing ML algorithms to identify the factors contributing to ARI and the need for targeted interventions to address the identified factors. The findings of this study can help policymakers and stakeholders understand the decision-making process for ARI prevention among under-five children in Ethiopia.
Supplemental Material
sj-docx-1-dhj-10.1177_20552076241272739 - Supplemental material for Interpretable prediction of acute respiratory infection disease among under-five children in Ethiopia using ensemble machine learning and Shapley additive explanations (SHAP)
Supplemental material, sj-docx-1-dhj-10.1177_20552076241272739 for Interpretable prediction of acute respiratory infection disease among under-five children in Ethiopia using ensemble machine learning and Shapley additive explanations (SHAP) by Zinabu Bekele Tadese, Debela Tsegaye Hailu, Aschale Wubete Abebe, Shimels Derso Kebede, Agmasie Damtew Walle, Beminate Lemma Seifu and Teshome Demis Nimani in DIGITAL HEALTH
Footnotes
Acknowledgment
We appreciate the Measure of Demographic and Health Survey Program for their tremendous work in making the survey data accessible to the general public for study.
Availability of data and materials
Contributorship
ZB made significant contributions to the conception, design, data curation, investigation, data analysis, interpretation, and original draft of the manuscript. TD and SD contributed to data extraction, revising the manuscript, and validation. DT, AW, BL, and AD contributed to revising the manuscript, visualization, and interpretation of the data as well. Finally, all authors reviewed, read, and approved the final manuscript.
Declaration of conflicting interests
The authors declared no potential conflicts of interest with respect to the research, authorship, and/or publication of this article.
Ethical approval and consent to participate
Funding
The authors received no financial support for the research, authorship, and/or publication of this article.
Guarantor
Zinabu Bekele Tadese.
Supplemental material
Supplemental material for this article is available online.
References
Supplementary Material
Please find the following supplemental material available below.
For Open Access articles published under a Creative Commons License, all supplemental material carries the same license as the article it is associated with.
For non-Open Access articles published, all supplemental material carries a non-exclusive license, and permission requests for re-use of supplemental material or any part of supplemental material shall be sent directly to the copyright owner as specified in the copyright notice associated with the article.