
Abstract
Background
Septic shock is a severe complication of acute pancreatitis (AP), often associated with poor prognosis. This study aims to analyze the clinical characteristics of patients with acute pancreatitis and develop an interpretable early prediction model for septic shock in these patients using machine learning (ML). The model is intended to assist emergency physicians in resource allocation and medical decision making.
Methods
Data were collected from the MIMIC-IV 3.0 database. The dataset was divided into a training set and a test set in a 7:3 ratio. Feature selection was performed using LASSO (Least Absolute Shrinkage and Selection Operator) regression. Subsequently, 10 ML models were developed: Random Forest, Logistic Regression, Gradient Boosting Machine, Neural Network, Extreme Gradient Boosting (XGBoost), K-Nearest Neighbor, Adaptive Boosting, Light Gradient Boosting Machine, Category Boosting, and Support Vector Machine. To enhance and optimize model interpretability, Shapley Additive Explanations (SHAP) were employed.
Results
A total of 1032 patients with AP were included in this study, from which 31 variables were selected for model development. By comparing the area under the receiver operating characteristic curve and decision curve analysis results between the training and test sets, the XGBoost model demonstrated a significant advantage over other models. SHAP analysis revealed that white blood cell count, total bilirubin (bilirubin total), and bicarbonate (HCO3–) levels were the three most critical risk factors for the development of septic shock in patients with AP.
Conclusion
ML approaches exhibited promising performance in predicting septic shock in patients with AP. These models may aid in guiding treatment decisions for patients with AP in the emergency department.
Background
Acute pancreatitis (AP) is a common emergency condition, with approximately 20% of patients progressing to severe acute pancreatitis (SAP), which is associated with multiple complications.1,2 Sepsis-induced shock is one of the most frequent and fatal complications in patients with SAP, with an incidence of approximately 10% and a very poor prognosis. Early identification and intervention of septic shock are critical for the prognosis of patients with AP.3,5 Several risk scoring systems have been developed to assess the severity of AP. Commonly used scores include the Ranson criteria, the Acute Physiology and Chronic Health Evaluation II (APACHE II), C-reactive protein (CRP) levels, the Computed Tomography Severity Index (CTSI) and its modified version (mCTSI), the Harmless Acute Pancreatitis Score (HAPS), and the Bedside Index for Severity in Acute Pancreatitis (BISAP) score.6–8 These systems provide an overall assessment of the prognosis of patients with AP but do not specifically analyze the causal relationship between AP and septic shock. Emergency department physicians face a large volume of complex acute cases, and early identification of patients with AP at risk of septic shock is crucial for enhancing clinical decision-making efficiency and optimizing resource allocation, ultimately improving patient outcomes.9,11
Machine learning (ML) is a computational algorithm that learns from data and identifies underlying patterns, capable of uncovering complex relationships within large datasets, making it of significant clinical value.12,13 However, ML models are often criticized for their “black-box” nature, as the process from input to output remains largely uninterpretable, which hinders their clinical application. 14 Shapley Additive Explanations (SHAP), a post hoc interpretability method, addresses this limitation by attributing SHAP values to ML models, thereby offering an effective way to explain and visualize their decision-making process. 15 However, no studies have yet applied SHAP to ML models predicting septic shock in patients with pancreatitis. This study leverages the MIMIC-IV database to develop an interpretable ML model to predict the risk of septic shock in patients with AP, aiding emergency department physicians in the early identification of high-risk patients with AP and informing subsequent treatment decisions.
Methods
Data source
This study is a retrospective analysis based on the MIMIC-IV database. The MIMIC-IV (Medical Information Mart for Intensive Care, version 3.0) is an open-access, freely available critical care database that contains comprehensive clinical data from patients admitted to medical centers between 2008 and 2022. The database includes detailed information on 300,000 emergency department (HOSP) patients and 90,000 intensive care unit (ICU) patients, covering demographic characteristics, vital signs, imaging results, laboratory findings, and other clinical data. Additionally, it includes codes from the International Classification of Diseases, Ninth and Tenth Editions (ICD-9 and ICD-10). The MIMIC-IV database is a publicly available dataset comprising de-identified patient information; therefore, no additional ethical approval is required for its use. 16 Data extraction for this study was approved by the Institutional Review Board (IRB) of the Massachusetts Institute of Technology (MIT) (Certification No: 65828043,Named:Zhihao Li).
Study population
The inclusion criteria for this study were as follows: (1) age ≥ 18 years; (2) diagnosis of acute pancreatitis based on the 2012 revised Atlanta classification criteria 17 ; and (3) diagnosis of sepsis as per the Sepsis-3 definition. 18 Patients were excluded if they met any of the following criteria: (1) chronic pancreatitis; (2) acute pancreatitis resulting from trauma; (3) pregnancy or peripartum period; (4) patients who had already been administered vasopressors at the time of admission to maintain blood pressure; and (5) patients with incomplete clinical data or lacking follow-up information.
Data collection
We first extracted and processed the raw data using Structured Query Language (SQL) and Navicat Premium (version 15.0.12). SQL scripts were employed to retrieve patient data from the
Laboratory parameters included the following:
White blood cell count (WBC), neutrophil percentage (NEUT%), platelet count (PLT), hemoglobin (HGB), hematocrit (HCT), high-sensitivity CRP, blood urea nitrogen (BUN), uric acid (UA), triglycerides (TG), cholesterol (CHOL), albumin (ALB), potassium (K+), calcium (Ca2+), sodium (Na), chloride (Cl−), bicarbonate (HCO3−), amylase (AMY), lipase, total bilirubin (TBIL), direct bilirubin (DBIL), indirect bilirubin (UBIL), alanine aminotransferase (ALT), aspartate aminotransferase (AST), gamma-glutamyl transferase (y-GGT), alkaline phosphatase (ALP), lactate dehydrogenase (LDH), prothrombin time (PT), activated partial thromboplastin time (APTT), d-dimer (DDHS), PaO2/FiO2 ratio, lactate (Lac), base excess (BE), and arterial-venous CO2 tension gap (Gap). Additionally, surgical details such as pancreatic resection and drainage procedures were extracted. All the variables retrieved served as the foundation for constructing the predictive model of septic shock in acute pancreatitis patients and were used in subsequent analyses.
Data preprocessing
All data processing was conducted using R (version 4.4.1). We performed missing data analysis, as certain variables in the hosp database had significant missing values. To retain important variables, variables with >50% missingness were excluded. For the remaining variables, listwise deletion was performed to ensure complete-case inputs. Figure 1 illustrates the process of data screening. Figure 2 summarizes the variable-wise missingness rates, highlighting that some variables such as amylase_urine_idx1 and thrombin_idx1 exceeded 50% missingness and were therefore excluded. To further explore the structure of missing data, Figure 3 presents an UpSet plot showing the co-occurrence of missing values among the top five variables with the highest missing rates. This visualization confirms that most missing values occurred independently rather than in the same samples, supporting the appropriateness of the listwise deletion strategy. After preprocessing, 1032 patients and 31 variables were used for model development (Figures 1–3).
Statistical methods
For normally distributed continuous variables, data are presented as mean ± standard deviation (x ± s). Non-normally distributed continuous variables are expressed as median and interquartile range (M(Q1, Q3)), with group differences compared using the Mann-Whitney U test. Categorical variables are presented as frequency (percentage), with Chi-square tests or Fisher's exact test used for comparison. Ordinal variables are analyzed using the rank-sum test.
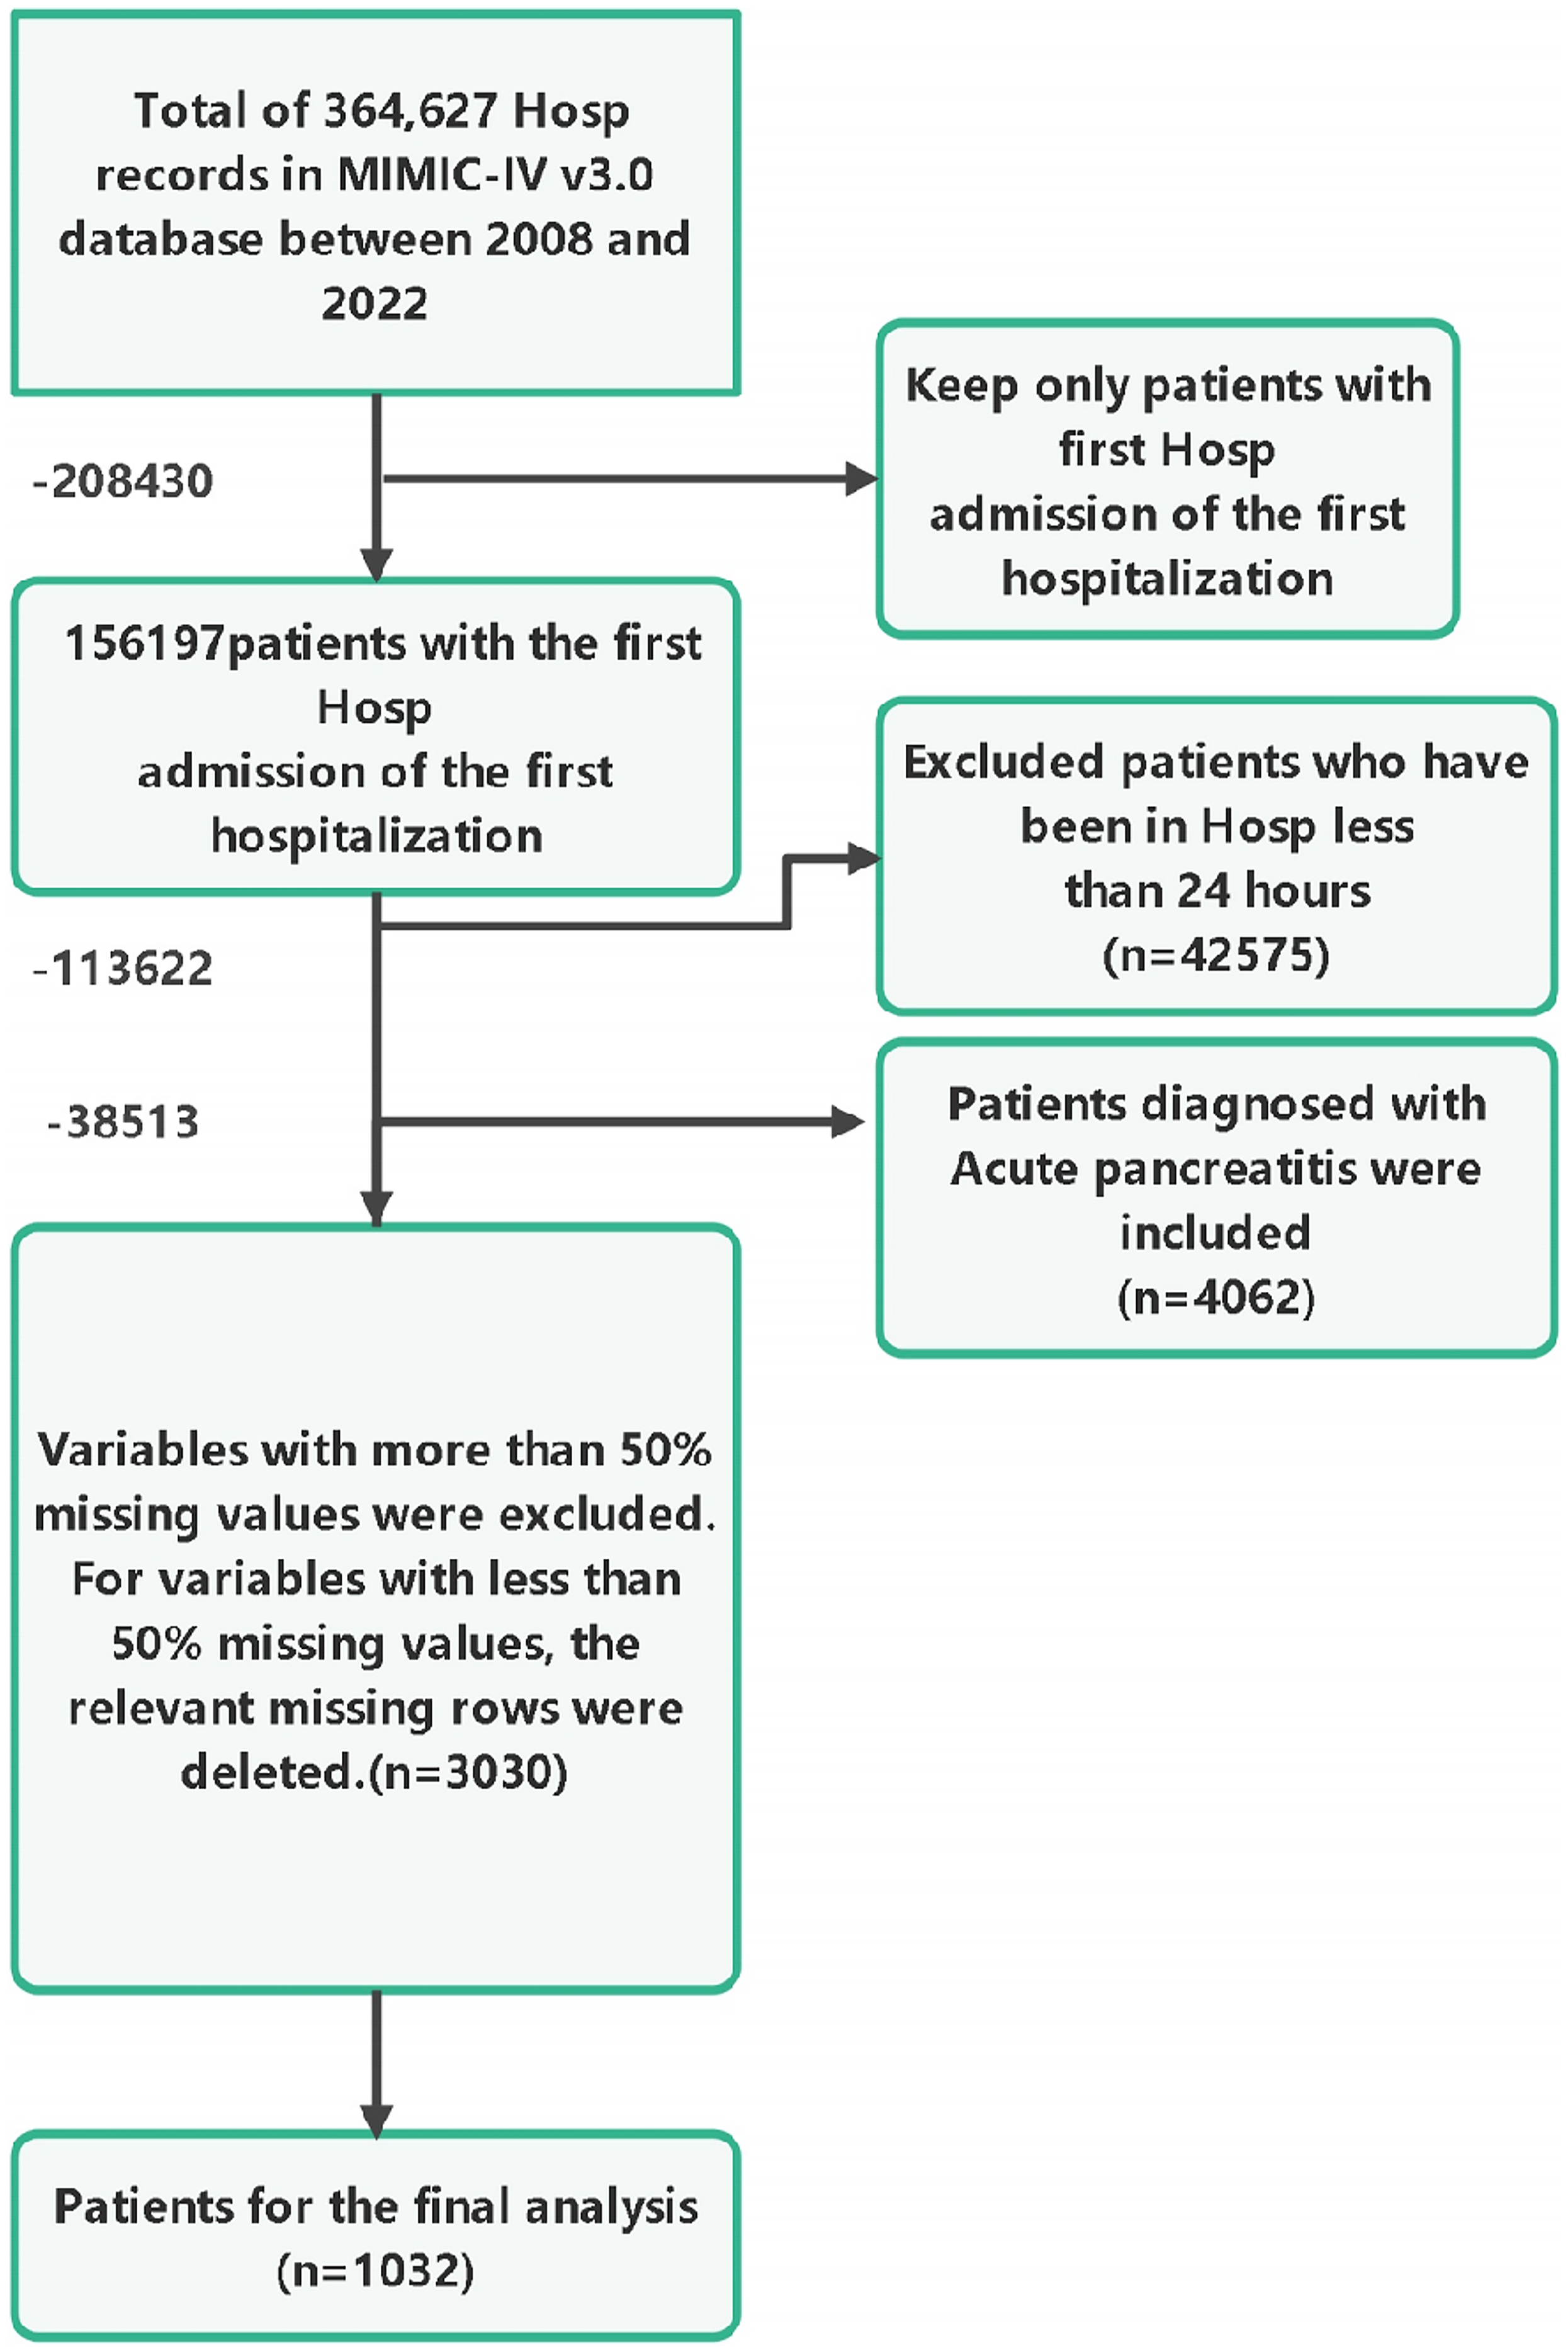
Flow chart of data screening.

Missing value percentage per variable prior to data preprocessing. Variables such as amylase_urine_idx1, thrombin_idx1, and sbp_idx1 exhibited the highest missingness (>50%) and were excluded from analysis. Clinical variables with low missingness such as potassium_idx1, sodium_idx1, and creatinine_idx1 were retained.

Upset plot depicting the co-occurrence patterns of missingness among the top five variables with the highest missing rates. Each vertical bar represents the number of observations sharing a specific pattern of missing values (shown by the connected black dots in the lower matrix). For example, the tallest bar indicates that over 4000 records were missing only sbp_idx1. This visualization confirms that missing values are not highly clustered across multiple variables or within specific patient subgroups, supporting the appropriateness of our listwise deletion strategy.
Cohort division and feature selection
The dataset was randomly split into a training cohort (70%, n = 722) and a validation cohort (30%, n = 310). To mitigate collinearity in the data analysis, Lasso regression was employed to select variables with a p-value < 0.05 from univariate analysis. 19 As the penalty term (λ) increased, the regression coefficients of the model's predictors were progressively shrunk toward zero. Ultimately, eight variables with non-zero coefficients were selected, including: white blood cell count (wbc), total bilirubin, bicarbonate, blood urea nitrogen (bun), prothrombin time (pt), lymphocyte count (lymphocytes), albumin, and severe liver disease (Figures 4 and 5).

Path plot of LASSO regression coefficients. LASSO: Least Absolute Shrinkage and Selection Operator.

LASSO regression cross-validation plot. LASSO: Least Absolute Shrinkage and Selection Operator.
Machine learning models and evaluation
Ten machine learning (ML) models were used to predict the risk of septic shock: Random Forest (RF), Logistic Regression (LR), Gradient Boosting Machine (GBM), Neural Network (NN), Extreme Gradient Boosting (XGBoost), K-Nearest Neighbors (KNN), Adaptive Boosting (AdaBoost), Light Gradient Boosting Machine (LightGBM), Category Boosting (CatBoost), and Support Vector Machine (SVM). To assess model performance, 200 random resampling iterations were conducted in both the training and test datasets. Model evaluation was performed using the area under the receiver operating characteristic curve (AUC-ROC) and decision curve analysis (DCA).
The model's efficiency and effectiveness in managing septic shock among acute pancreatitis patients were further evaluated on both the test and validation sets using metrics including Accuracy, Precision, Recall, and F1-Score.
SHAP interpretability analysis
To enhance the interpretability of our model, we employed the SHAP method. SHAP is based on the concept of Shapley values from cooperative game theory, and it uses additive models to assess the contribution of each feature to the model's predictions. This method provides a deeper understanding of model outputs, making it particularly useful for explaining complex ML models. 20 We utilized the shapviz package to calculate and visualize the SHAP values of the XGBoost model, thereby identifying the key factors associated with septic shock in acute pancreatitis patients.
In this study, we followed the SHAP guidelines (https://github.com/slundberg/shap) to interpret and visualize the XGBoost model. The SHAP histograms, SHAP bee swarm plots, and waterfall plots were generated. A higher absolute value of SHAP indicates a greater influence of the feature on the prediction outcome. As an example, we visualized the XGBoost model using SHAP histograms and SHAP waterfall plots for two patients: one who developed septic shock and one who did not.
Clinical and demographic characteristics
This study included 1032 patients who met the inclusion criteria (median age: 59 years, interquartile range (IQR): 46–72 years), with 559 males (54%). Hypertension was the most prevalent comorbidity (40%), followed by diabetes (30%). Among these patients, those who developed septic shock had significantly higher mortality rates at 7, 28, and 90 days compared to those who did not develop septic shock (Table 1).
Baseline characteristics of patients with acute pancreatitis with and without septic shock.

Note: Data are presented as number (%) for categorical variables and median (Q1, Q3) for continuous variables. Group 0 indicates patients without septic shock; group 1 indicates patients with septic shock. p-Values are derived from chi-square test for categorical variables and Wilcoxon rank-sum test for continuous variables.
Model development and validation
Using LASSO regression, we selected 8 important variables from 31 clinical features associated with the occurrence of sepsis. Based on these variables, we developed 10 ML models for prediction. After excluding overfitted models, we performed a comprehensive evaluation using ROC curves and DCA. The XGBoost model demonstrated the best performance, with an AUC of 0.83 on the test set and 0.78 on the validation set, significantly outperforming the other models. Therefore, XGBoost was selected as the final predictive model (Figures 6–9; Table 2).
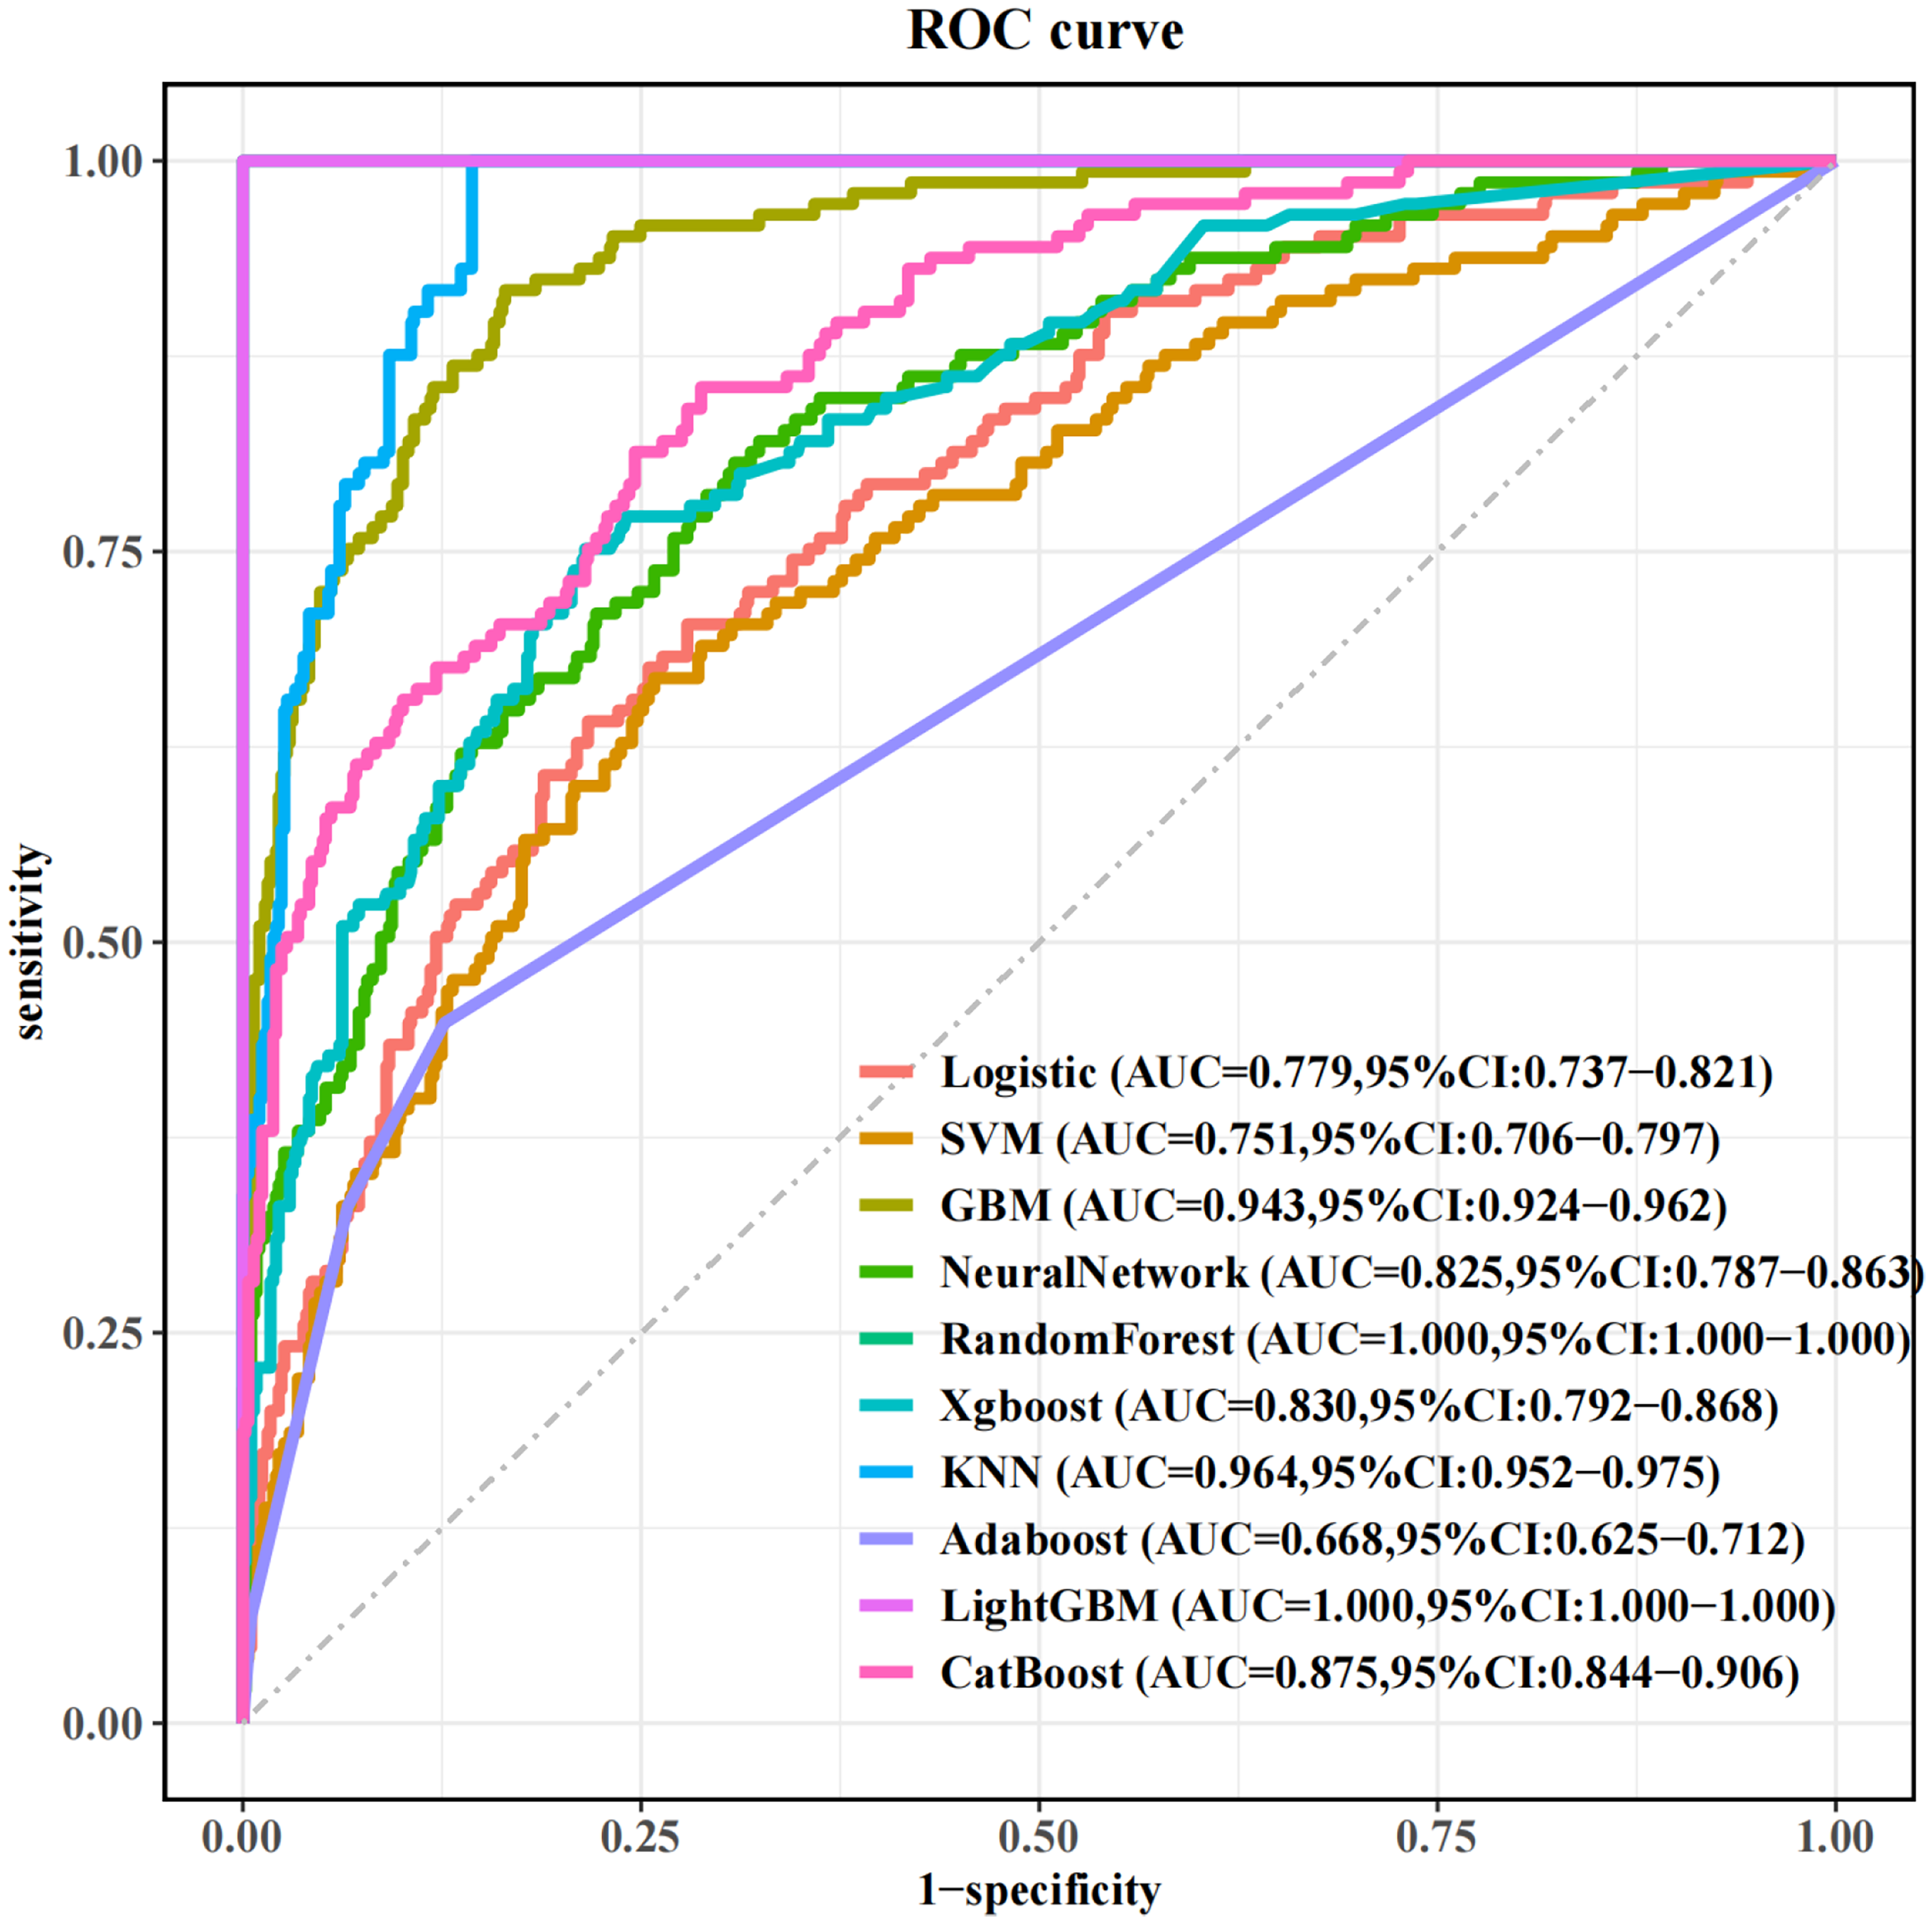
ROC curve of the training set. ROC: receiver operating characteristic.

ROC curve of the test set. ROC: receiver operating characteristic.

DCA curve of the training set. DCA: decision curve analysis.

DCA curve of the test set. DCA: decision curve analysis.
Discriminative performance (AUC ± SD) of different ML models in predicting septic shock in patients with acute pancreatitis.
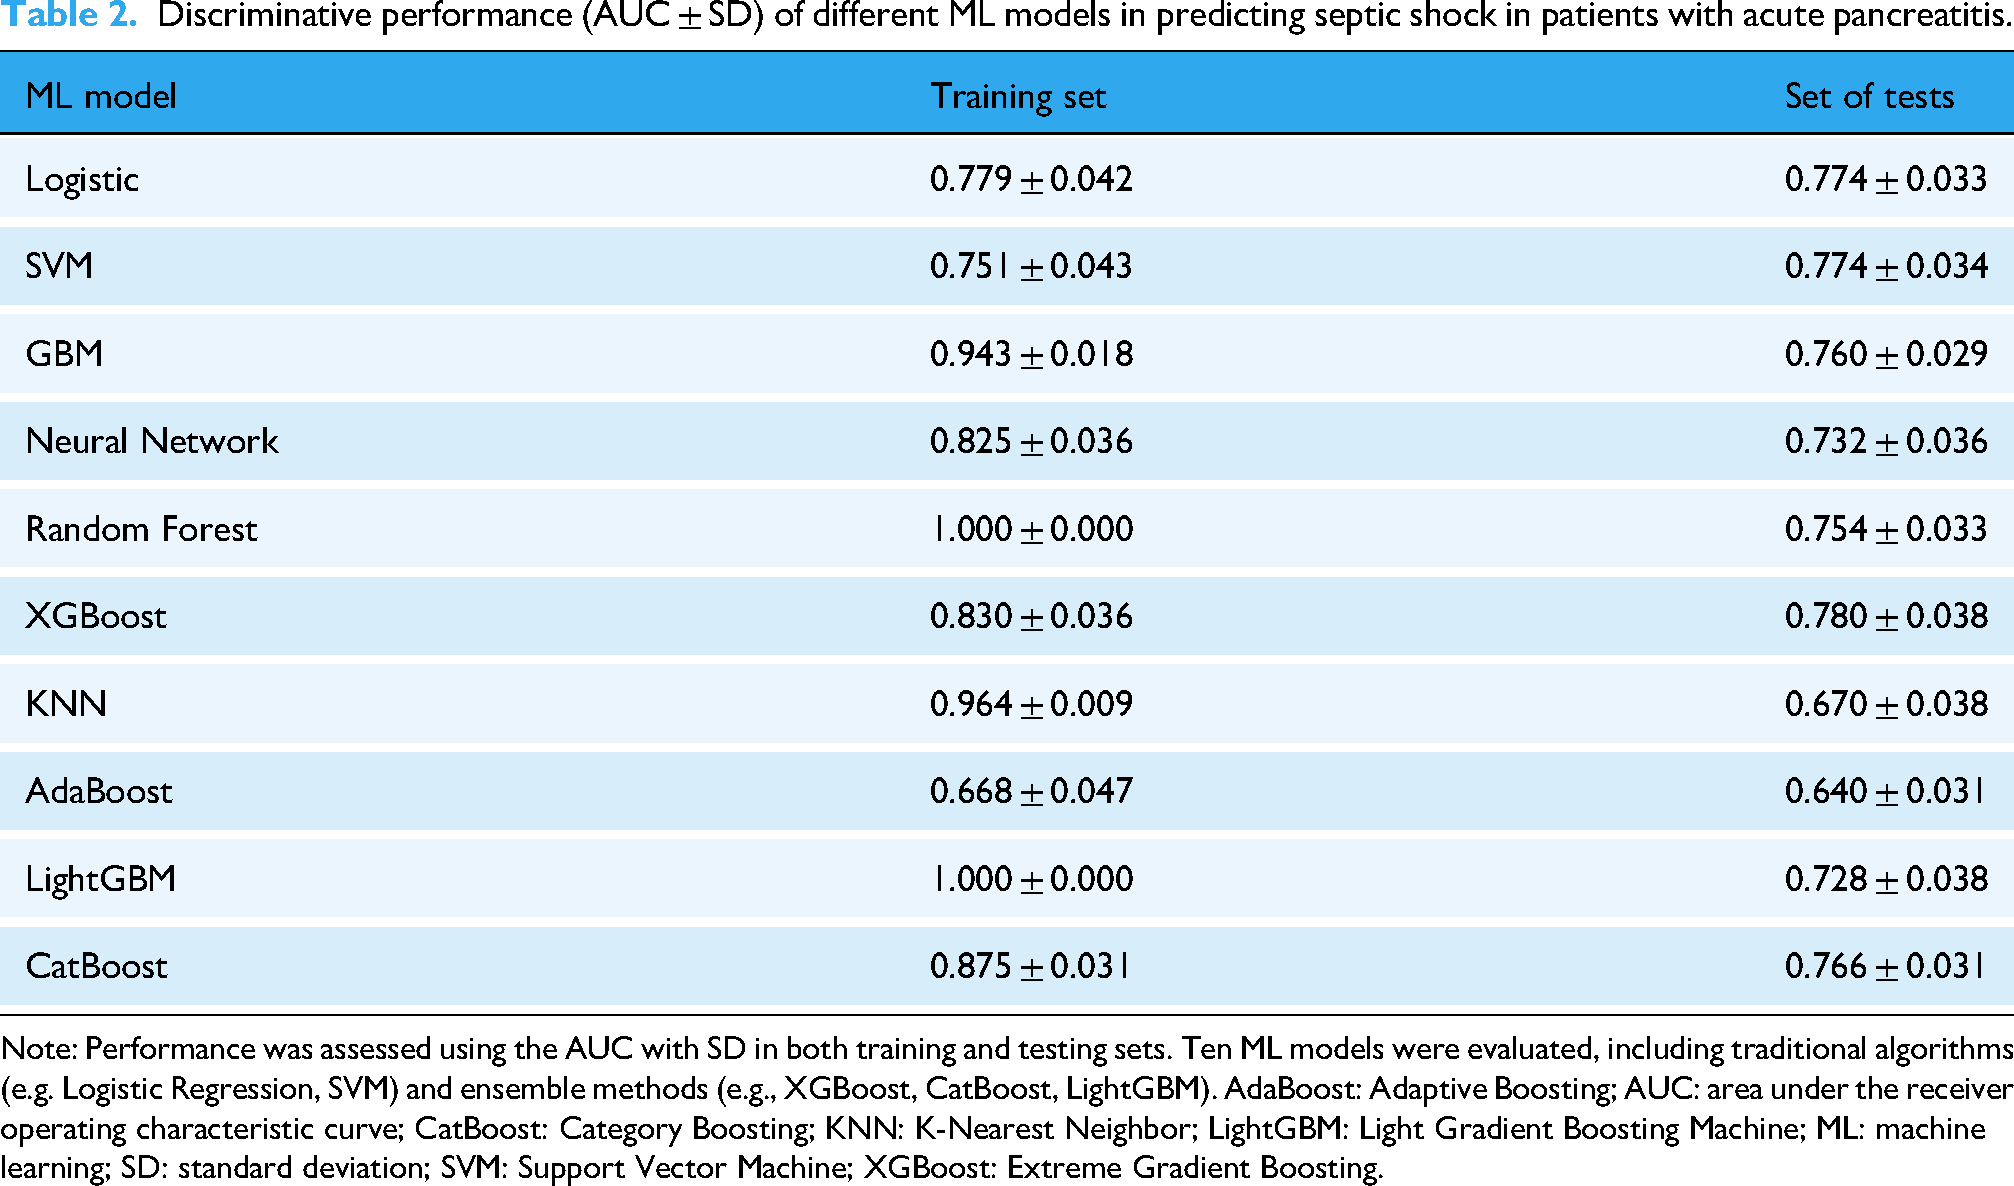
Note: Performance was assessed using the AUC with SD in both training and testing sets. Ten ML models were evaluated, including traditional algorithms (e.g. Logistic Regression, SVM) and ensemble methods (e.g., XGBoost, CatBoost, LightGBM). AdaBoost: Adaptive Boosting; AUC: area under the receiver operating characteristic curve; CatBoost: Category Boosting; KNN: K-Nearest Neighbor; LightGBM: Light Gradient Boosting Machine; ML: machine learning; SD: standard deviation; SVM: Support Vector Machine; XGBoost: Extreme Gradient Boosting.
In addition, this study employed additional performance metrics to evaluate model effectiveness, as detailed in Tables 3 and 4.
Performance metrics of machine learning models on the training set.

Note: The table reports threshold, accuracy, sensitivity, specificity, precision, and F1-score for each machine learning model trained to predict septic shock in acute pancreatitis patients. AdaBoost: Adaptive Boosting; CatBoost: Category Boosting; KNN: K-Nearest Neighbor; LightGBM: Light Gradient Boosting Machine; SVM: Support Vector Machine; XGBoost: Extreme Gradient Boosting.
Performance metrics of machine learning models on the test set.

Note: This table presents the performance of each machine learning model in predicting septic shock among patients with acute pancreatitis in the test set. Metrics include optimal threshold, accuracy, sensitivity, specificity, precision, and F1-score. XGBoost demonstrated the best overall sensitivity (0.855), supporting its utility in identifying high-risk patients. AdaBoost: Adaptive Boosting; CatBoost: Category Boosting; KNN: K-Nearest Neighbor; LightGBM: Light Gradient Boosting Machine; SVM: Support Vector Machine; XGBoost: Extreme Gradient Boosting.
SHAP analysis and model interpretability
SHAP histograms and SHAP beeswarm plots were used to visualize the contributions of multiple features in the XGBoost model for predicting septic shock. The plots revealed that WBC showed a large positive SHAP value at higher levels, indicating a substantial contribution to the model's prediction. Specifically, higher WBC values were associated with an increased risk of septic shock. Additionally, higher values of total bilirubin and bicarbonate also corresponded to stronger positive SHAP values, further supporting the model's prediction of event occurrence. Conversely, features such as BUN and PT had smaller SHAP values, suggesting their limited contribution to the model. Notably, when the values of these features were elevated, their SHAP values approached zero, indicating minimal impact on the prediction of septic shock (Figures 10 and 11).
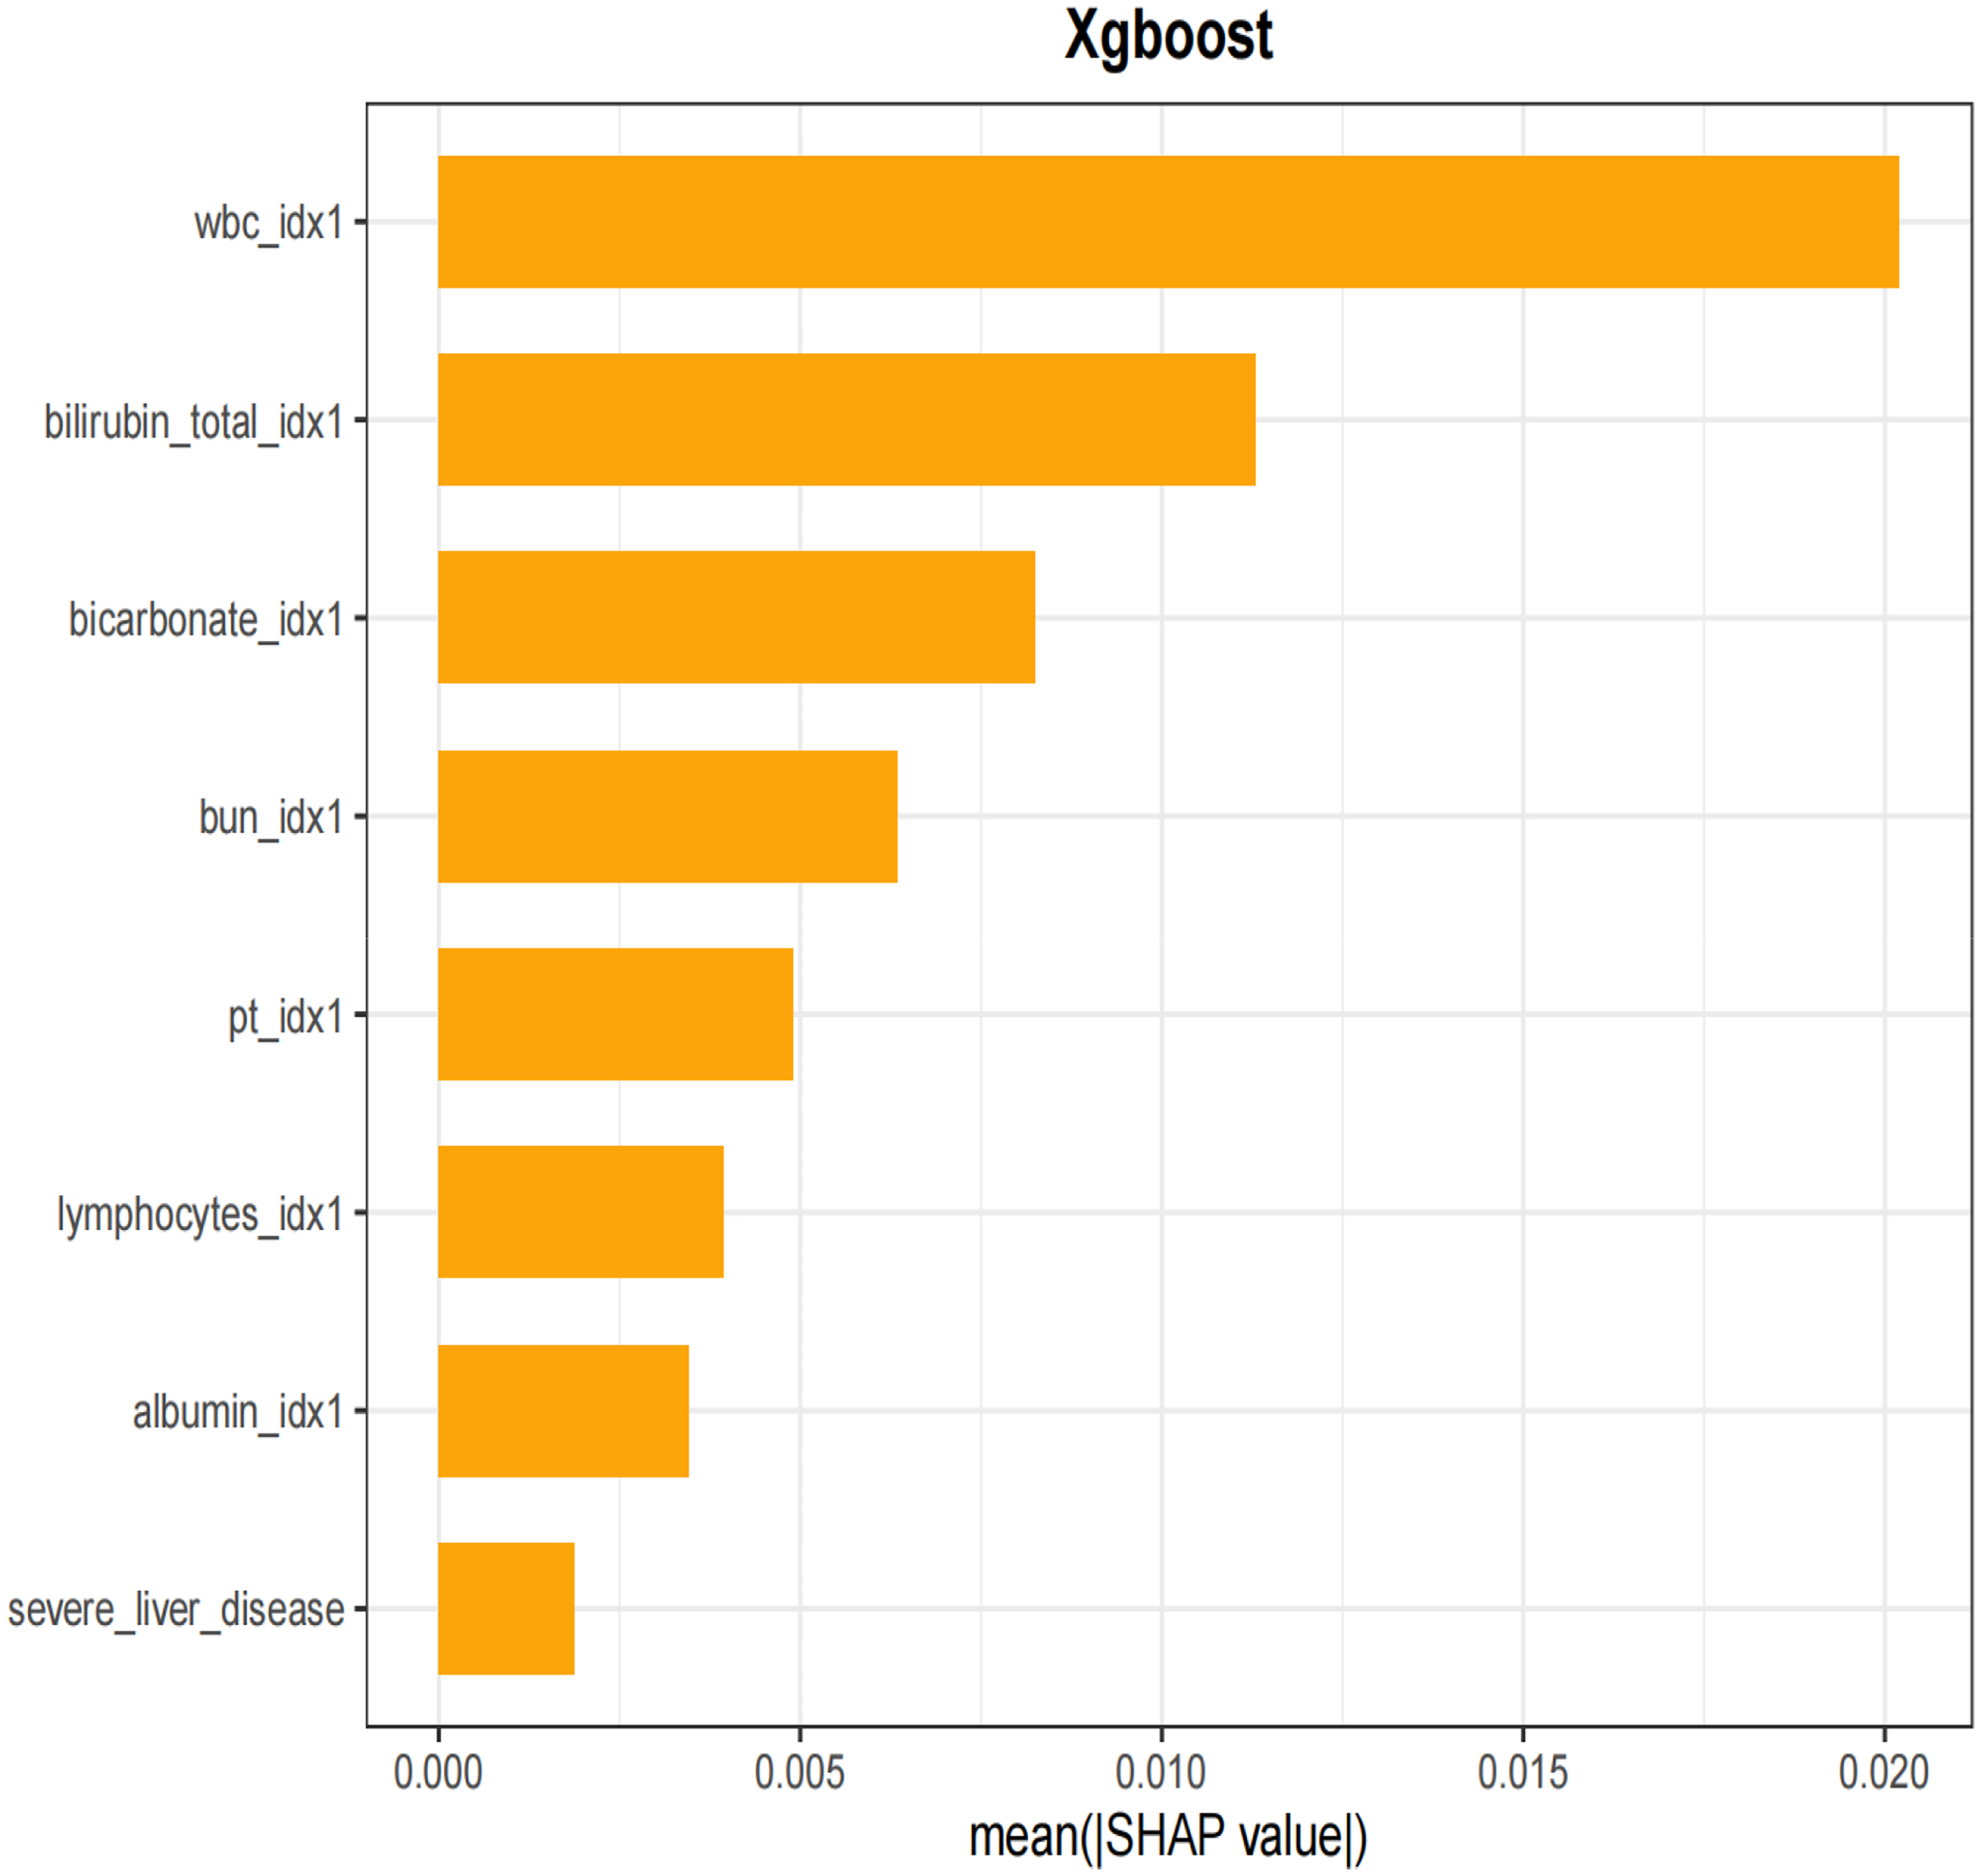
Histogram of SHAP for predicting. SHAP: Shapley Additive Explanations.

SHAP swarm plot for predicting characteristic variables of septic shock. SHAP: Shapley Additive Explanations.
We also demonstrated the interaction between different variables. The SHAP scatter plot visualized the interaction between WBC and albumin in the XGBoost model's prediction of septic shock. The plot showed that samples with low WBC and high albumin levels corresponded to SHAP values near zero, indicating that these features contributed minimally to the model's prediction, possibly reflecting a lower risk of septic shock. In contrast, when WBC was elevated and albumin levels were low, the SHAP values increased significantly, suggesting that this combination of features played a larger role in the model's prediction, highlighting the association between elevated WBC and low albumin levels with the occurrence of severe conditions such as septic shock (Figure 12).

Scatter plot characteristic variables of septic shock.
The visualization results of the SHAP histogram and SHAP beeswarm plot demonstrate the performance of the XGBoost model. For a patient who developed septic shock, the SHAP value analysis reveals that the WBC had a SHAP value of +0.537, total bilirubin (bilirubin) had a SHAP value of +0.233, BUN had a SHAP value of +0.0696, and bicarbonate (HCO3) had a SHAP value of +0.0661. Ultimately, the XGBoost model predicted a septic shock risk of 1 for this patient (Figure 13).
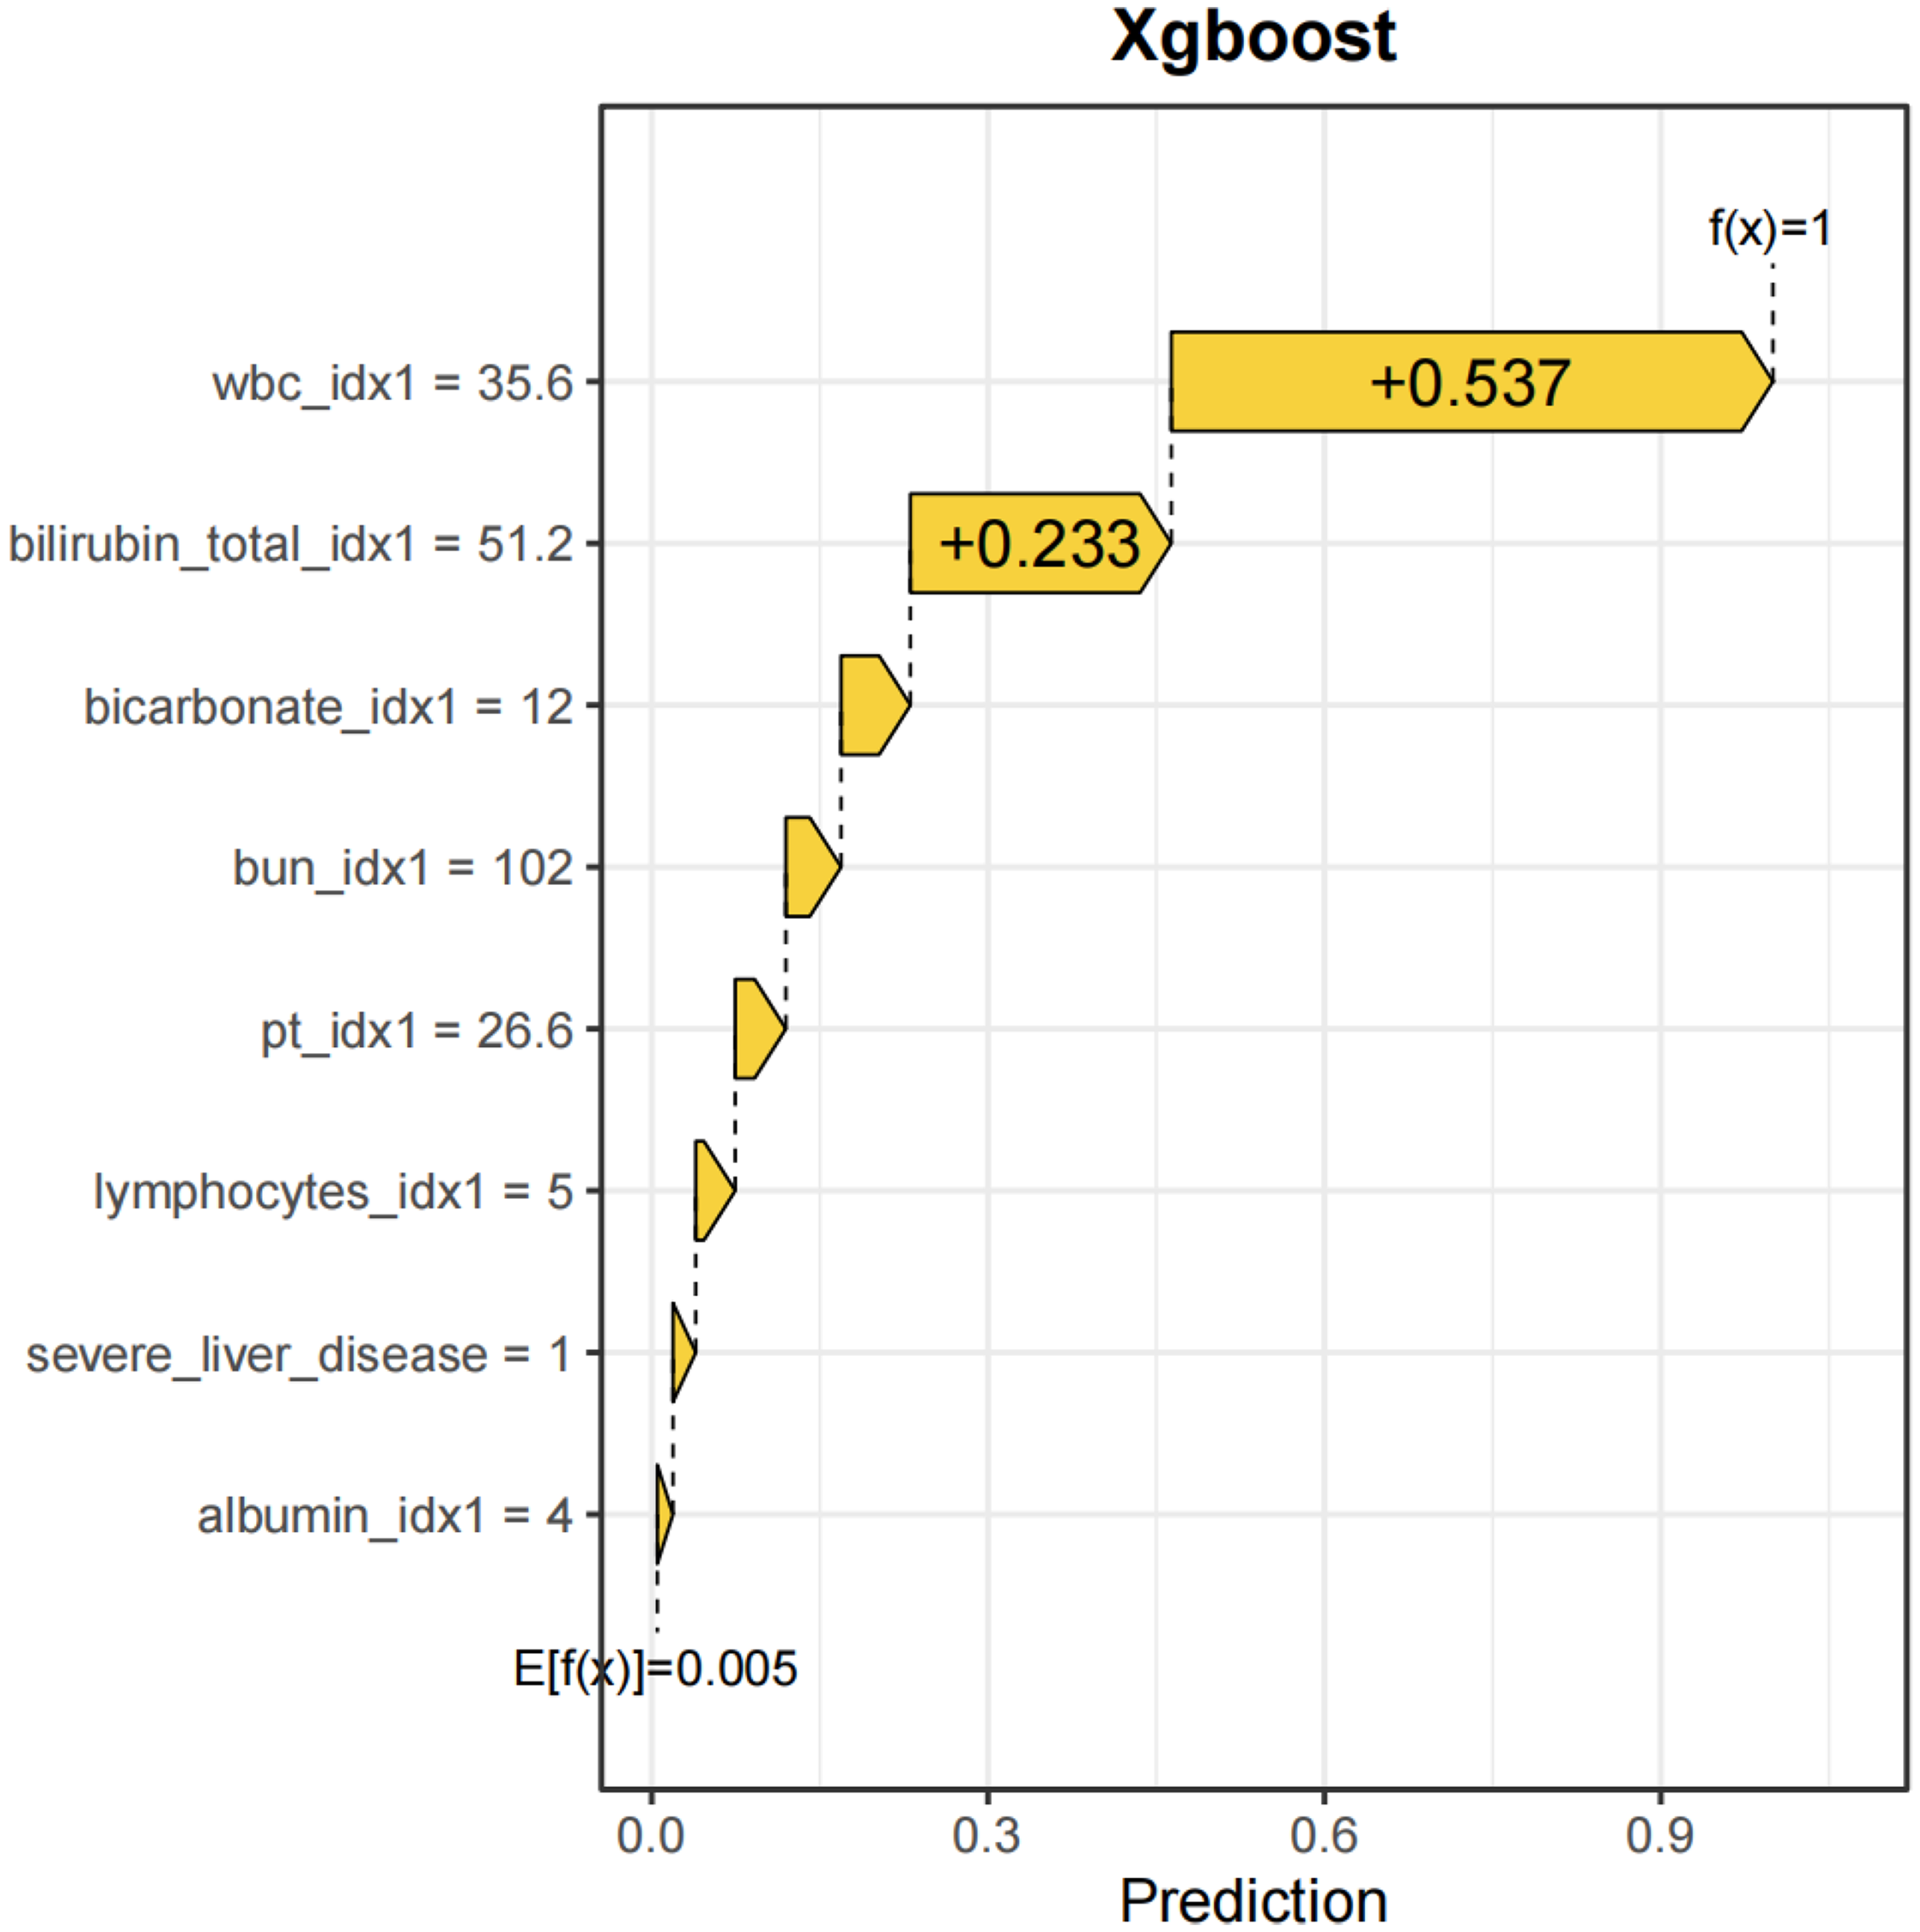
Visualization results of one XGBoost model with septic shock. XGBoost: Extreme Gradient Boosting.
In contrast, for a patient who did not experience septic shock, the SHAP value analysis indicated that the SHAP values for WBC, total bilirubin (bilirubin), and PT were all −0.00197. As a result, the XGBoost model predicted a risk f(x) close to 0, demonstrating a strong predictive tendency of the model toward the absence of the event (Figure 14).

Visualization results of one XGBoost model without septic shock. XGBoost: Extreme Gradient Boosting.
Discussion
This study extracts large-scale data from public databases and employs LASSO regression combined with 10 common ML algorithms to construct a predictive model for identifying the risk of septic shock in patients with acute pancreatitis. Additionally, the SHAP method was used to interpret and visualize the XGBoost model, further enhancing its clinical applicability. This approach aids clinicians in early identification of high-risk patients with AP, providing valuable support for subsequent medical decision making.
The findings indicate that the mortality rate in patients with AP complicated by septic shock is significantly higher than that in patients without septic shock. Early identification and intervention are thus critical for improving prognosis. Using the XGBoost model, the study identifies several key factors associated with septic shock in patients with AP, including WBC, total bilirubin (bilirubin), bicarbonate levels (bicarbonate), BUN, PT, lymphocyte count (lymphocytes), albumin (albumin), and severe liver disease (severe liver disease). SHAP histograms rank these eight features in order of their influence on the model: WBC, bilirubin, bicarbonate, BUN, PT, lymphocytes, albumin, and severe liver disease.
WBC is a critical marker of systemic inflammation. A significant increase in WBC suggests the presence of severe infection and systemic inflammatory response syndrome (SIRS), which are crucial risk factors for sepsis and septic shock. 21 An elevated WBC count exacerbates the inflammatory response in the pancreas and surrounding tissues, damaging pancreatic microcirculation and ultimately leading to septic shock. 22 SHAP values demonstrate that WBC is the most influential feature in predicting the risk of septic shock in AP.
An increase in total bilirubin is often associated with liver dysfunction or microcirculatory disturbances, both of which can worsen the course of septic shock. SHAP analysis positions bilirubin as the second most important factor influencing the progression of acute pancreatitis. 23 The contribution of severe liver disease in the SHAP analysis further corroborates this finding.
Reduced bicarbonate levels are a hallmark of metabolic acidosis, commonly observed in patients with septic shock. Metabolic acidosis impairs cellular metabolism and may exacerbate endothelial injury and oxygen delivery issues, thereby accelerating disease progression.24,25 The SHAP analysis confirms a strong positive correlation between low bicarbonate levels and the high risk of septic shock in patients with AP. 26
Elevated BUN reflects renal impairment or inadequate renal perfusion in patients with AP. 27 In the context of septic shock, microcirculatory dysfunction reduces glomerular filtration rate, leading to further accumulation of BUN and an increased risk of septic shock. 28 Prolonged PT is indicative of coagulation dysfunction, often seen in sepsis and septic shock, reflecting systemic inflammation, microthrombus formation, and endothelial damage. SHAP value analysis underscores the importance of both BUN and PT in predicting septic shock risk. 29 A reduction in lymphocyte count is indicative of sepsis-related immunosuppression. Lower lymphocyte levels are associated with impaired pathogen clearance, increasing the likelihood of infection spread and the risk of septic shock. 30 Similarly, albumin levels, linked to nutritional status and inflammatory burden, are inversely related to the development of septic shock. Low albumin levels worsen microcirculatory dysfunction and tissue hypoxia, potentially promoting the onset of septic shock.31,32
Machine learning model performance
ML models offer significant advantages in identifying complex patterns within clinical data, improving prediction accuracy and practical utility. 33 In this study, the performance of various models was compared using ROC and DCA curves, leading to the selection of the XGBoost model for further analysis. 34 The XGBoost model excels in several areas: (1) capturing high-order interactions between features and handling complex data relationships; (2) addressing discontinuous data and nonlinearity issues; and (3) reducing the impact of outliers through iterative weighting and optimization of the objective function. Previous studies have attempted to apply ML methods to predict complications associated with AP; however, most have not specifically targeted septic shock, and often lacked model interpretability. Liu et al. 35 developed an early prediction model for sepsis in ICU patients with AP using the MIMIC database, achieving an AUC of 0.985 in the test set. Nevertheless, their model did not distinguish patients at risk of septic shock and did not incorporate explainability techniques. Xia et al. 36 used a multicenter dataset of 604 patients from three hospitals in China to develop a model predicting 28-day septic shock, with the auto-encoder (AE) model reaching an AUC of 0.879—outperforming conventional scoring systems. However, the limited sample size and lack of explainable tools such as SHAP rendered the model a “black box,” restricting its clinical utility.
In contrast, our study is the first to construct an interpretable ML model for septic shock in patients with AP using the emergency department data from the publicly available MIMIC-IV v3.0 database, ensuring high reproducibility and global applicability. We applied LASSO regression for feature selection and incorporated SHAP values to interpret the XGBoost model, thereby enhancing interpretability. SHAP summary plots revealed that eight key variables exhibited a “bipolar separation” pattern in SHAP values, indicating their strong influence on the predicted risk of septic shock.
In terms of predictive performance, the XGBoost model achieved an AUC of 0.780 in the validation cohort. To further visualize model predictions, we selected one patient who developed septic shock and one who did not. The XGBoost model estimated a risk probability close to 1 for the former and approximately 0 for the latter, providing an intuitive understanding of how the model distinguishes high-risk cases. These findings suggest that the SHAP-informed XGBoost model offers both strong predictive performance and enhanced interpretability in the early identification of septic shock risk among patients with AP.
Conclusion
This study demonstrates that ML models, particularly the SHAP-based interpretable XGBoost model, hold significant potential in predicting the risk of septic shock in patients with AP. By incorporating clinical variables such as WBC, total bilirubin, and bicarbonate levels, the model offers a reliable and transparent method to assist emergency physicians in early risk stratification. The use of SHAP enhances the model's interpretability, providing insights into the contribution of each variable to the model's predictions. This approach offers a step forward in clinical decision support, aiding timely interventions and optimizing resource allocation in the management of AP-related septic shock. Future external validation across multiple centers will be essential to further assess the model's generalizability and clinical utility.
Limitations
Several limitations must be acknowledged in this study. First, the data used were derived from a single-center source, the MIMIC-IV database, which may limit the generalizability of the findings. Future research should aim to validate the model in multiple centers with diverse patient populations. Second, due to the high rate of missing data in the MIMIC-IV database, certain important clinical variables, such as pH levels and lactate, could not be included in the analysis. The exclusion of these variables may impact the model's predictive accuracy. Lastly, while our study utilized a wide range of clinical parameters, additional factors such as imaging data, environmental factors, and lifestyle habits could further enhance the model's predictive power. These limitations should be addressed in future studies to improve the robustness of the model.
Ethics statement
The MIMIC-IV database is a publicly available dataset comprising de-identified patient information; therefore, no additional ethical approval is required for its use. Data extraction for this study was approved by the Institutional Review Board (IRB) of the Massachusetts Institute of Technology (MIT) (Certification No: 65828043,Named:Zhihao Li).
Footnotes
Acknowledgement
The authors would like to express their sincere gratitude to the editorial team and anonymous reviewers for their valuable feedback and insightful comments, which significantly improved the quality of this manuscript.
Author contributions
BS designed the study, performed the data analysis, and led the writing and revision of the manuscript. PL, KF, and CL contributed to data collection and processing, providing key technical support for the methodology. CL also provided overall guidance for the research, ensuring the scientific rigor and validity of the methods and conclusions.
Funding
The authors received no financial support for the research, authorship, and/or publication of this article.
Declaration of conflicting interests
The authors declared no potential conflicts of interest with respect to the research, authorship, and/or publication of this article.
Data availability statement
The datasets used and/or analyzed during the current study available from the corresponding author on reasonable request.