
Abstract
Aim
To develop an advanced determination technology for detecting COVID-19 patterns from chest X-ray and CT-scan films with distinct applications of deep learning and machine learning methods.
Methods and Materials
The newly enhanced proposed hybrid classification network (SVM-RLF-DNN) comprises of three phases: feature extraction, selection and classification. The in-depth features are extracted from a series of 3×3 convolution, 2×2 max polling operations followed by a flattened and fully connected layer of the deep neural network (DNN). ReLU activation function and Adam optimizer are used in the model. The ReliefF is an improved feature selection algorithm of Relief that uses Manhattan distance instead of Euclidean distance. Based on the significance of the feature, the ReliefF assigns weight to each extracted feature received from a fully connected layer. The weight to each feature is the average of k closest hits and misses in each class for a neighbouring instance pair in multiclass problems. The ReliefF eliminates lower-weight features by setting the node value to zero. The higher weights of the features are kept to obtain the feature selection. At the last layer of the neural network, the multiclass Support Vector Machine (SVM) is used to classify the patterns of COVID-19, viral pneumonia and healthy cases. The three classes with three binary SVM classifiers use linear kernel function for each binary SVM following a one-versus-all approach. The hinge loss function and L2-norm regularization are selected for more stable results. The proposed method is assessed on publicly available chest X-ray and CT-scan image databases from Kaggle and GitHub. The performance of the proposed classification model has comparable training, validation, and test accuracy, as well as sensitivity, specificity, and confusion matrix for quantitative evaluation on five-fold cross-validation.
Results
Our proposed network has achieved test accuracy of 98.48% and 95.34% on 2-class X-rays and CT. More importantly, the proposed model's test accuracy, sensitivity, and specificity are 87.9%, 86.32%, and 90.25% for 3-class classification (COVID-19, Pneumonia, Normal) on chest X-rays. The proposed model provides the test accuracy, sensitivity, and specificity of 95.34%, 94.12%, and 96.15% for 2-class classification (COVID-19, Non-COVID) on chest CT.
Conclusion
Our proposed classification network experimental results indicate competitiveness with existing neural networks. The proposed neural network assists clinicians in determining and surveilling the disease.
Introduction
In December 2019, the novel coronavirus disease (COVID-19) spread from Wuhan City, Hubei Province, in the People's Republic of China. COVID-19 is the descendant of the SARS Corona Virus (SARS-CoV) virus. The new viral disease is Severe Acute Respiratory Syndrome Corona Virus-2 (SARS-CoV-2). This new viral disease continues to have a traumatic and disastrous effect on the health and livelihood of the global population and the global economy. Once attacked with a novel coronavirus disease, patients may have respiratory infections with symptoms such as cough, fever, and shortness of breath. It shows a genetic mutation in the spike protein that will cause an accessible and immediately transmissible faster virus in humans. Besides this, the original strain is of little or no danger to children, and the new virus mutant can potentially adversely affect children. In the acute state, the coronavirus disease exhibits the characterization of Pneumonia, which leads to suffocation and breathlessness, to the extreme level of multi-organ failure and death.
After the outbreak of the disease with its new variant, there has been an exponential increase in cases that have been alarming for human health. So, the foremost and significant staircase in obstructing COVID-19 is to implement constructive and functional identification of infected patients so that the COVID-19 positive can be isolated from the community. RT-PCR test kits, considered gold standards, are used to identify the novel coronavirus disease. Radiology images like chest X-rays and CT scans promise to provide accurate, fast, and cheap screening and testing of COVID-19. As there is an exponentially increased number of occurrences in COVID variants and the need for exact diagnosis of COVID variants in order to control the COVID variant occurrences, it inspires us to introduce a profound learning-based testing manner for the appropriate determination of COVID-19 cases with minimum false positives and false negatives. The deep learning-based testing manners are equivalent and more available, potentially faster and cheaper, but are as accurate as RT-PCR. The chest X-rays and CT scans radiology images can be categorized between COVID-19 and non-COVID patients. Classifying diseases manually from many patients’ chest X-rays and CT images creates a massive workload for radiologists. Also, it may require expert clinicians who are limited in some areas. The imaging-based automated Computer Assisted Diagnosis (CAD) system using DNN models has increased the accuracy of COVID-19 disease prediction.
Recent studies1–3 show deep neural networks are very effective in detecting lung diseases and lesions from chest radiology images. Serena Low et al. 4 discussed various neural networks for detecting viral Pneumonia and COVID-19 from chest X-ray images. K. U. Ahamed et al. 5 developed modified ResNet50V2 for classifying various Pneumonia and COVID-19 from chest X-ray and CT. S. H. Kassania et al. 6 applied DenseNet121 and Bagging tree classifier for detecting COVID-19 from chest X-ray and CT images. MMA. Prodhan et al. 7 developed a model combination of Xception, VGG16, and LSTM to detect childhood pneumonia from chest X-rays. E. Hussain et al. 8 proposed an efficient CNN 9 for classifying viral Pneumonia, COVID-19, and bacterial Pneumonia from chest X-rays.
Limitations of a large number of labelled medical images, various types of imaging modalities, various hyper-parameters and various training procedures create challenges to developing an improved DNN model for classifying COVID-19, Pneumonia, and healthy cases. The researchers developed many DNN models. Some models perform efficiently; however, others need more accuracy. Considering the challenges and all other conditions, there is a scope for developing a new DNN model for better COVID-19 diagnosis.
In this work, we have proposed a unique hybrid neural network that extracts in-depth features by DNN, selects the most efficient features by Relief-F algorithm, and classifies those features by the Support Vector Machine (SVM) classifier for detecting COVID-19, Pneumonia, and healthy cases from chest X-ray and CT images. The contributions to this work are as follows. (1) Development of an efficient deep CNN for feature extraction through a series of 3×3 convolution, 2×2 max polling operations followed by flattened and fully connected layer, (2) inclusion of ReliefF to select essential features effectively and eliminate unimportant features from fully connected layers, (3) employment of SVM to classify diseases efficiently based on features selected from ReliefF and (4) utilization of best hyper-parameters for DNN, ReliefF and SVM. The performance of the proposed model is comparable to the state-of-the-art.
The dataset involved in the classification model is chest CT scans and chest X-rays containing Pneumonia, as well as normal and COVID-19 radio images available in the public domain and pre-defined in the classification model. The data augmentation technique is used. The performance metrics for the classification model involved are training, validation, test accuracy, sensitivity, specificity, and confusion matrix for quantitative evaluation of the proposed classification neural network. The model has been trained and tested on publicly available image databases like Kaggle and GitHub. Creating trained models from a particular dataset provides acceptable results for monitoring disease propagation.
The framework of the proposed research study will be described in the following sections. The literature review (Section 2) summarises the statistical analysis reports of the relevant and comparable research studies. The methods (Section 3) describe the proposed deep neural network architecture for identifying COVID-19 viral infection patterns. The materials (Section 4) summarise resources and data distribution used in the proposed research study. The results and discussion (Section 5 and 6) portray the experimental analysis and outcomes of the proposed research work and a comparison with previous research studies. Finally, the research paper is concluded in the Conclusion (Section 7).
Literature review
In the COVID-19 situation, there is a necessity for rapid interpretation of radiological images; many scientists have represented deep learning models, especially the convolution neural network, for detection and segmentation of the infected COVID-19 cases. There is an acceptable performance result in their respective neural models. We have analyzed those relevant research papers and found an appropriate research scope, as shown in Table 1.
Summary of state-of-the-art works.

R. Mostafiz et al. 23 applied a combination of CNN, discrete wavelet transform (DWT) and random forest for detecting COVID-19 from chest X-ray. AM. Ayalew et al. 24 developed a hybrid of CNN and histogram of oriented gradients (HOG) for identifying COVID-19 from chest X-rays. H. Nasiri et al. 25 combined DenseNet169 and Extreme Gradient Boosting (XGBoost) for detecting COVID-19 from chest X-ray. N. Indumathi et al. 26 discussed that a deep learning-based approach is better than the C5.0 decision tree for COVID-19 detection. AO. Salau et al. 27 extracted features using discrete wavelet transform (DWT) and classification using SVM to detect Covid-19. A. Narin et al. 28 applied four variants of pre-trained ResNet and observed that ResNet50 outperformed for detecting COVID-19, normal, viral pneumonia and bacterial pneumonia from chest X-ray. AM. Ayalew et al. 29 proposed a model using CNN and SVM classifiers for detecting COVID-19 and normal chest X-rays. VK. Prasad et al. 30 developed a method that detects COVID-19 from chest CT images using deep learning and cloud-based image analysis for priority-wise distribution of COVID-19 vaccination. P. Misra et al. 31 applied pre-trained DenseNet121, ResNet18, and VGG16 for a parallel ensemble bagging-based model to detect COVID-19 from chest X-rays. R. Kumar et al. 32 proposed a model that optimally reduces features extracted from GoogLeNet and ResNet152 using the Pearson correlation coefficient and uses an XGBoost classifier for detecting COVID-19, pneumonia, and normal from chest X-ray. FG. Deriba et al. 33 proposed a decision support system, and ANN outperformed SVM and Naïve Bayes for predicting COVID-19 from patient data. BZ. Wubineh et al. 34 applied a PART rule-based algorithm for detecting COVID-19 from patient symptoms data. SA. Frimpong et al. 35 proposed an IoT-enabled system with intelligent programming and sensors to detect body irregular temperatures and abnormal heartbeats for detecting COVID-19. AG. Yadessa et al. 36 proposed an Arduino microcontroller and ultrasonic distance sensors for touch-free hand washing to prevent the spread of COVID-19 infections. T. Natnael et al. 37 analyzed the use of different face masks among taxi drivers by multivariable logistic regression to prevent the spread of COVID-19 infections.
The recent literature shows adequate scope to develop a new and effective model to attain improved performance than state-of-the-art on automatic detection of COVID-19 from chest X-rays and CT images.
Methods
Proposed model for classification task
In this research, a COVID-19 classification neural network is designed to automatically detect and classify COVID-19 among multiple classes on CT scans and X-ray radiological images, such as COVID-19, pneumonia, and normal. The model comprises of three phases: feature extraction, selection, and classification, as shown in Figure 1.
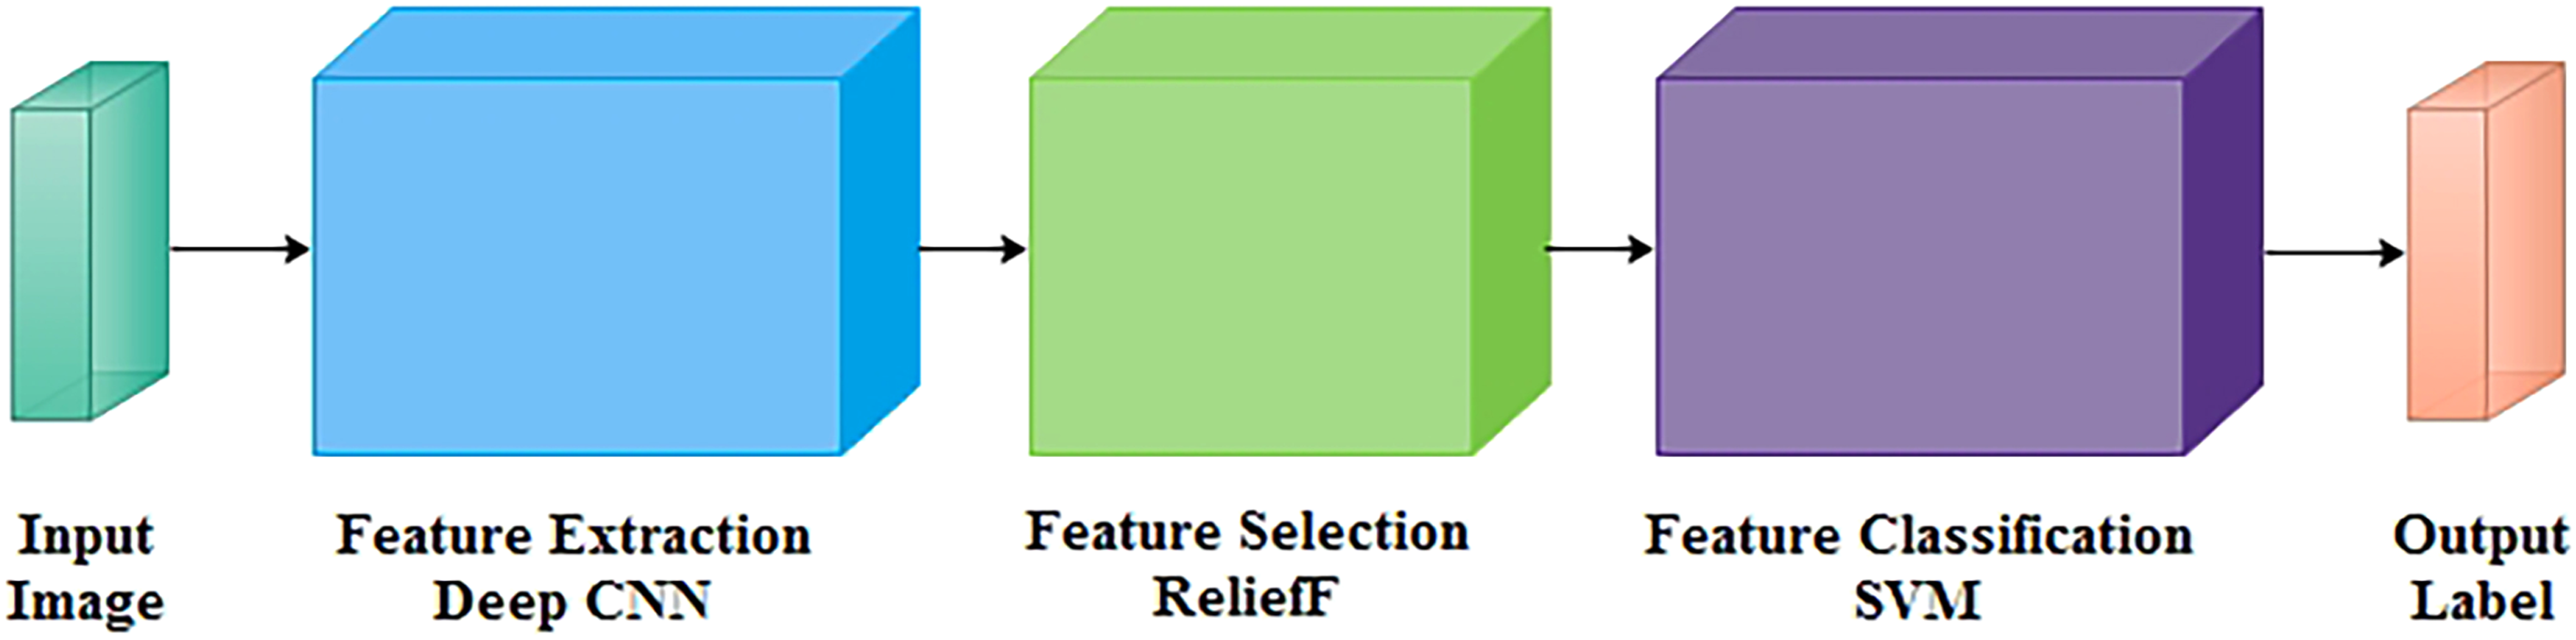
Block diagram of proposed network.
Proposed feature extraction using deep CNN
In the feature extraction stage, the in-depth features are extracted from the proposed neural network's convolution, pooling, and fully connected layers, as shown in Figure 2. The original image size of the neural classifier is 150×150 pixels, which is larger than the highest pixels in the convolution layer. At most, 148×148 pixels are accommodated in the neural network's input layer. Each neural layer in the feature extraction stage takes the input of the previous neural layer, and the next neural layer receives its outcome as input. The given neural classifier has an alternate combination of four convolution layers followed by four max-pooling layers. Therefore, convolution layers extracted features from a large receptive field. Each filter convolves to a specific region of the input area called the receptive field in a convolution layer. In this manner, the resolution of neural feature maps is maintained in the network. The neural diagram's brown pointer will halve the image size from 148×148 to 74×74 from the initial max-pooling layer to the next convolution layer. This will retain the essential feature maps which best describe the context/feature of the image. The max-pooling process also reduces memory and computational complexity in each neural layer. For the stated architecture, it is to train to learn intricate patterns successfully. The number of feature maps will be doubled after each convolution layer, labelled by the yellow pointer in the diagram. The feature maps (no. of filters) vary from 32 in the initial convolution layer to 128 in the last convolution layer to increase the depth of the image. ReLU is selected as the activation function to accelerate the converging ability rather than tanh and sigmoid. Adam optimizer is used for adaptive learning capability rather than sgdm. AO. Salau et al. 38 reviewed state-of-the-art feature extraction methods in computer vision, which can be used in many applications and observed that extracted GLDS features of an image are unique.
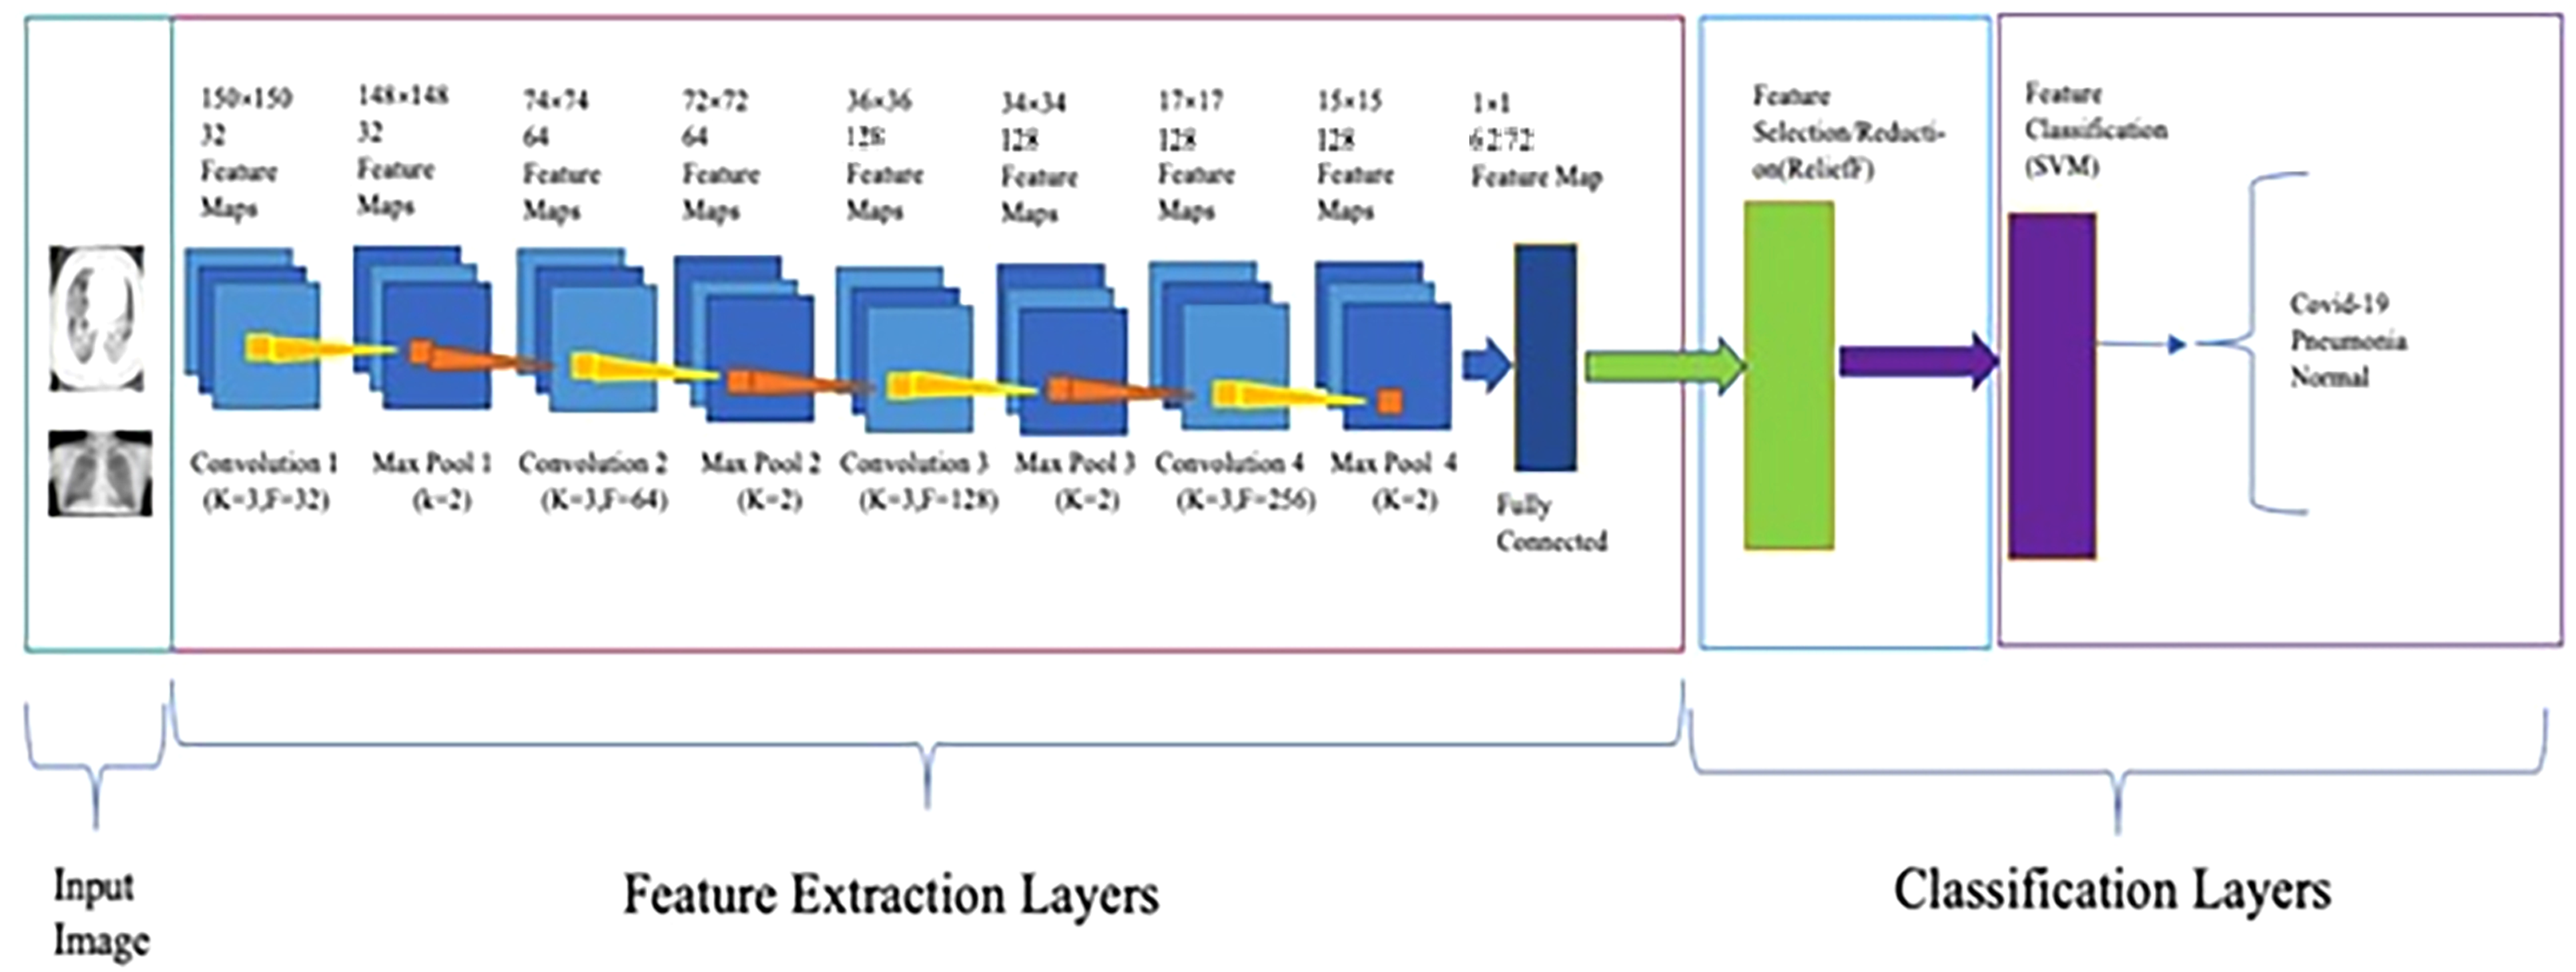
Architecture of proposed network.
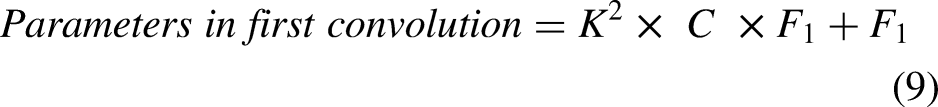
The output image sizes of convolution and maxpooling layers are calculated using Equations (1), (2), (3), and (4). The number of neurons in convolution and fully connected layers are computed using Equations (5) and (6). The weights, bias, and parameters of convolution and fully connected layers are calculated using Equations (7), (8), (9), (10), (11), (12), and (13).


Equation (14) defines the ReLU activation function.
Summary of proposed architecture.

Proposed feature selection using reliefF
The feature selection stage of the given model selects the efficient features from extracted deep feature maps using the feature selection/reduction ReliefF algorithm.39–43 The feature selection algorithm selects the highest-ranking features, estimated by statistical method. The feature selection algorithm makes a feature vector and selects the most efficient features with the least prior information before the feature classification of proposed diseases.
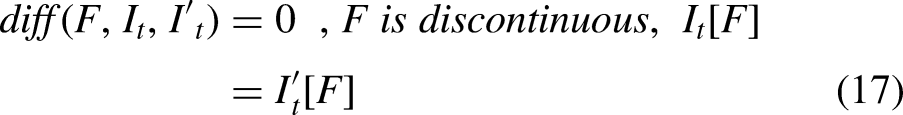
The ReliefF is an improved algorithm of Relief that uses Manhattan distance instead of Euclidean distance. The ReliefF assigns weight to each extracted in-depth feature received from a fully connected layer based on the importance of the feature, as shown in Figures 2 and 3. The weight to each feature is the average of k closest hits (weight falls) and k closest misses (weight raises) in each class for a neighbouring instance pair in multi-class problems. The ReliefF eliminates features with lower weights. The higher weights of the features can perform better feature classification. Features with low significance are reduced by setting the node value to zero, and features of high importance are kept to obtain the feature selection. Therefore, a considerable amount of discriminate features are picked by the ReliefF algorithm. The ReliefF algorithm aids in resolving a variety of problem types by choosing the nearest neighbouring instances from distinct categories for each instance. The ReliefF algorithm updates the weight of the feature with the probability of each class using Equations (15), (16), (17), and (18) and Equation (15) is further derived in Equation (19) for multi-class problems.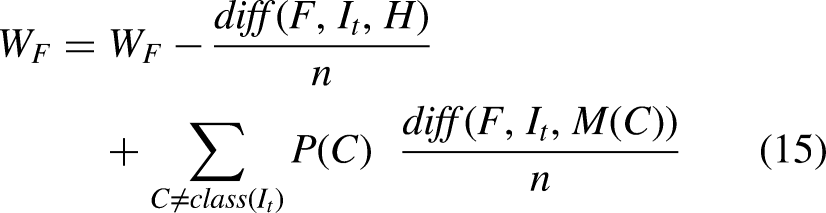


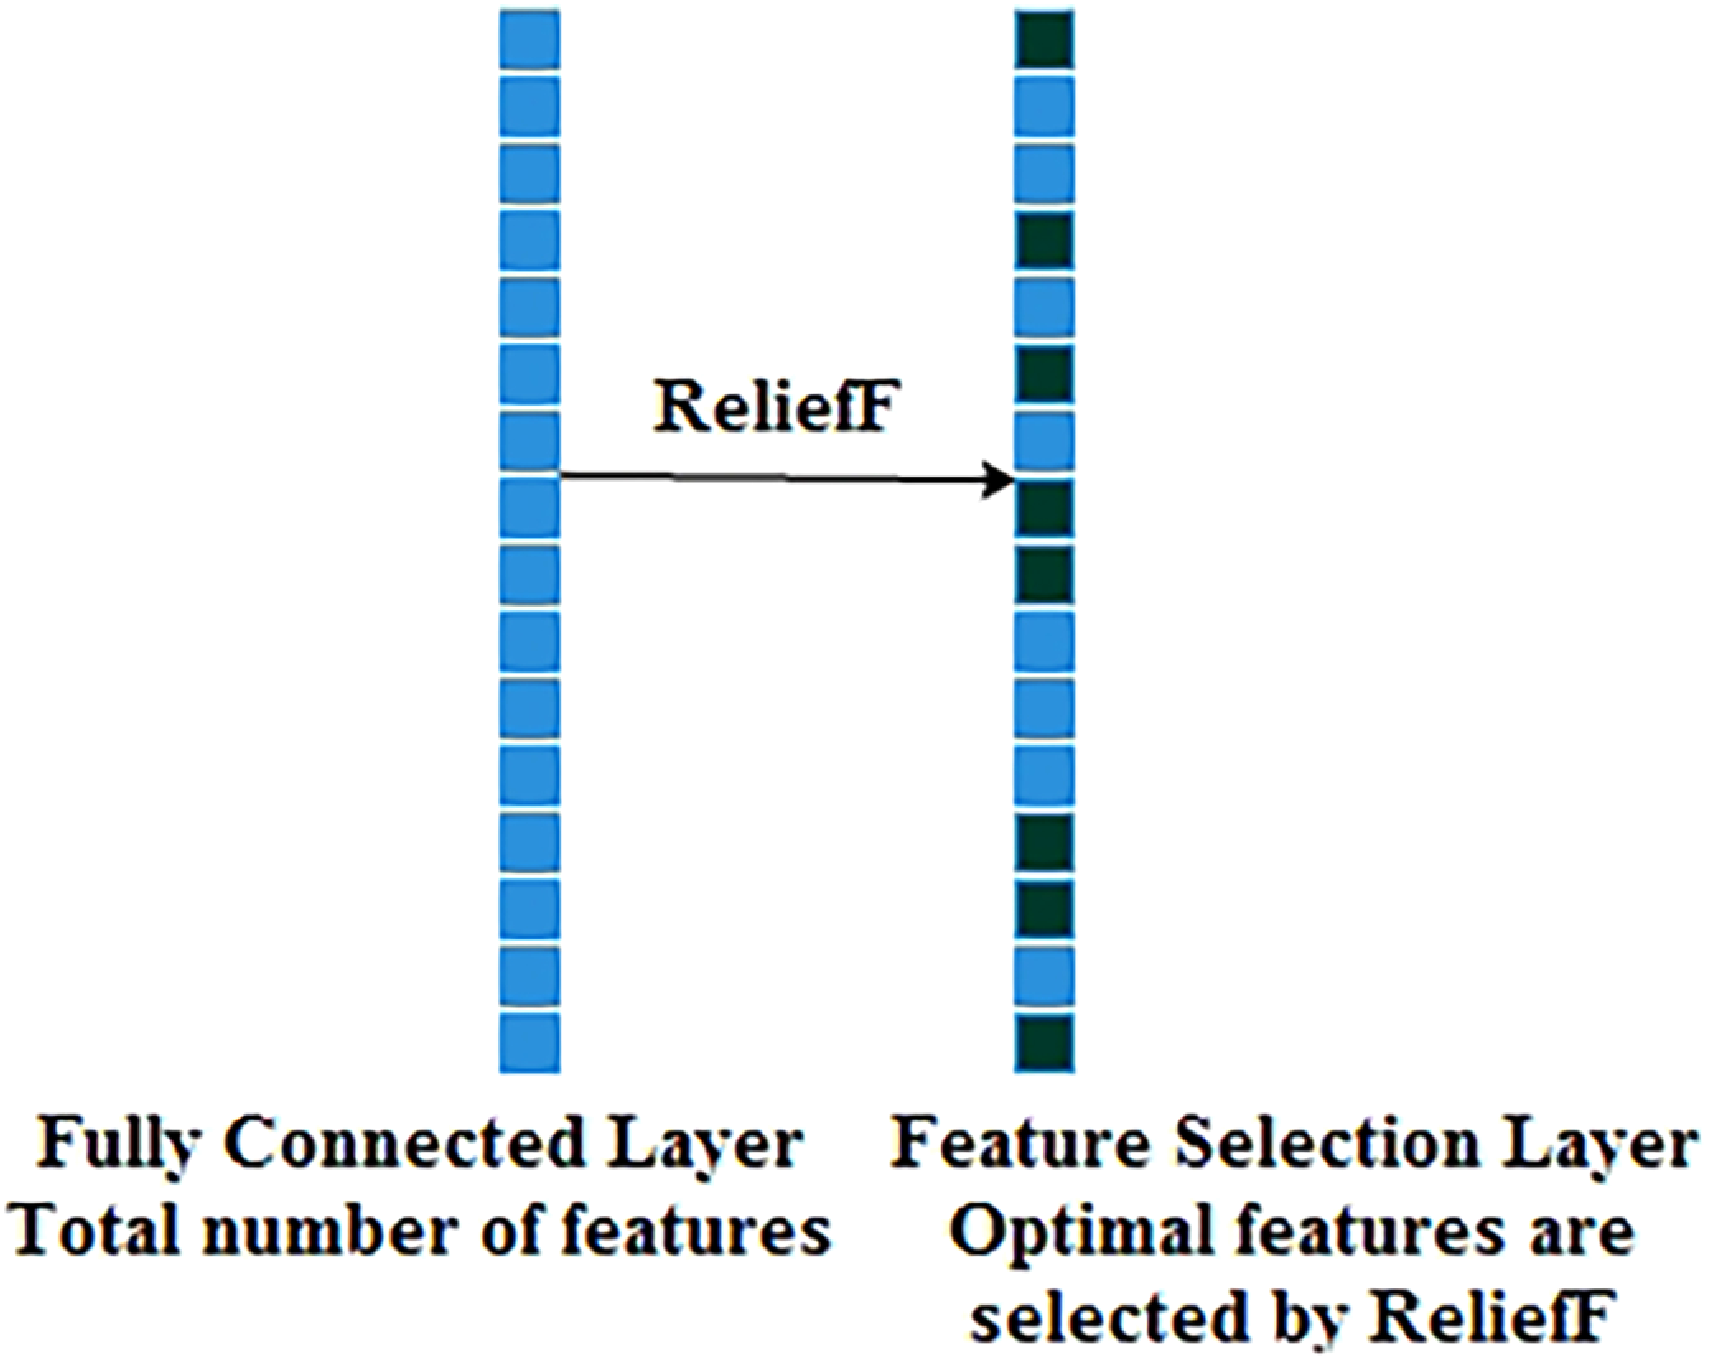
Process of feature selection using reliefF.
Where F is the feature, WF represents the score/weight of the feature computed between the target and neighbouring instances, It represents the target instance, H is the one nearest hit instance in the same class, M(C) represents one nearest miss instance for each different class and finds average, P(C) is the probability of each class, n represents the number of random training instances, diff() calculates the difference of feature F with target instance It and either H or M, k represents ‘number of neighbours’ that specifies k nearest hits and k nearest misses, and [1-P(class(It))] is the probability of miss class, It and I't are neighbouring instance pair.
Proposed feature classification using SVM
In the feature classification stage of the stated architecture, the support vector machine (SVM) technique44–49 is applied to distinguish the COVID-19 class from pneumonia and the normal sets, as shown in Figures 2 and 4.

Process of feature classification using SVM.
The central intuition determines the hyper-plane (decision boundary) that linearly separates the binary classification. Here, the boundary calculation is 

The minimization of classification error and maximization of margin are controlled by cost parameters.
The standard hinge loss function is defined in Equation (22),


DNN features in the form of activations from the feature selection (ReliefF) layer to the feature classification (SVM) layer achieve higher classification accuracy than from the fully connected layer to the feature selection (ReliefF) layer or from the max pooling layer to the fully connected layer, as shown in Figure 5. Because a fully connected layer collects the extracted features from earlier layers, and ReliefF reduces the redundant features and selects relevant features. Finally, the SVM classifier classifies diseases more accurately from chest X-ray and CT images.

Process of feature selection and classification.
In this research, the proposed network predicts the highest probability among the given diseases and retains the essential feature maps that best describe the context of the medical image. The proposed model shows performances comparable to state-of-the-art models, as illustrated in the results and discussion section.
Materials
The primary concern regarding the association of machine learning and deep learning approaches considers suitable labelled data. The proposed neural models’ performance metrics were measured using chest X-rays and CT scans. The chest image datasets are subdivided into broadly two broad categories. The classification neural model was formulated with two image datasets: Dataset A and Dataset B. The data augmentation is performed with parameterized transformations like horizontal_flip, vertical_flip, rotation, zoom, shear, and rescale on the original chest X-ray and CT image dataset.
Dataset A 11 also comprises X-ray image datasets, categorized into three classes: Pneumonia, Normal, and COVID-19 viral infectious disease. Those are depicted in Table 3. The data distribution of X-ray (Dataset A) is illustrated using a bar graph in Figure 6.
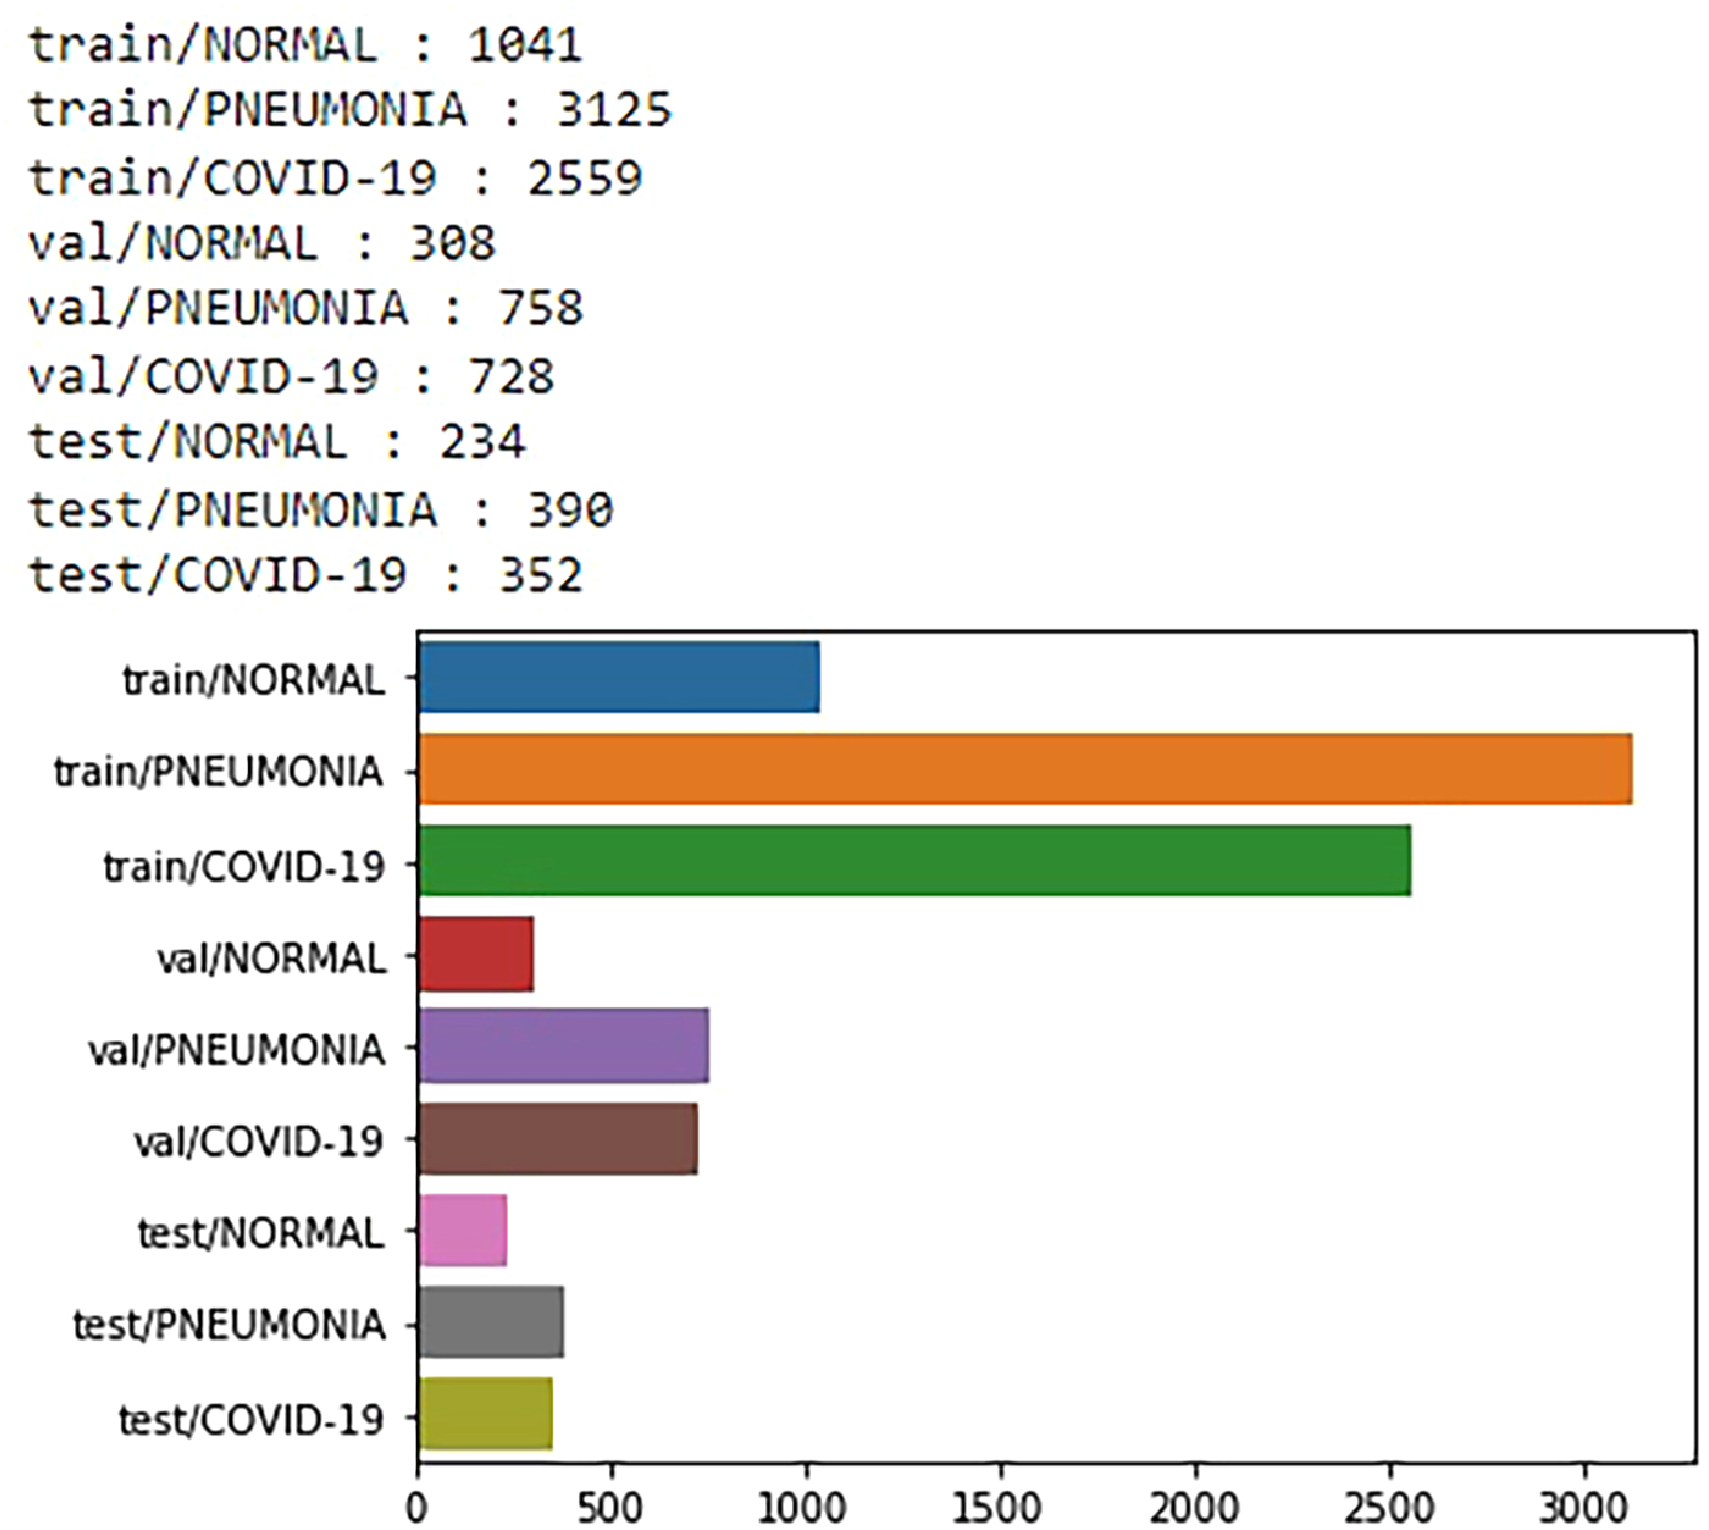
Data distribution of chest X-ray images from dataset A.
Data distribution of chest X-ray images from dataset A.

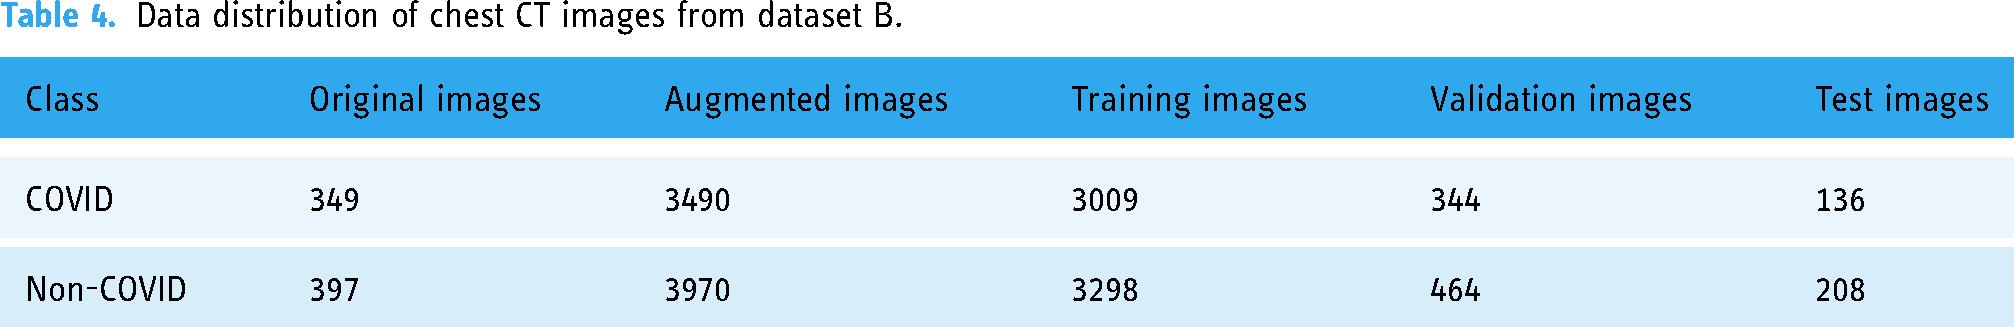
Dataset B 19 comprises CT-scan images categorized into two classes. COVID-19 viral infectious disease and non-COVID viral infectious disease. The image distribution of the radio image CT scan is illustrated in Table 4. The CT-scan (Dataset B) data distribution was illustrated using a bar graph in Figure 7.
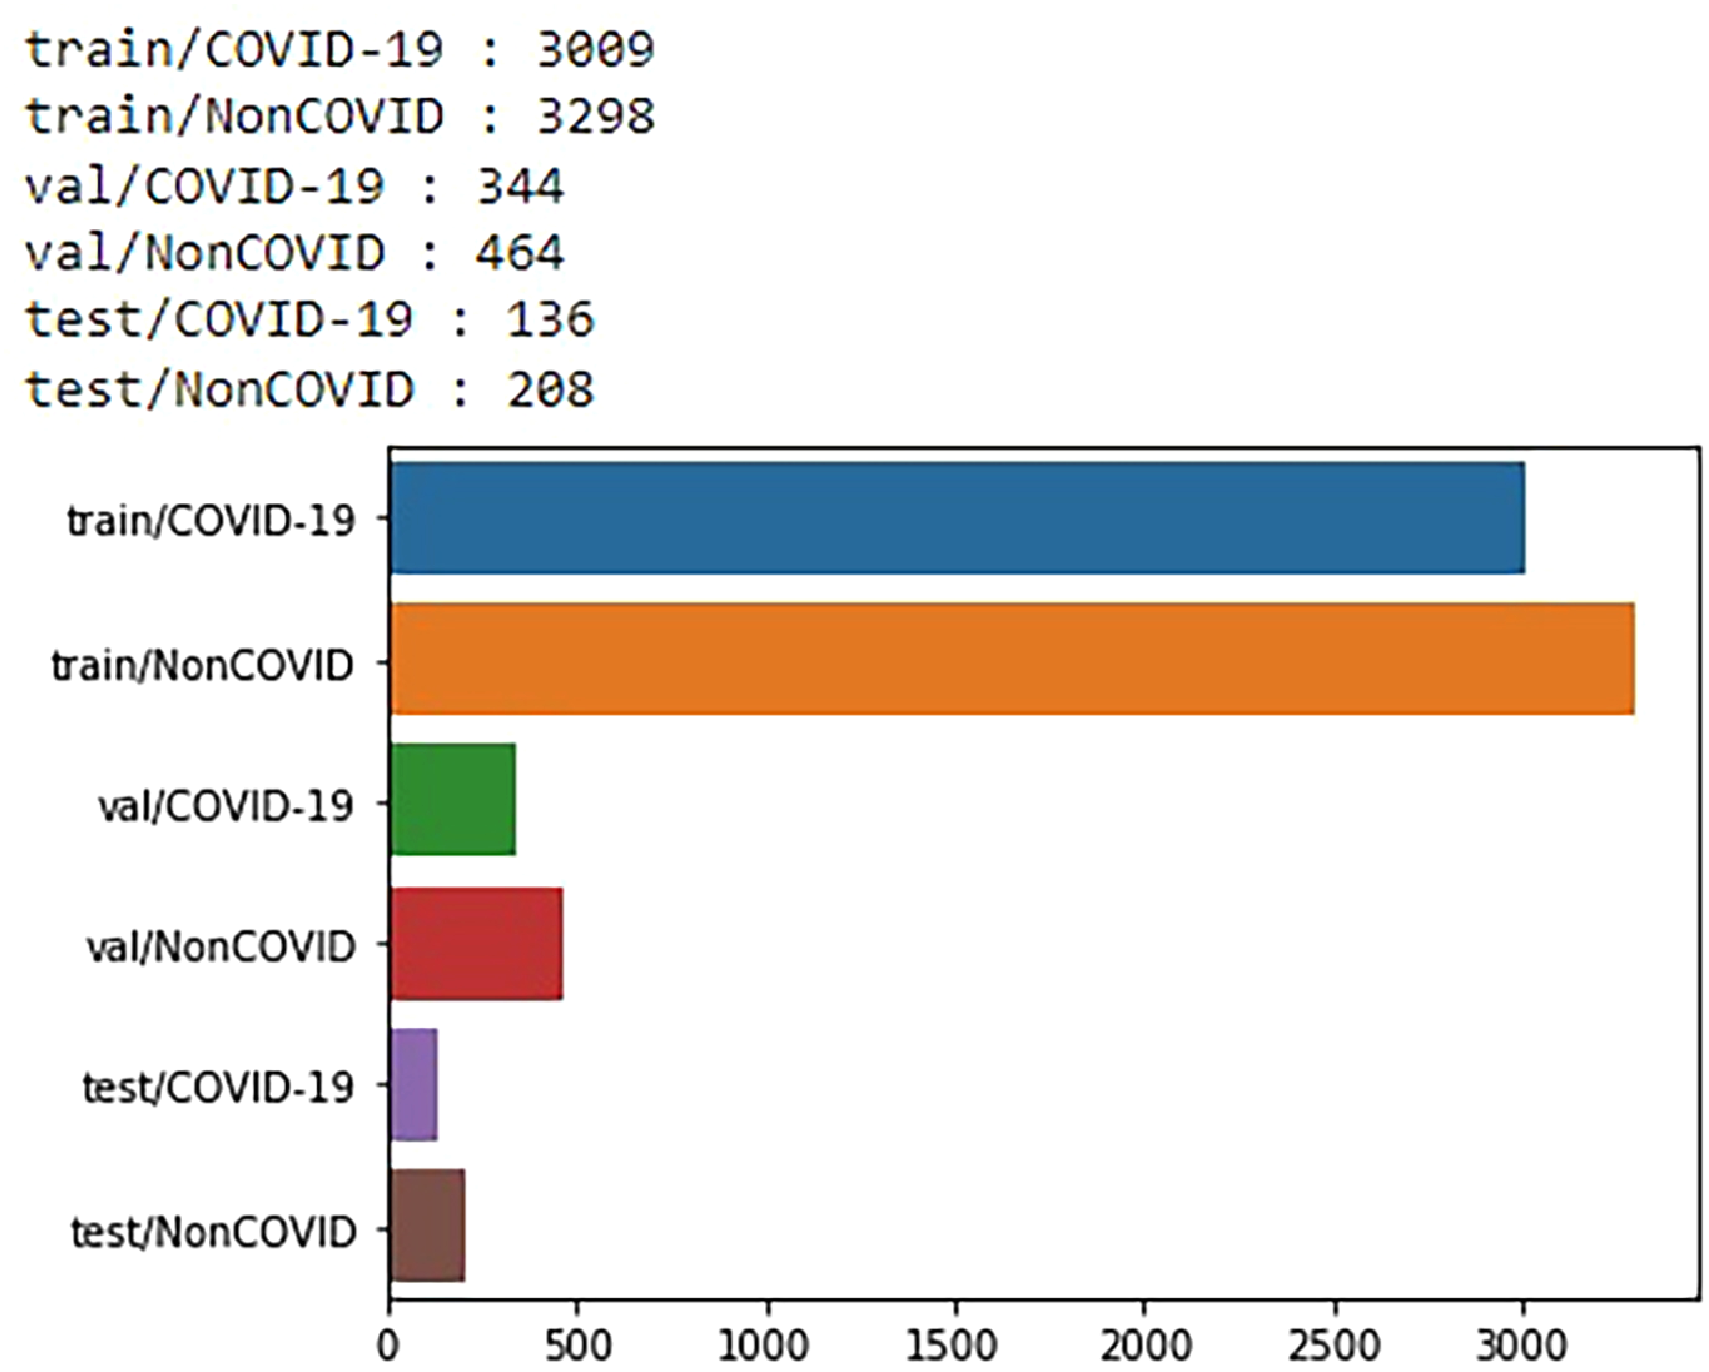
Data distribution of chest CT images from dataset B.
Data distribution of chest CT images from dataset B.
Results
The proposed model is developed using TensorFlow and Keras and trained on an Apple OS X Laptop with a GPU Processor (AMD Radeon Pro. 5300M @ 2.67 GHz) with 8GB RAM.
Evaluation metrics
The Confusion Matrix is generated for evaluating the proposed model. It is defined in Equation (25).
Predicted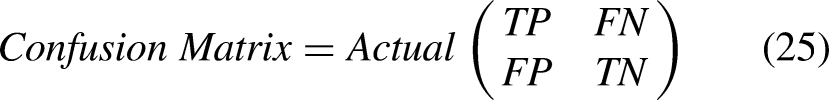
Equations (26), (27), (28), and (29) calculate the model accuracy, loss, sensitivity and specificity.


Results of proposed model for classification task
The simulation results are described in the forthcoming paragraphs to evaluate and validate the adequate performance of the proposed model. The proposed model is used to classify viral infections among binary or triplet classes like COVID-19, pneumonia, and healthy cases. The model performance is improved by using optimized parameters as given in Table 5, like learning rate 1e-3, activation function ReLU, optimizer adam, classifier SVM, kernel linear, cost 1, hinge loss function, regularization L2-norm, batch size 10, epoch 50, and 5-fold cross-validation. The training and validation accuracy gradually decreases if we apply less or more than 50 epochs. Generally, the number of epoch selections is determined by the model's maximum training and validation accuracy. Therefore, training and validation with 50 epochs is the cut-off point of the proposed model.
Hyper parameters setup for proposed model.

The effectiveness of the proposed method is evaluated by examining the training and validation accuracy and loss for chest X-ray images, as shown in Figures 8 and 9. The proposed classification network achieves training, validation and testing at different epochs on X-ray images, as demonstrated in Tables 6, 7, and 8. For X-ray images, the proposed neural model has achieved the training and validation accuracy of 96.01% and 97.38%%, respectively, at the 50th epoch as shown in Figure 8.

Training and validation accuracy on X-ray.

Training and validation loss on X-ray.
Training accuracy on X-ray.

Validation accuracy on X-ray.

Test performance on X-ray.

The effectiveness of the proposed method is assessed based on the training and validation accuracy and loss for chest CT images, as shown in Figures 10 and 11. The performance obtained in training, validation and testing on CT-scan images for the proposed model is demonstrated in Tables 9, 10, and 11. The proposed neural model also has the training and validation accuracy of 93.85% and 94.72% at the 50th epoch on CT images as shown in Figure 10.

Training and validation accuracy on CT.
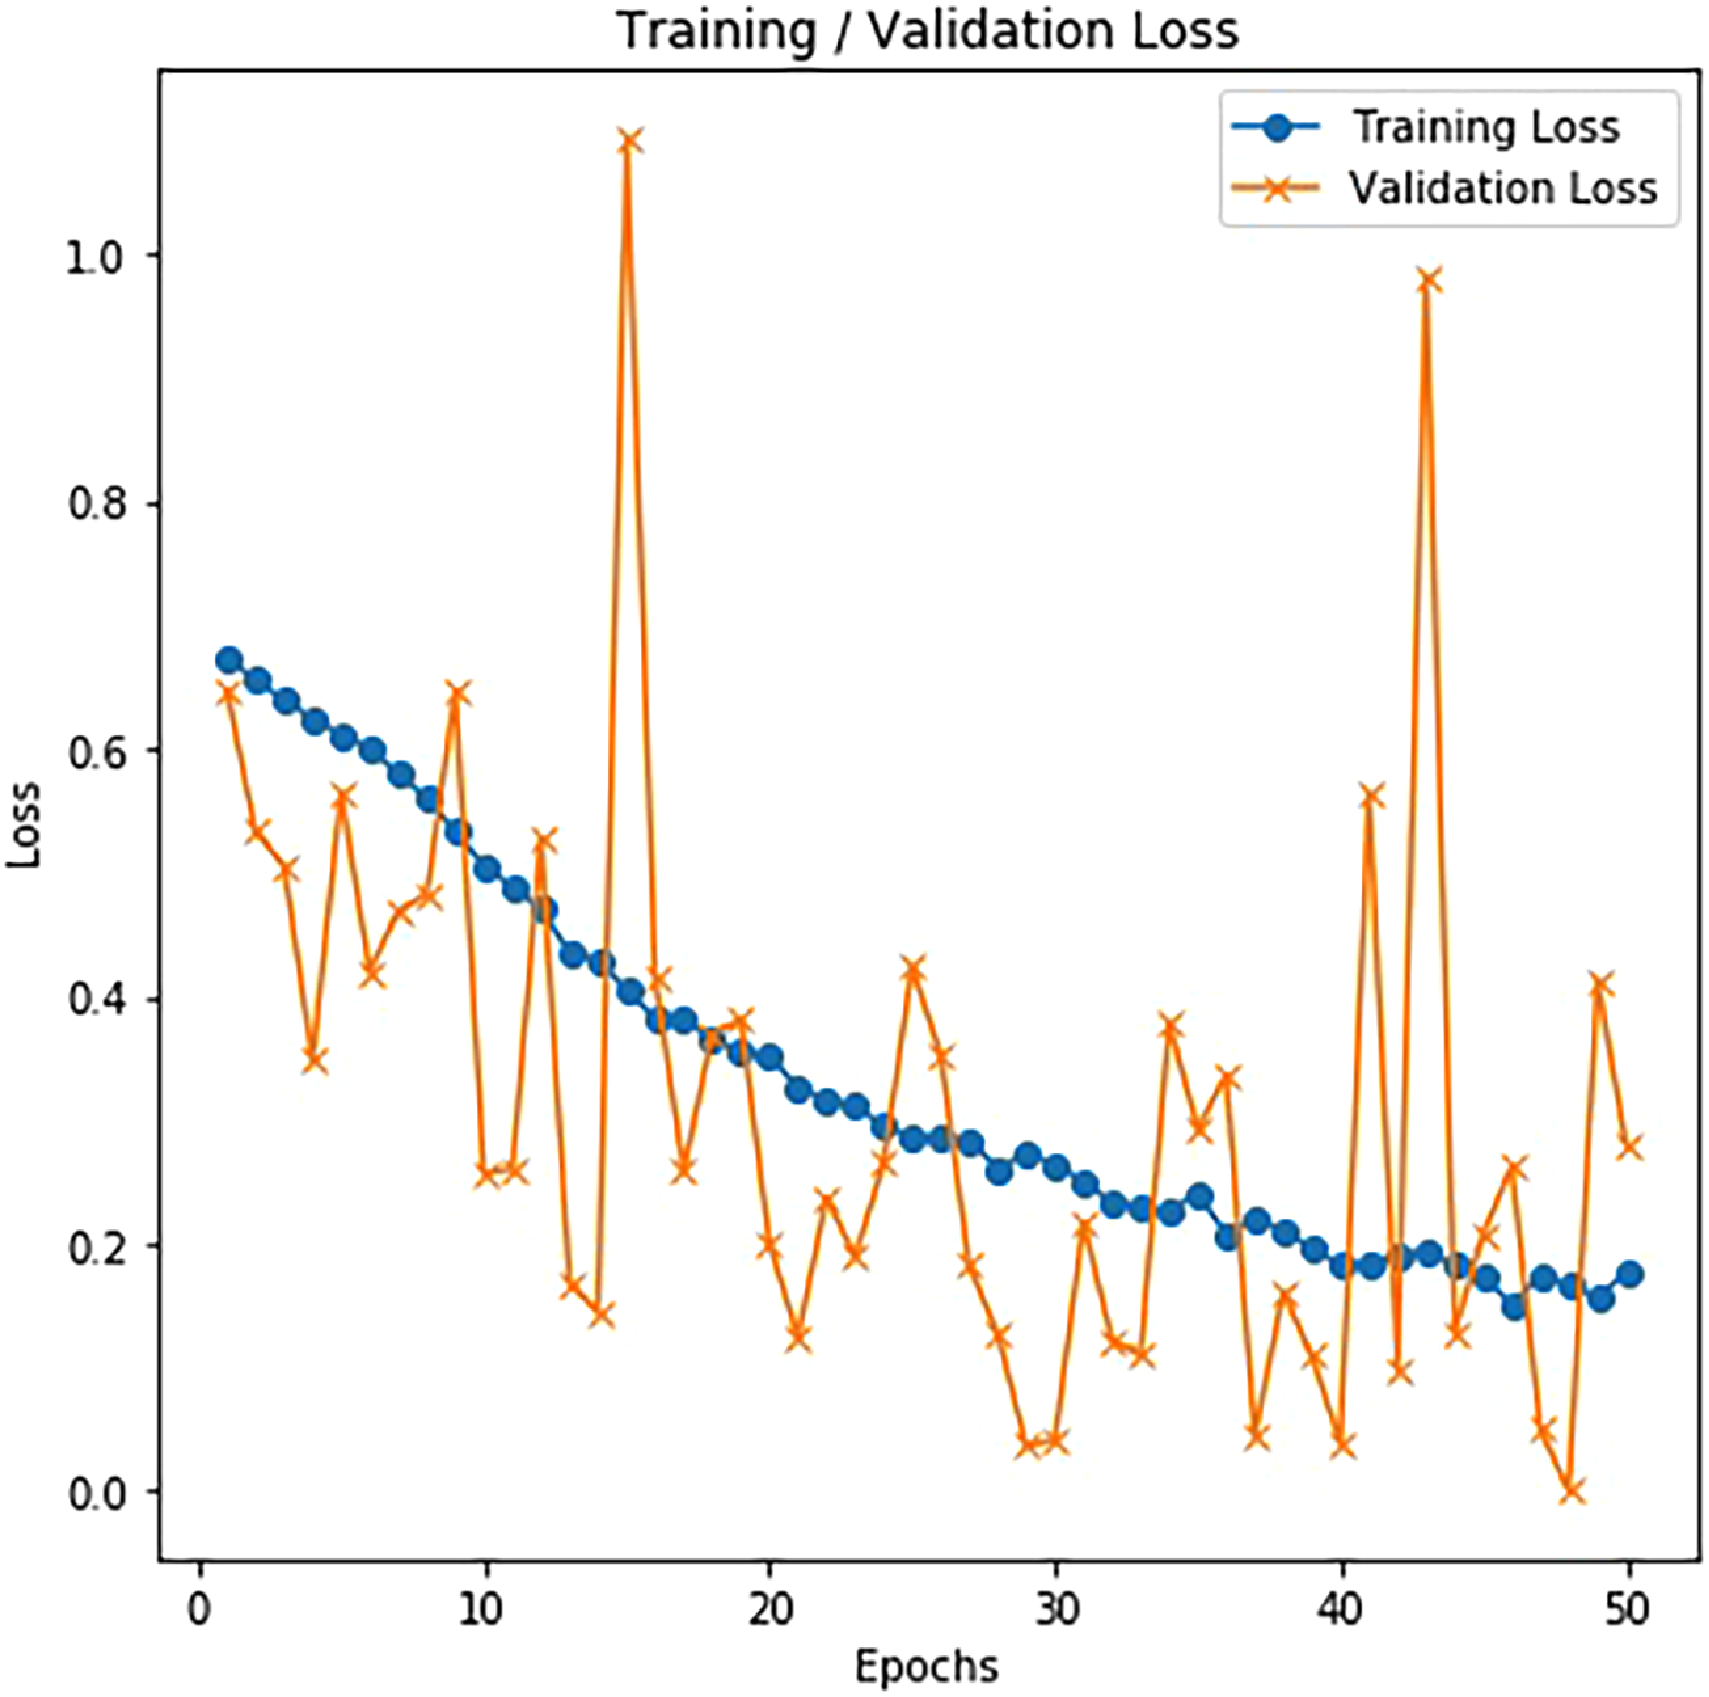
Training and validation loss on CT.
Training accuracy on CT.

Validation accuracy on CT.

Test performance on CT.

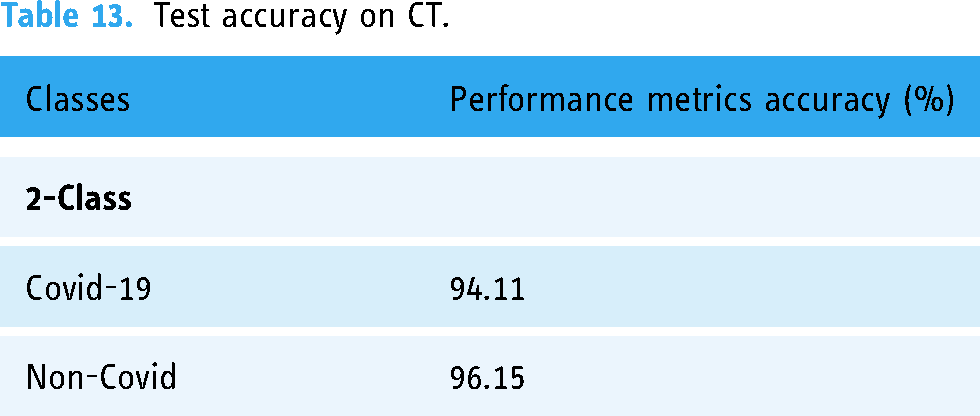
The test accuracy of the proposed method on X-ray and CT is represented in Tables 12 and 13. There, we found that the proposed model can achieve good accuracy for COVID-19 cases, which is essential since we want to restrict the number of missed COVID-19 instances as much as possible. The accuracy became 98.42% and 94.11% for COVID-19 X-rays and CT, respectively.
Test accuracy on X-ray.

Test accuracy on CT.
The performance comparisons of the proposed model with state-of-the-art are illustrated in Tables 14 and 15 for chest X-ray and CT images, respectively.
Performance comparison on X-ray.

Performance comparison on CT.

As illustrated in the literature review section, we have tried to present a comparative study on COVID-19 neural classification network models. We have identified that our proposed method has attained a test accuracy of 98.48% on 2-class X-ray images. In contrast, the state-of-the-art deep learning-based and machine learning-based models COVID-Net, 10 nCOVnet, 12 CoroNet, 14 CVD-Net, 20 DarkCovidNet, 50 CNN-SVM, 29 DenseNet121-Bagging tree, 6 and DenseNet169-XGBoost 25 have 93.3%, 97.62%, 89.6%, 96.6%, 94.18%, 99.1%, 99.0%, and 98.23% test accuracy on various X-ray image datasets. For CT-scan images, the test accuracy of the proposed model is 95.34% on two classes, whereas ConvNets 15 and ResNet-50 22 became 95.0% and 94.8%. Therefore, the performance of the proposed model is acceptable and comparable with state-of-the-art models.
We have the confusion matrices of 2-Class and 3-Class for both radio images, namely, CT-scan and X-ray, shown in Figures 12 and 13.

Test confusion matrix on CT.

Test confusion matrix on X-ray.
The test output prediction on the proposed model from X-ray and CT images is shown in Figures 14 and 15. Here, the first image in Figure 14(a), the second image in Figure 14(b) and the third image in Figure 14(c) show the output predicted class is normal, Pneumonia and COVID-19, respectively, from X-ray images. Similarly, the first & third images in Figure 15(a) and (c) and the second & forth images in Figure 15(b) and (d) show that the output predicted class is NonCOVID and COVID-19, respectively, from CT-scan images. The quantitative and qualitative outcomes show that the proposed model can examine and classify the infected lung.

Proposed model prediction on X-ray (a) Normal (b) Pneumonia (c) COVID-19.

Proposed model prediction on CT (a,c) Non COVID (b,d) COVID-19.
Discussion
We have compared our proposed model with state-of-the-art models like COVID-Net, 10 nCOVnet, 12 CoroNet, 14 CVD-Net, 20 DarkCovidNet, 50 CNN-SVM, 29 DenseNet121-Bagging tree, 6 DenseNet169-XGBoost, 25 ConvNets 15 and ResNet-50 22 for detecting COVID-19, pneumonia, and normal from chest X-rays and CT images. The performance of each state-of-the-art model varies due to the use of various- image modalities, image datasets, hyper-parameters, methods, and training procedures. We have observed some of the state-of-the-art models perform efficiently. We have observed that a better combination of deep learning and machine learning techniques is the limitation of some models. Our proposed model consists of deep learning-based feature extraction using deep CNN, machine learning-based feature selection using ReliefF, and machine learning-based feature classification using SVM. The comparative results show the proposed method's superior performance.
The following are the explanations for the superiority of the proposed work. (1) the proposed new deep CNN can extract in-depth local and global features efficiently through a series of 3×3 convolution, 2×2 max polling operations followed by flatten and fully connected layer, (2) the proposed ReliefF is capable of selecting most important features effectively by computing feature ranking, (3) the proposed SVM can classify diseases efficiently by using linear kernel function and
Due to the scarcity of labelled medical data, the performance of the proposed model is evaluated with limited data. So, the model performance can be improved further with more quality chest X-ray or CT images of COVID-19, pneumonia, and healthy types. It is the future scope of our work.
Conclusion
Rapid and accurate detection and observation of COVID-19 progression are necessary for medical advancement to restrain and control the disease. The increased circumstances of COVID-19 patients and limited identification test kits pose challenges in accurately detecting illness. Therefore, this paper introduces two-state strategies for proper detection by implementing deep learning and machine learning models. As observed in the proposed network, there is an in-depth feature extraction from the convolution, max-pooling, and fully-connected layers. To advance the proposed classification method, we implement an advanced feature selection algorithm, the ReliefF algorithm, which selects the most efficient features from the extracted features. We have also introduced an advanced feature classification algorithm, Support Vector Machine (SVM), to differentiate COVID-19 occurrences from Pneumonia and healthy cases, minimizing false-negative (FN) possibilities. It is observed that the proposed DNN-RLF-SVM model is performing better than CNN-Softmax when the training data size is limited. Thus, our new classification architecture is behaviorally distinct and provides competitive and promising results against other state-of-the-art classification networks. The proposed classification model achieves an accuracy of 98.48% in X-ray image databases and 95.34% in CT-scan image databases. The results of the proposed model are acceptable and comparable with state-of-the-art models. To conclude, our proposed neural networks will be a good competitor for better diagnosing COVID-19 patients in a crucial timeline.
Footnotes
Acknowledgements
The authors are thankful to Dr. Biswarup Goswami, Department of Respiratory Medicine, Health and Family Welfare, Government of West Bengal, India.
Contributorship
Sanjib Saha: Conceptualization, Methodology, Investigation, Implementation, Visualization, Writing, Editing, Revision; Debashis Nandi: Supervision, Editing.
Declaration of conflicting interests
The authors declared no potential conflicts of interest with respect to the research, authorship, and/or publication of this article.
Ethical approval
There is no ethical approval required for this article.
Funding
The authors received no financial support for the research, authorship, and/or publication of this article.
Guarantor
SS
Patient consent
There is no patient consent required for this article as publicly available image datasets are used in this work.