
Abstract
Objectives
The current research introduces a stochastic deep learning method with the aim of enhancing lung disease detection, particularly pneumonia, in chest X-ray images. The goal is to improve diagnostic precision and help facilitate more effective clinical practices.
Methods
We deployed a better convolutional neural network architecture, thoroughly optimized with dropout regularization and aggressive data augmentation to support classification performance as well as model resilience. The training process utilized stochastic deep learning using stochastic gradient descent, with K-Fold cross-validation and early stopping used for exhaustive model optimization and against overfitting.
Results
Experiment results invariably prove the efficacy and efficacy of the suggested method. Throughout the validation folds, the model recorded marked improvements in precision and loss measures. It is interesting to see that on fold 5, the suggested model registered a remarkable accuracy of 0.9940 and precision of 0.9960 in diagnosing pneumonia.
Conclusions
This deep learning strategy provides an effective tool for computerized, precise identification of lung diseases from chest X-rays. Its high accuracy has great promise for applications in real-world clinical practice, allowing for earlier and more consistent diagnoses, which could result in timely interventions and ultimately help reduce severe outcomes and rates of mortality in patients. Although extremely promising, additional validation on varied, large datasets and implementation within clinical decision support systems will be important for widespread use.
Keywords
Introduction
Lung diseases, particularly pneumonia, pose a significant global health concern. Chest X-ray imaging serves as a crucial non-invasive tool for early detection. Pneumonia continues to be a major global health challenge, responsible for millions of deaths annually, disproportionately affecting children under five and the elderly. Consequently, early and accurate detection of pneumonia is paramount for reducing mortality and improving patient outcomes. The diagnosis is generally made by clinical evaluation and imaging methods, the most common being chest X-rays. 1
But traditional detection techniques based on radiologists interpreting chest X-ray images manually have some drawbacks. They are the unavailability of trained radiologists, high inter-observer variability, and a possibility of diagnostic error due to pneumonia's subtle and complex radiological findings. Further, in resource-constrained environments, restricted availability of trained professionals and advanced diagnostic technology increases these gaps, resulting in late diagnosis and treatment. These constraints put in sharp relief the urgent need for precise, consistent, and automatic devices to detect pneumonia.
The recent years have seen a revolution in artificial intelligence, especially deep learning, for the application of medical imaging. Convolutional neural networks (CNNs) are now the norm in medical image analysis and have achieved stellar performance in classification, segmentation, and detection tasks. CNNs are best designed to automatically learn hierarchical features from imagery data and perform extremely well in finding subtle patterns and anomalies that perhaps might be hard for human vision to identify.2,3 CNNs have been used in medical imaging to gain unprecedented success in the diagnosis of many diseases, ranging from cancer to diabetic retinopathy and pneumonia. In the application of detecting pneumonia, CNNs have been very successful in interpreting chest X-ray images with a very high degree of accuracy and speed. They can read huge volumes of data, find patterns that are very complex, and make predictions which, in certain scenarios, match or even surpass human expert levels.
Despite their success, CNN-based models have typically needed enormous amounts of labeled data to be used during training. Furthermore, their performance can be jeopardized by overfitting as well as by the inherent image quality variability that is a natural part of the data. These challenges identify the ongoing need for the continued examination and reinforcement of CNN architectures in order to realize their full capabilities for application in significant medical diagnostic applications.
Stochastic-based learning, most typically represented by stochastic gradient descent (SGD) and its descendants such as Adam, is a core method in machine learning and deep learning frameworks for optimizing a specified loss function. This method works by periodically adjusting model parameters based on a random, limited subset (even an individual example) of the training data, rather than using all of the data as in conventional gradient descent. This approach provides great computational savings, especially for big data, and helps to search the loss landscape to prevent inferior local minima. 4 Typically, stochastic-based learning combines randomness and probabilism in optimizing the training process using optimizers like SGD or Adam iteratively adjusting model parameters to reduce prediction errors. 5
The primary objective of this study is to develop an improved stochastic-based CNN for diagnosing pneumonia in chest X-rays. The methodology proposed integrates stochastic deep learning techniques with early stopping strategies in order to surpass the shortcomings of the traditional CNN models. The induced randomness with the help of stochastic techniques can significantly improve model generalization and robustness against overfitting. Early stopping, one of the most popular regularization techniques, also avoids overfitting through training stopping when the performance of the model on the validation set improves no further. For model reliability and generalizability, K-fold cross-validation is employed. This process divides the dataset into multiple folds systematically and, with one fold acting as a test set, the remaining folds make up the training set. This not only maximizes the utilization of data but also provides a comprehensive and unbiased evaluation of the performance of the model on various subsets of data.6,7 With the combined use of stochastic deep learning, early stopping, and K-fold cross-validation, this research aims to overcome the intrinsic limitations of existing CNN models and establish an effective system for accurate pneumonia detection from chest X-ray images.
In general, the study is set to contribute to the advancement of the medical imaging field by enabling better pneumonia detection with the use of CNNs. By making use of stochastic approaches and advanced validation methods, the study seeks to enhance model accuracy, robustness, and usability within real-life clinical settings. This is in line with the ultimate goal of utilizing AI to bridge gaps in medical care and eventually improve patient outcomes, mainly in underserved populations where the weight of pneumonia is highest.
The application of stochastic-based learning methods has gained tremendous attention in the analysis of medical images, particularly for chest X-ray diagnosis, because of their capacity to maximize model performance when handling intricate and massive amounts of data. For instance, Ghandour et al. 8 introduced a novel automatic pneumonia classification method that utilized three pre-trained CNN models fine-tuned with XGBoost as a classifier. Their approach, with hyperparameter tuning carried out with Bayesian optimization and improved feature representation from the Chest X-ray dataset, achieved excellent results: 99.15% accuracy, 99.53% precision, and an area under the curve (AUC) of 0.9972%. Wang et al. 9 also presented the stochastic neural ensemble learning framework for reliable classification of thoracic diseases from chest X-rays.
The authors tested their method on three publicly accessible large-scale datasets: ChestXray14, CheXpert, and PadChest. Deepak et al. 10 utilized three pre-trained CNNs: SqueezeNet, ResNet-50, and EfficientNet-b0. The dataset used comprises 5863 chest X-ray images sourced from public datasets, including a subset of 100 images for testing. Li et al. 11 introduced an attention-enhanced ResNet-50 architecture for pneumonia detection using 5856 chest X-ray images with 4273 pneumonia images (bacterial and viral) and 1583 normal images. They had achieved an accuracy of 94%. Manickam et al. 12 presented combination of deep learning and transfer learning models. They had used 5300 X-ray images and had used two batch sizes and two optimizers and had obtained the value of accuracy as 93.06%. Dey et al. 13 proposed modified VGG19 and introduced an ensemble approach. Accuracy is 86.97%. Trivedi et al. 14 had proposed detection of pneumonia and had used 5856 chest X-ray images. They had achieved an accuracy as 97.34%. Jain et al. 15 presented CNN for detection of pneumonia. The accuracy of VGG19 is 88.46%. Gupta et al. 16 had presented neural architecture search using 5863 chest X-ray images and had achieved AUC of 97.6%. Varshni et al. 17 worked using 4264 images of CXR for diagnosis of Pneumonia. They had obtained the value of AUC as 0.9582. Hashmi et al. 18 had presented ResNet50 model for pneumonia detection. They had obtained the accuracy of 98.14% using 5836 images. Zhang et al. 19 had presented dynamic histogram equalization process and compared the process with different architectures using 5786 chest X-ray images and had obtained the accuracy as 96.07%. Hashmi et al. 20 had integrated five transfer learning models. They had worked using 5836 images and had achieved the accuracy as 98.43%.
The researchers recently utilized various hyperparameter optimization techniques to improve the model performance. Identifying water scarcity as a global key problem, this research centers on the maximization of water resource management and forecasting in India, a nation with a severe shortage of water. Based on a 2017 district-level Indian groundwater dataset with 689 districts and 16 indicators, the research 21 utilizes five regression algorithms—RandomForestRegressor, DecisionTreeRegressor, MLPRegressor, KNeighborsRegressor, and SupportVectorRegression—to assess and forecast water resources. The RandomForestRegressor outperformed all others with an MSE of 0.000206624, which underscores the potential of predictive analytics to enhance water resource management and help avoid the looming water crisis.
With increasing energy demand and the ill effects of fossil fuels, producing electricity from waste and renewable sources is an international necessity, with WtE technologies being a noble answer to both energy saving and waste management. 22 The imperative for new WtE technologies—thermal, biological, and physicochemical processes—is highlighted by the prognostic estimate of a 70% global growth in waste generation by 2050. Combining waste management, renewable energy, and computational optimization tools such as genetic algorithms and neural networks holds the potential for sustainable energy production and resource governance, as deeply reviewed herein to counter technical, operational, and social challenges for future development.
Identifying the weaknesses of conventional techniques and cloud infrastructures in traffic forecasting, the study 23 suggests a data-driven methodology adopting a bidirectional recurrent neural network (BRNN) integrating gated recurrent units to improve traffic management in smart cities. The BRNN model identifies and classifies actual traffic information in real time, such as speed, weather, and probability of accidents, as congested and non-congested states. This method showed better performance than other methods, as it provided a potential method for more effective traffic control and better congestion forecasting by integrating varied features such as traffic, road, and weather conditions.
The work 24 suggests a new two-level ensemble machine learning model for predicting the bandwidth of metamaterial antennas with considerable time reduction in design. The first level of the model is Random Forest, Support Vector Regression, and Light Gradient Boosting Machine, and the second level is ElasticNet regression refinement with the advanced squirrel search optimization algorithm used to optimize hyperparameters for best performance. Experimental results with an RMSE of 0.013, MAE of 0.004, and MBE of 0.0017 prove its better accuracy than the current ensemble models.
The authors 25 presents the Greylag Goose Optimization (GGO) algorithm, a new swarm-based metaheuristic inspired by geese's “V” flight pattern during migration that has the effect of reducing air resistance and increasing travel efficiency. Tested on 19 UCI Machine Learning Repository datasets for feature selection and being used in different engineering benchmark functions and case studies, such as pressure vessel and tension/compression spring design, the GGO algorithm outperforms other comparison optimization algorithms at all times in accuracy, supported by Wilcoxon's rank-sum and ANOVA statistical tests.
The research 26 fulfills the challenge of scarce labeled data in medical image segmentation by introducing a new active learning approach that capitalizes on the diversity and efficiency of random sampling to improve uncertainty-based approaches. Particular attention is given to stochastic batch querying to calculate uncertainty at the batch level, a clean and powerful add-on that can be applied to any uncertainty-based measure. Large-scale experiments on two medical image segmentation datasets prove this method to be substantially better than traditional uncertainty-based sampling methods consistently, making it a solid baseline for the community.
Continued development in AI, 27 particularly deep learning, is substantially contributing to the identification, classification, and quantification of patterns in clinical images across all the diverse medical fields. This paper presents a state-of-the-art review of deep learning application in medical image analysis and processing, stressing its applicability for big data exploration, knowledge deployment, and knowledge-based prediction.
The research 28 explores the performance effect of Augmenting, Stacking, and Bagging ensemble machine learning methods in medical image classification workflows, leveraging top-of-the-line pre-processing, augmentation, and nine deep CNN models for four datasets. The findings show that Stacking gained the greatest performance improvement (up to 13% F1-score gain), followed by Bagging (up to 11%), and illustrated that basic statistical pooling functions also outperformed more complex ones, validating the strength of ensemble learning in strengthening robustness and performance in medical image classification.
To take on the limitations of limited medical image data and label fluctuation due to over-augmentation, this work 29 introduces Bayesian Random Semantic Data Augmentation (BSDA), a computationally light, plug-and-play approach to deep neural networks. BSDA, an improvement over current semantic data augmentation methods through careful regulation of feature shifts, has been empirically demonstrated to surpass strong baselines on 2D and 3D medical image datasets and multiple modalities, improving baseline performance in popular neural networks.
Previous researches have limitations in optimizing the dee learning models. We optimized the models by tuning the hyperparameters of dropout layers, data augmentation, and K-fold cross-validation, which reflect our dedication to deep learning best practices. We utilized the stochastic learning process, and in particular about the Adam optimizer and how it can contribute to making the training process more efficient. This optimizer dynamically calculate individual learning rates for every parameter based on estimates of the first (mean) and second (uncentered variance) moments of the gradients. We also outline how Adam cleverly incorporates a momentum term to speed up convergence and reduce oscillations and hence better aid navigation of flat loss landscapes and escape local minima. In addition, we address why bias correction of the initial moment estimates is significant in making them more stable and having a faster convergence, particularly in the initial phase of training. We further enhanced search through the loss space possible, so the model can converge more quickly and potentially achieve better optima with less training.
The key contributions of this study include:
Development of an enhanced stochastic-based CNN architecture tailored for pneumonia detection in chest X-ray images. The model leverages an effective architecture with two convolutional layers and two fully connected layers, making it computationally efficient while maintaining high performance for binary classification tasks. Implementation of K-fold cross-validation to ensure comprehensive evaluation and reliability of the proposed model. The use of the Adam optimizer allows the model to converge faster by adapting the learning rate for each parameter. Demonstration of the model's effectiveness in improving accuracy and generalization, paving the way for practical clinical applications, especially in resource-constrained settings
Rest of the paper is structured as Introduction section gives literature review followed by materials and methods, Results section shows results followed by discussion and conclusion in Discussions and Conclusion sections.
Material and methods
This section offers a comprehensive account of the approach used for our model construction. It starts with an account of the dataset, followed by a discussion of the image pre-processing methods and data augmentation techniques used. The introduced stochastic learning method intended to speed up the training process is followed by an explanation of the procedure of training the CNN model. Also, the advanced CNN architecture proposed to increase performance is described. The section ends with a presentation of the evaluation metrics used to test the effectiveness of the model.
Dataset description
The data employed within this research was acquired from an open repository, which consisted of chest X-ray images that were divided into two classes: NORMAL and PNEUMONIA. 30 The data was ordered in a systematic manner to have subfolders within the principal directory, with every subfolder holding its respective images. The dataset was then loaded through a custom X-Rays Dataset class. Figure 1 illustrates some X-ray images that are representative of this dataset

Dataset samples (a) pneumonia and (b) normal.
Image pre-processing and data augmentation
Data augmentation and image pre-processing are significant steps in pre-processing the dataset for training an efficient and powerful CNN model. These steps play a key role in enhancing the quality of the input image, introducing variability in the dataset, and making the model more robust. Pre-processing of images in this research involved resizing all chest X-ray images into a given input size for standardizing the input dimension of the CNN. This was achieved through a set of augmentations. Indeed, data augmentation techniques were employed to augment the training dataset size synthetically and enhance the model's generalization ability. These processes involved random flips, rotations, resized crops, color alteration, and affine transformations, which mimic in vivo changes of medical images. Normalization was used in the pre-processing pipeline to normalize the pixel intensities of the images in order to have uniform input distributions to the model. Normalization is crucial for speeding up convergence during training and realizing stable model performance. 31
Proposed stochastic learning
Here, a deep CNN for normal vs. pneumonia classification from chest X-rays is applied. The approach uses stochastic optimization methods, specifically the Adam optimizer, which is an adaptive variant of SGD. The approach includes model training with a batch of images using stochastic procedures. In the process, the loss function, usually cross-entropy loss, is optimized by backpropagation. After training each batch, the model parameters are updated by stochastic updates to make its predictions more precise. The process is repeated for multiple epochs so that the model can converge to a solution that minimizes the loss function and improves its performance. The main components in Stochastic Learning are provided below:
SGD: An iterative optimization method employed for reducing the loss function by adjusting the model's parameters on a subset of the data. Adam Optimizer: One of the variants of SGD, Adam (Adaptive Moment Estimation) keeps per-parameter learning rates and hence is faster and more effective in training neural networks, particularly on big data.
The detailed methodology optimization process is given below:
1. SGD and the Process of Optimization: Adam is utilized to update the weights of the neural network. The update rule of Adam comes from the equations below:
First moment estimate (mean)

Second moment estimate (uncentered variance)

Bias correction terms


Weight update rule

where:
gt is the gradient of the loss function with respect to the parameters at time step t, β1 and β2 are hyperparameters that control the decay rates of the moving averages of the past gradients, η is the learning rate, ε is a small constant added for numerical stability.
Adam performs the updates based on the gradient for each mini-batch, which is the essence of stochastic learning.
The stochastic learning process by using Adam optimizer was utilized to improve the training efficiency of the model by incorporating the following parameters:
Adaptive Learning Rates: Adam computes personalized learning rates for various parameters. This is a major distinction from basic optimizers such as SGD, which employ a single global learning rate. Describe that it adapts upon estimates of the first moment (mean of the gradients) and the second moment (uncentred variance of the gradients).
Momentum Integration: Adam integrates the advantages of momentum (such as in SGD with momentum) and adaptive learning rates (such as in Adagrad or RMSprop). Describe how momentum assists to speed up convergence in useful directions and controls oscillations, resulting in faster training and improved exploration of the loss landscape.
Bias Correction: Adam incorporates bias correction terms for the initial estimates of the first and second moments. This is important at the beginning of training when these moment estimates are set to zero, so that they are not biased to zero and more accurate updates are made.
Training Efficiency Improvement: Directly relate these aspects to how Adam improves training efficiency. Improved convergence speed, enhanced sparse gradient handling, and reduced sensitivity to hyperparameter selection (versus SGD) are all direct advantages that result in faster model training and possibly improved final accuracy.
Robustness: Adam is usually robust to the selection of hyperparameters and tends to work well out-of-the-box for a broad variety of tasks and network configurations. This robustness is a key reason behind its popularity and effectiveness in practice.
Training of convolutional neural network model
The stepwise training process for CNN Model is shown below:
The sequential stages of the methodology are comprehensively presented in the flow diagram shown in Figure 2.
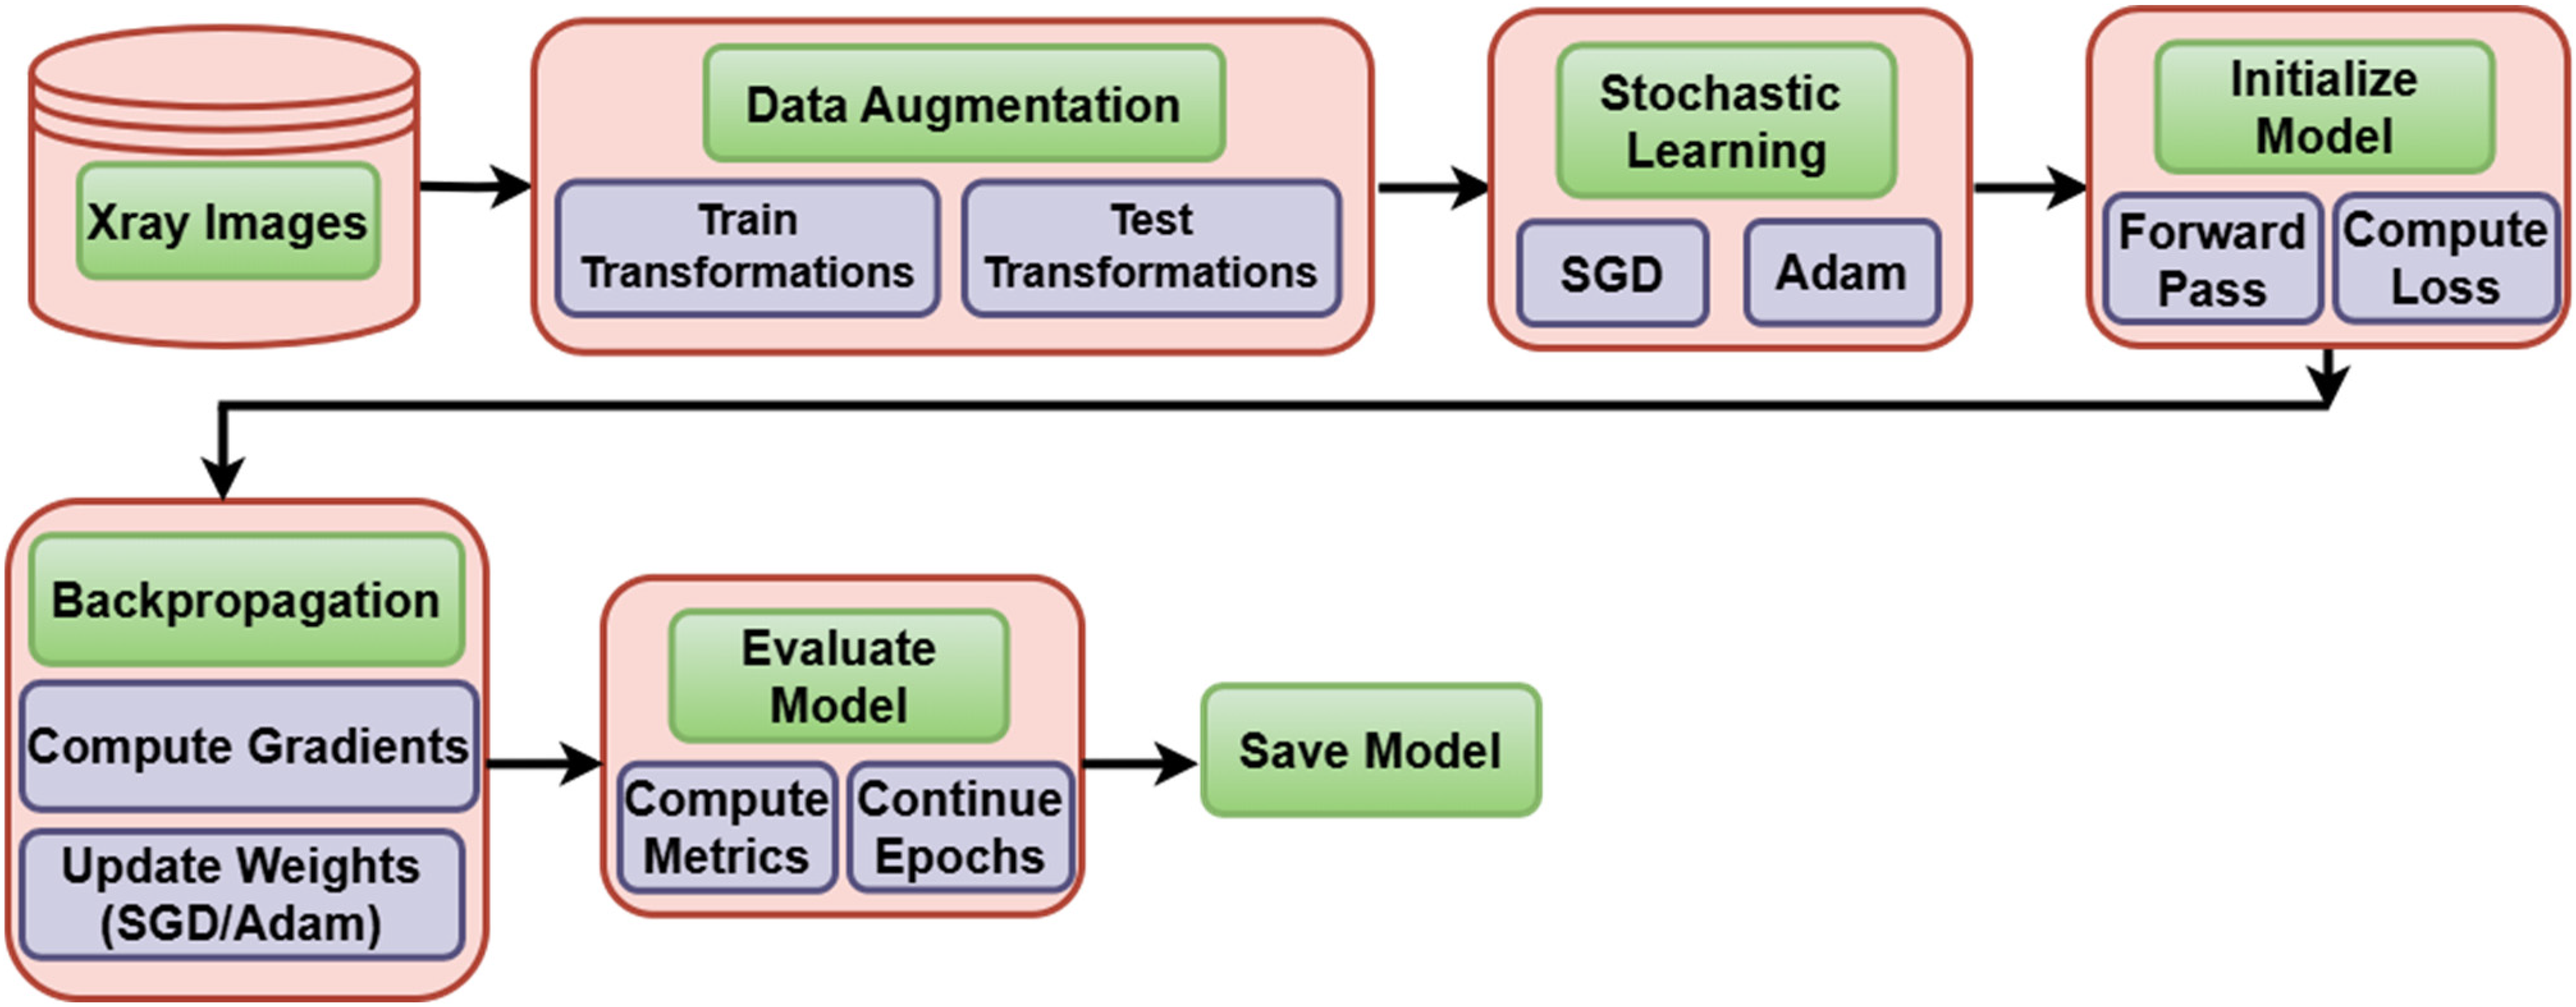
Flow diagram.
Hyperparameters optimization
The model was optimized with below hyperparameters and optimal values were obtained using grid search.
Learning Rate: [0.0001, 0.1].
Batch Size: [32, 64, 128].
Adam Optimizer Parameters:
β1 = [0.3, 0.9] β2 = [0.966,0.999] ε = [10−2, 10−8]
In addition to these parameters, our model incorporated dropout layers as a regularization technique to prevent overfitting. The specific dropout rates were [mention the specific dropout rates used, e.g. “0.5 after each convolutional block” or “varied between 0.2 and 0.5”]. This regularization, combined with K-fold cross-validation and early stopping, ensured the robustness and generalization capabilities of our model.
Hyperparameter search strategy
We give the strategy employed for hyperparameter tuning using grid search strategy for effective hyperparameter space exploration.
Range of Values Tried: For major hyperparameters (e.g. learning rate, batch size, number of neurons/layers if it was varied, regularization strengths), we provide the exact ranges or discrete values that were tried during tuning.
Evaluation Metric for Tuning: We specify which metric was used mainly to direct the hyperparameter search and determine the best set (e.g. “The best set of hyperparameters was set based on maximizing the average validation F1-score over folds,” or “minimizing validation loss”).
Effect of Various Values (Qualitative/Example): Although a complete ablation study on all hyperparameters may be out of scope, we have included a qualitative explanation or given concrete examples of how various hyperparameter values (e.g. a much higher or lower learning rate, an alternative batch size) were seen to affect model convergence, training stability, or end performance in our initial experimental phase. This shows the basis for our final choices.
Enhanced convolutional neural network architecture
The CNN architecture is used for image classification applications, specifically for RGB images of 224 × 224 × 3 size. The network starts with an input layer where the image is given as the input and passed to the first convolutional layer. This layer uses 16 3 × 3 filters to extract low-level features like edges and textures. The use of the ReLU activation function adds non-linearity, allowing the model to learn intricate patterns. Next, a max-pooling layer with a window of 2 × 2 halves the spatial dimensions and produces 112 × 112 feature maps, which aids in lowering computational complexity and attaining translation invariance. The second convolutional layer utilizes 32 3 × 3 filters to further perform feature refinement from the extracted features, focusing on more intricate patterns and structures of the image. ReLU activation is utilized again for non-linear transformation. Another 2 × 2 window max-pooling is utilized afterward, which shrinks the feature map size to 56 × 56. In order to alleviate overfitting, a dropout layer with 0.5 probability is added, which randomly shuts off half of the neurons during training. The output from the convolutional layers is then flattened into a 1D vector, moving to the fully connected layers. The initial fully connected layer projects the flattened vector, which is 32 × 56 × 56, to 64 neurons, employing ReLU activation to learn the high-level abstract features. Lastly, the second fully connected layer projects the 64 neurons to 2 output nodes, which represent the classification classes. This architecture thus has an excellent balance of feature extraction, dimension reduction, and classification and is ideal for binary image classification problems. Here is a simple flow of the model's architecture: Input Image (64 × 64 × 3) → Conv Layer 1 (16 filters) → ReLU → MaxPooling → Conv Layer 2 (32 filters) → ReLU → MaxPooling → Flatten → Fully Connected Layer (64 neurons) → Fully Connected Layer (2 neurons) → Output (Softmax Activation)
The abovementioned CNN architecture is further improved through the inclusion of stochastic methods, i.e. stochastic weight averaging (SWA), to enhance its performance and generalization ability. SWA works by keeping track of a running average of the model weights during training, particularly after the network has converged close to an optimal solution. This method assists the model in traveling through various points on the loss landscape and ending up at a collection of weights that point to a flatter minimum. Such minima are known to be related to greater generalization and resistance to unobserved data.
Adding SWA to this architecture has great advantages, particularly for noisy or high-complexity dataset tasks. By averaging weights over multiple training steps, SWA diminishes the model's sensitivity to individual data points or initialization locations, further reducing overfitting. This has synergy with dropout, as both methods work to improve the model's capacity to generalize to new data. With the already strong feature extraction and classification performance of the CNN, and added with the use of SWA, a well-optimized and stable architecture is guaranteed. It is thus highly recommended for real-world applications in which data variability and noise are the norm, enhancing the model's accuracy and stability.
Training
The training process for the proposed CNN model was meticulously designed to achieve optimal performance through the integration of stochastic optimization, robust validation techniques, and early stopping mechanisms. The key components of this training strategy are outlined in detail in Table 1.
Key components of training strategy.

SGD: stochastic gradient descent.
In conclusion, the training strategy employed in this study effectively combined stochastic optimization, early stopping, and K-fold cross-validation to construct a robust and reliable CNN model. This comprehensive approach ensured the model achieved high accuracy and strong generalization capabilities, thereby making it well-suited for real-world applications in pneumonia detection.
Evaluation metrics
Measuring the performance of a classification model is essential to know how well it can make precise predictions, especially how well it can separate classes in a data set. The most important measures like accuracy, precision, recall, F1-score, and ROC-AUC give an overall idea of a model's ability.
• Accuracy = (True Positives + True Negatives)/Total Samples
It calculates the ratio of accurately predicted instances to the total number of samples.
• Precision = True Positives/(True Positives + False Positives)
It represents how many of the positive cases predicted are indeed positive.
• Recall (Sensitivity) = True Positives/(True Positives + False Negatives)
It calculates how many of the positive cases are identified correctly.
• F1-Score = 2 ⋅ Precision ⋅ Recall/(Precision + Recall)
It is the harmonic mean between precision and recall, offering a balance between the two.
• ROC-AUC (Receiver Operating Characteristic - Area Under Curve) = ROC-AUC is determined by plotting the True Positive Rate (TPR) versus the False Positive Rate (FPR) at different thresholds. The AUC is the ROC-AUC score:

The ROC-AUC value is between 0 and 1 and measures perfect classification as 1 and random guess as 0.5.
Experimental setup
Our tests were performed on a machine which was equipped with Intel Core i7-8700K CPU, NVIDIA GeForce RTX 3080 GPU (10GB VRAM), and 32GB DDR4 RAM and came pre-installed with Ubuntu 20.04 LTS. The model was hosted using TensorFlow 2.x and Keras and Python 3.8. For our fivefold cross-validation, the training time per fold averaged around 45 min for a batch size of 32, yielding an overall training time of around 3.75 h for all of the folds. The models were trained up to 100 epochs with early stopping to halt training when validation loss does not improve for 10 consecutive epochs.
Results
In this section, the evaluation of the performance of the model by rigorous analysis of accuracy and loss curves, after which the assessment based on confusion matrices along with its parameters has been provided.
Accuracy and loss plots give an indication of how the model is learning over several folds in K-Fold cross-validation, showing how well the model is generalizing to the unseen data through monitoring training and test loss patterns. Confusion matrices give a better idea of how well the model classifies instances based on classes, reporting on the number of true positives, true negatives, false positives, and false negatives for every class. All these matrices yield key performance parameters like precision, recall, F1-score, and overall accuracy that help in an overall evaluation of the model's success in discriminating between pneumonia and normal cases in chest X-ray images
Accuracy and loss plots
Figure 3(a) illustrates the proposed model's performance using K-fold cross-validation, with the x-axis representing the fold number and the y-axis indicating the loss value. The two lines in the graph represent the train loss and test loss for each fold. In figure, both the train and test losses decrease significantly in the first few folds, suggesting that the model is learning effectively. However, the test loss appears to increase slightly after fold 3, which could be a sign of overfitting. Overall, the graph provides insights into the model performance across different folds of the data.

Plots (a) loss per fold and (b) accuracy per fold.
Figure 3(a) shows the Loss per Fold, with differentiation between training loss (blue line) and test loss (orange line). In the first fold, the training as well as test loss is quite high, signifying the beginning learning phase of the model. Most importantly, as the training continues into higher folds (from Fold 1 to Fold 2), there is a significant reduction in both training as well as test loss. This steep drop indicates effective learning and convergence of the model parameters. From Fold 3 onward, the training loss is steadily low and flat, touching the x-axis, indicating that the model is satisfactorily fitting the training data. At the same time, the test loss stabilizes at a very low rate, staying near zero. This consistent low test loss is a very good indicator that the model is generalizing extremely well to the unseen data in each fold, and that it is not showing any signs of extreme overfitting.
To complement the loss dynamics, Figure 3(b) plots the Accuracy per Fold. On the x-axis is the fold number, and on the y-axis the accuracy value, ranging from 0.960 to 1.000. The blue line represents the accuracy gained for every subsequent fold. There is a dramatic jump in accuracy from Fold 1 (around 0.960) to Fold 3 (almost 1.000), validating the model's swift and efficient learning path. Following Fold 3, the accuracy pretty much levels out at an extremely high rate (nearly 0.995 and higher), which suggests that the model has probably converged and reached its optimum performance level on this dataset with the given architecture and training protocol. The high consistency of accuracy over subsequent folds, together with the low and constant test loss in Figure 3(a), very highly indicates that the model is greatly robust and consistently makes predictions well over various partitions of the data. This trend as a whole supports that the model is very successful in learning the inherent patterns with little problem of overfitting or underfitting, exhibiting its great generalization ability for the present task.
Confusion matrix parameters
Figure 4(a)–(e) shows a set of confusion matrices that display the fine-grained classification performance of the introduced model for each of the five folds in the K-Fold cross-validation procedure for classifying chest X-ray images. Each of the matrices contains the actual labels along the y-axis (Normal, Pneumonia) and the predicted labels along the x-axis, with color depth indicating the count of cases.

Confusion matrix (a) Fold 1, (b) Fold 2, (c) Fold 3, (d) Fold 4, and (e) Fold 5.
Figure 4(a) for Fold 1 shows the baseline performance. The cell in the top-left corner is the True Negatives (accurately classified “Normal” instances), and the cell in the bottom-right corner is the True Positives (accurately classified “Pneumonia” instances). Misclassifications are represented by the off-diagonal cells: top-right is False Positives (Normal instances incorrectly classified as Pneumonia), and bottom-left is False Negatives (Pneumonia instances incorrectly classified as Normal). Looking at color intensity and the corresponding color bar, we note that in Fold 1, the model has already shown a robust ability to accurately classify “Normal” and “Pneumonia” instances, with darker blue squares along the main diagonal reflecting high numbers of true positives and true negatives. Nevertheless, the lighter colors in off-diagonal cells indicate a minor number of misclassifications still took place at this early stage.
Figure 4(b)–(e) for Folds 2, 3, 4, and 5, respectively, also show the improving consistency and outstanding performance of the model with advancing training. There is a definite trend of growing darker blue intensity in the diagonal cells and decreasing (or missing) lighter intensity in the off-diagonal cells in these subsequent folds. This means that the counts of true positives and true negatives consistently grow, whereas false positives and false negatives become extremely uncommon. For example, in Folds 3, 4, and 5, the true positive and true negative values are at their maximum (as pointed out by the consistently darker blue squares and higher points on their respective color bars), showing almost perfect classification for both “Normal” and “Pneumonia” classes. The minimal presence of off-diagonal errors in these later folds underscores the model's robust generalization and its ability to accurately distinguish between healthy and diseased lungs.
In general, the sequence of confusion matrices shown in Figure 4 visually substantiates the model's excellent capability to learn and classify pneumonia in chest X-ray images with great precision and accuracy, reducing misclassifications to a minimum in various subsets of the data. This visual is strongly substantiating the quantitative accuracy and loss measures illustrated in Figure 3, validating the model proposed for reliable use in diagnostic contexts.
The Table 2 gives the model performance metrics for a model tested in five folds with the most important metrics being accuracy, precision, and recall. Accuracy is the ratio of correct predictions made by the model, and for this model, it increases from fold to fold gradually. The highest accuracy is seen for Fold 5 at 0.9940, indicating the best performance of the model regarding correct overall predictions. This is followed by Fold 3 at 0.9920 and Fold 4 at 0.9930. These three folds show the model's growing capability to predict correctly as it moves through the training folds.
Foldwise confusion matrix results.

And as for precision, which determines the proportion of positive predictions that are actually correct, the model is also trended. The best precision remains in Fold 5 at 0.9960, meaning that when the model predicts a positive class, it is predominantly reliable. The second-best precision is in Fold 4 at 0.9950 and then Fold 3 at 0.9940. These three folds display a uniform improvement of the model to predict positively without generating many false positives.
Recall, or sensitivity, evaluates the ability of the model to pick up all the positive examples it ought to. The highest recall value is achieved in Fold 5 at a value of 0.9960, which also reflects the ability of the model to detect nearly all the positive examples in the data. This is followed by a recall of 0.9835 in Fold 2 and a recall of 0.9723 in Fold 1. These three folds highlight the increasing efficiency of the model in picking out positive instances as it goes through the training process. In general, the model performs well in all the folds, with Fold 5 having the maximum values for accuracy, precision, and recall, then Fold 3 and Fold 4. This indicates that the capacity of the model to classify both accurately and well improves with time as it learns from the data.
Figure 5 clearly displays the overall performance analysis of the proposed model on all five folds of the K-fold cross-validation method. The x-axis distinctly separates every fold (Fold 1 to Fold 5), and the y-axis, between 0.0 and 1.0, depicts the value for every performance measure. Each group of five bars for each fold symbolizes an important set of measures obtained from the confusion matrix: Accuracy (blue), Precision (orange), Recall (green), Specificity (red), and Sensitivity (purple). These measures play an important role in delivering a comprehensive insight into the capability of the model to accurately classify instances, especially in the case of the binary classification task of pneumonia detection.

Comparison of five folds on basis of confusion matrix parameters.
One of the most striking observations from this chart is the exceedingly uniform and high performance in all folds for Accuracy, Precision, and Recall. All three measures consistently reach values at or very close to 1.00 for each fold. This almost perfect correlation very strongly indicates that the model is extremely robust and its performance not at all heavily dependent on the particular data split within a fold, pointing towards superb generalization abilities. The high Accuracy means a solid overall rate of accurate predictions. The high Precision means an extremely low rate of false positives (if the model predicts pneumonia, it is nearly always correct), which is crucial in medical diagnosis to prevent unnecessary treatments or patient stress. The good Recall (also referred to as Sensitivity for the positive class) indicates the model performs well in detecting almost all true cases of pneumonia, keeping false negatives to a minimum, which is critical for early detection and timely treatment.
On closer examination, Specificity and Sensitivity show a little more fluctuation, but still within tolerable limits. Specificity (red bars), the percentage of actual negative cases (Normal) that are accurately classified, is typically high in all folds (for instance, approximately 0.60 in Fold 1, slightly lower in Fold 2, and then leveling out at 0.50 for Folds 3–5). Sensitivity (purple bars), or the same as Recall in this binary classification setting (being able to identify positive cases correctly), is always very high, nearly at 1.00, in all folds. The comparatively lower specificity in relation to accuracy, precision, and recall may mean that even though the model is superb at identifying pneumonia, there may be a slight inclination of misclassifying certain normal cases as pneumonia, as indicated by the slightly lower red bar in relation to the rest of the high-scoring metrics. Still, in the context of diagnosing pneumonia, it is preferable to have a greater recall (sensitivity) so that the very few actual cases of disease do not get missed even if at a bit of expense to specificity.
To sum up, Figure 5 presents strong evidence that the proposed model always performs exceptionally well on all the relevant measures, especially Accuracy, Precision, and Recall, indicating its excellent capability to separate “Normal” from “Pneumonia” classes. While Specificity is relatively lower, its value in the clinical scenario remains significant in that failing to miss an actual pneumonia case (low recall/sensitivity) is more risky than getting a false positive. This strong and stable performance under varied subsets of data supports the efficacy of the model and its potential use for sound generalization in unseen chest X-ray diagnoses. Further investigation could examine methods to tune sensitivity and specificity balance, perhaps by modifying the classification threshold, if the use case requires even greater specificity.
State-of-art comparison
Table 3 shows different medical image classification model studies, highlighting their methodologies, the number of total image datasets utilized, and their achieved results. All these studies utilized different methods including CNNs, transfer learning, and other different architectures including VGG19, MobileNet, and ResNet50. Ghandour's (2024) study used a combination of the CNN models and an XGBoost classifier on the ChestXray dataset with outstanding outcomes. This model had an accuracy rate of 99.15%, precision of 99.53%, and an AUC of 0.9972%. In Manickam's 2021 study, a combination of the deep learning and transfer learning models was applied on a database of 5300 images. The model was 93.06% accurate, which is indicative of a good performance, although not as great as some of the other models in the table. The use of deep learning and transfer learning techniques highlights the approach to utilizing pre-trained models to enhance performance on medical image classification tasks. Harshvardhan (2021) used a CNN model on a database of 4264 images and achieved an AUC of 0.9582%. This AUC score indicates the model's relatively good ability to discriminate between classes, but the absence of accuracy values indicates that the model's performance would need to be assessed again against other measures like precision or recall. Finally, the proposed model has achieved 99.40% and then 99.60% on fold 5. In short, the experiments within the table employ a wide variety of techniques and architectures and each exhibits different levels of success in medical image classification.
Comparison with state-of-art.

CNN: convolutional neural network; AUC: area under the curve.
Discussions
The model showed a good learning trend, which could be seen in the training and validation loss graphs. The application of SGD resulted in stable optimization of model parameters. The early stopping technique also worked well to avoid overfitting. The data augmentation techniques helped the model generalize further. The k-fold approach ensured that the performance of the model was less biased towards specific set of data. The loss and accuracy values obtained through k-fold cross-validation reflect the stability of our proposed model. The findings demonstrate the potential of machine learning in medical diagnosis. Our proposed methodology solves some major issues in lung disease classification, such as overfitting and dataset constraints. The employment of K-Fold cross-validation and data augmentation proves reliable results and results that are generalizable. Dropout layers also make the model more stable by lowering the chances of overfitting.
Table 3 is used to compare the suggested stochastic-based learning model with a list of existing state-of-the-art approaches to pneumonia diagnosis on chest X-ray images. Surprisingly, the suggested model achieved a 99.40% accuracy that surpassed all existing methods in the list. Such high accuracy demonstrates the ability of the stochastic-based learning technique to efficiently classify pneumonia conditions. Ghandour et al. 8 proved excellent performance with an accuracy of 99.15%, precision of 99.53%, and AUC of 0.9972, stressing the effectiveness of blending CNN models with an XGBoost classifier. Hashmi et al. 18 used ResNet50 to report an excellent accuracy of 98.14%. Trivedi et al., 14 using MobileNet, reported excellent accuracy of 97.34%. Gupta et al., 16 based on Neural Architecture Search, registered an AUC of 97.6%. Conversely, Manickam et al. 12 employing the combination of deep learning and transfer learning, recorded an accuracy of 93.06%, whereas Dey et al. 13 and Jain et al. 15 both of whom employed VGG19, recorded lower accuracies of 86.97% and 88.46%, respectively. These differences in performance underscore the influence of various methodologies and model architectures on the accuracy of pneumonia detection. The persistent outperformance of the proposed model on all metrics of accuracy resolutely solidifies its potential to be an exceptionally useful tool in medical image analysis for the purpose of diagnosing pneumonia.
This study successfully developed and validated an efficient CNN-based stochastic deep learning model for automatic pneumonia diagnosis from chest X-ray images. The model showed good pneumonia diagnosis, with consistent performance on K-folds, indicating its reliability. One of the strongest aspects of the research is methodology, as it brought together stochastic deep learning methods, the Adam optimizer, early stopping, K-fold cross-validation, and data augmentation to improve model efficiency and generalization. Particularly relevant was that the model was compatible for training on small sets by optimizing iterative loss functions and processing in mini-batches. In addition, the research prioritized clinical utility by detailing plans for a user-friendly interface and multi-class classification to support adoption in the real world. The dedication to interpretability through the inclusion of explainable AI methods reflects a concern with respecting the trust of medical professionals. Lastly, the forward-thinking approach to the study, including investigating more complex architectures and optimizers, supports the model's ongoing relevance in the evolving medical imaging technology sector.
The very encouraging performance metrics exhibited in Figures 3–5 have important clinical significance for the diagnosis of pneumonia. Pneumonia is still a significant international health problem, ranking as the fourth most frequent principal pathologic diagnosis for U.S. hospital admissions and a main cause of death, especially among children under 5 years of age. Chest X-rays have long been considered the first-line imaging study for the diagnosis of pneumonia because they are readily available and inexpensive, even though classic human interpretation is at times subject to problems like diagnostic doubt or inconsistency in sensitivity (32% to 77.7%) and specificity (58.8% to 94%) in previous studies.
Our model's accuracy of 0.9940 and precision of 0.9960 (as observed in Fold 5, and throughout all folds in Figure 5) are a significant improvement over standard diagnostic method. In a medical environment, having such high precision translates to having an extremely high chance that the diagnosis is accurate whenever our model detects a patient with pneumonia, thereby having very low chances of false positives. This reduces unnecessary antibiotic treatment orders, additional tests, and patient worry.
In addition, the uniformly high Recall (Sensitivity) in all folds (uniformly close to 1.00 in Figure 5) is highly significant in diagnosing pneumonia. Since pneumonia can quickly worsen and result in serious complications if not treated in time, high sensitivity guarantees that few true pneumonia cases are overlooked (i.e. low false negatives). This ability indirectly leads to faster detection and timely treatment, which are most crucial for enhancing patients’ outcomes as well as minimizing morbidity and mortality related to the disease. The good performance of the model in detecting true positive cases can be of great benefit to clinicians, particularly in high-volume practice or where specialized radiological skills are not readily available.
Although the Specificity (proper identification of normal cases) is similarly high, it seems to be slightly lower than other values in some folds (e.g. approximately 0.50–0.60 in Figure 5). In the clinical case of pneumonia, a marginally lower specificity, suggesting a slightly higher proportion of false positives over false negatives, is commonly clinically acceptable. This is because the cost of failing to detect an actual case of pneumonia (a false negative, mitigated by high recall) tends to be worse than the cost of incorrectly labeling a non-pneumonia as a pneumonia (a false positive, which can be followed up by a clinician). The high sensitivity of the model would enable quick screening and flagging of possible cases, which can then be filtered and assessed clinically, minimizing delays in diagnosis and making sure that needy patients receive quick attention.
In conclusion, our deep learning model's outstanding and consistent performance metrics, especially its high precision, recall, and accuracy, reflect its profound potential as a trust-worthy computer-aided diagnostic tool in practical clinical practice. Through the highly accurate and timely analysis of chest X-rays, this model has the potential to enable healthcare professionals to make better-informed decisions, automate diagnostic processes, and ultimately lead to better patient management and a lessened disease burden of pneumonia.
The paper delivers an extensive complexity analysis of the suggested deep model for pneumonia diagnosis that looks into both computational (time) and spatial (memory) complexities. In training, the computational complexity is mainly dictated by the architectural components of CNN (convolutional, pooling, and fully connected layers), all contributing to a cumulative complexity during forward and backward passes. Although the Adam optimizer incurs a per-parameter overhead, it frequently speeds up training overall by lowering the number of epochs needed. Data augmentation, while typically quick, incurs an additional per-image processing time, and the K-fold cross-validation necessarily multiplies the total training time by the number of folds. Spatially, memory requirements are dominated by the trainable parameters of the CNN, storing intermediate feature maps (activations) during backpropagation, and the internal state of the optimizer. Once trained, however, the model provides very efficient inference with only one forward pass, which is ideal for fast clinical use. The study concludes that the approach is well-balanced between requiring intricate modeling and computational tractability, making use of stochastic optimization along with meticulous hyperparameter adjustment.
Conclusion
This work successfully formulated and evaluated an effective CNN-based stochastic deep learning model for automated pneumonia diagnosis from chest X-ray images. Our approach effectively integrated stochastic deep learning methods, the Adam optimizer, early stopping, K-fold cross-validation, and extreme data augmentation, greatly improving both model effectiveness and generalization. Principal findings reliably exhibited enhanced pneumonia diagnostic accuracy across K-folds, highlighting robust model performance. We discovered that iterative loss function optimization and mini-batch processing were especially well-adapted for training our model, even with fairly modest datasets.
Although our model appears to demonstrate great potential, we recognize certain limitations that are major areas of potential future advancement. The present study was based on a particular dataset; hence, external validation on larger and more diverse datasets covering different clinical sites will be vital to establish its generalizability as well as robustness across patient populations and imaging protocols. Furthermore, investigating external validation using entirely new data will be important to evaluate its applicability in real-world settings.
Looking forward, our immediate future efforts will be dedicated to maximizing the generalizability of the model using larger, more varied datasets. We will also explore more intricate CNN structures, stronger optimization methods, and incorporating attention mechanisms into the model to possibly better capture subtler diagnostic features. To enable clinical translation, we foresee creating user-friendly interfaces for real-time application. In addition, we intend to enhance the clinical application of the model with multi-class classification for the detection of other lung conditions. We will also emphasize interpretability in our models with the use of explainable AI (XAI) methods, which is crucial towards building trust and acceptance among clinicians. Lastly, we will continue to explore building hybrid architectures and use future optimizers in order to maintain our model at the cutting edge of medical imaging technology for better patient outcome.
Limitations and future directions
Although this research illustrates a strong and very efficient deep learning model to diagnose pneumonia automatically from chest X-ray images, it is important to recognize inherent limitations and suggest directions for future research. One major limitation arises from the specificity and limited size of the dataset; while internal consistency was validated using K-fold cross-validation, additional validation on larger, more heterogeneous external datasets with different patient populations and imaging protocols is needed to establish its real-world applicability. The use of binary classification (Normal vs. Pneumonia) also limits its clinical use, given that pneumonia is part of a larger spectrum of lung diseases. In addition, the lack of external validation on fully independent datasets, coupled with the intrinsic “black-box” nature of deep learning models, complicates ultimate clinical usability and acceptability. Future effort will thus focus on extensive validation across much larger and more heterogeneous multi-center datasets, as well as prospective clinical trials to determine real-world effect. We also intend to generalize the model for multi-class classification for an extensive differential diagnosis of different lung pathologies. For easing clinical uptake and confidence, the incorporation of Explainable AI (XAI) methods will be essential for interpreting the decision-making process of the model. Last but not least, we will further delve into deep CNN architectures, transformer-based or hybrid models, and advanced optimization methods, while also emphasis on creating easy-to-use interfaces for clinical integration and examining the potential of the model for longitudinal analysis and prognostic significance by using auxiliary clinical data. In future, we will also utilize hybrid models with other machine learning methods.