
Abstract
Objective
Based on the current research status, this paper proposes a deep learning model named Covid-DenseNet for COVID-19 detection from CXR (computed tomography) images, aiming to build a model with smaller computational complexity, stronger generalization ability, and excellent performance on benchmark datasets and other datasets with different sample distribution features and sample sizes.
Methods
The proposed model first extracts and obtains features of multiple scales from the input image through transfer learning, followed by assigning internal weights to the extracted features through the attention mechanism to enhance important features and suppress irrelevant features; finally, the model fuses these features of different scales through the multi-scale fusion architecture we designed to obtain richer semantic information and improve modeling efficiency.
Results
We evaluated our model and compared it with advanced models on three publicly available chest radiology datasets of different types, one of which is the baseline dataset, on which we constructed the model Covid-DenseNet, and the recognition accuracy on this test set was 96.89%, respectively. With recognition accuracy of 98.02% and 96.21% on the other two publicly available datasets, our model performs better than other advanced models. In addition, the performance of the model was further evaluated on external test sets, trained on data sets with balanced sample distribution (experiment 1) and unbalanced sample distribution (experiment 2), identified on the same external test set, and compared with DenseNet121. The recognition accuracy of the model in experiment 1 and experiment 2 is 80% and 77.5% respectively, which is 3.33% and 4.17% higher than that of DenseNet121 on external test set. On this basis, we also changed the number of samples in experiment 1 and experiment 2, and compared the impact of the change in the number of training set samples on the recognition accuracy of the model on the external test set. The results showed that when the number of samples increased and the sample features became more abundant, the trained Covid-DenseNet performed better on the external test set and the model became more robust.
Conclusion
Compared with other advanced models, our model has achieved better results on multiple datasets, and the recognition effect on external test sets is also quite good, with good generalization performance and robustness, and with the enrichment of sample features, the robustness of the model is further improved, and it has better clinical practice ability.
Introduction
Coronavirus disease 2019 (COVID-19) is a highly contagious disease caused by severe acute respiratory syndrome coronavirus 2 (SARS-CoV-2). 1 The first and most devastating global health crisis of the twenty-first century was caused by the novel coronavirus pneumonia. 2 The health crisis sent shockwaves through the global economy, 3 severely reducing the quality of life of many. COVID-19 affects the respiratory system and other organs and has a wide range of local and systemic clinical manifestations 4 that can cause cardiovascular injury and mental complications.5,6 The rapid development and deployment of a vaccine against the virus (SARS-CoV-2) was an unprecedented scientific achievement, 7 and rapid vaccination has controlled the health crisis. However, vaccines may cause uncontrollable side effects in people with other diseases 8 and vaccination coverage is less than perfect. 9 Identifying patients with COVID-19 quickly is an urgent matter. Rapid and accurate detection of highly infectious lung diseases is of great significance for controlling the spread of diseases and allocating hospital resources effectively. Reverse transcription polymerase chain reaction (RT-PCR), a commonly used assay, can take a few hours to 3 days to obtain results. 10 In addition, studies have found that multiple RT-PCR tests performed on the same patient at different times may have different results, resulting in a high false-negative (FN) rate 11 and cannot completely rule out the possibility of infection. Chest X-rays (CXRs) and computed tomography (CT), two medical imaging technologies used to diagnose COVID-19, have shown excellent results. Cheaper and faster than CT, CXRs are used for early screening of patients with acute respiratory distress syndrome who are currently showing COVID-19 symptoms. 12 However, manually reading a CXR requires expertise, is time-consuming, and is error-prone. 13
With the development of artificial intelligence, the use of deep learning technology to diagnose diseases is expected to become an effective means of rapid diagnosis and accurate identification of disease. Machine learning (ML), artificial neural networks (ANN), and deep learning (DL) are all topics of artificial intelligence, essentially training models through data analysis to help them improve their decision-making ability and their ability to perform corresponding tasks, such as data classification. 14 In the medical field, these technologies are used to improve the speed and efficiency of disease diagnosis and treatment. In medical image analysis, DL method has a good agreement with radiologists on the detection results of chest medical images, and has a wider application field. Using deep learning methods to help doctors read and understand medical images has become an area of growing interest for researchers.15–19
During the epidemic period, many researchers have used the DL method to carry out COVID-19 identification experiments, but these experiments20–24 generally have problems such as unbalanced sample distribution of data sets, monotonous sample distribution, insufficient identification accuracy, and poor model robustness. The generalization performance of the model has not been comprehensively evaluated, and its generalization performance cannot be effectively verified. Wang et al. 20 proposed a lightweight network, Vid-Net, and created a three-class CXR dataset, COVID, containing data from 13,870 patients, but the network was not tested on an external test set and its generalization performance was not evaluated. Liu et al.21 proposed a multi-scale residual attention (MCRA) network for COVID-19 detection. The network was evaluated on three classified COVID-19 datasets with a classification accuracy of 97.71%, but it was only tested on one dataset with highly unbalanced sample distribution. The performance of the network on data sets with other sample distributions is not evaluated, which is one-sided. Wang et al. 22 proposed an integrated model COVIDX-LwNet for three-classification identification of COVID-19, but its recognition accuracy is not high enough, only 95.56%. Singh et al. 23 proposed a three-classification method for COVID-19 identification through U-Net network segmentation and CONV-CAPS. However, its recognition accuracy on the test set is low, and the network overfitting is serious. Fan et al.24 proposed a double-ended multiple attention learning model (DMAL), which integrates multiple attention learning into two networks and connects the two networks with an integrated module, achieving a good recognition accuracy in model recognition. However, the author did not evaluate the generalization ability of this model. At the same time, most of the models proposed by researchers for the identification of COVID-19 have the problem of heavy computing load and many parameters, and in the actual clinical application process, the computing resources of hospitals may be limited, and the excessive demand for computing resources is not conducive to the actual clinical deployment and real-time use of hospitals.
In this paper, to address the above problems, we propose a DL-based network framework, which we call Covid-DenseNet, for automatic detection of COVID-19 from CXR. We evaluated the performance of the proposed model on three common datasets: balanced, unbalanced, and small. We use transfer learning to extract features at different scales from input images and assign the internal weights of the extracted feature maps via the attention module. The feature map after weight assignment is input into the multi-scale fusion module for feature fusion, and finally the classification of COVID-19 detection is obtained. We used Grad-CAM 25 to verify the interpretability of Covid-DenseNet. We also conduct a comprehensive evaluation of the model on an external test set and investigate the effect of changes in the number of training set samples on the model's recognition accuracy on an external test set.
The main contributions of this study are as follows.
A DL network framework for COVID-19 diagnosis is proposed that can extract key features from CXRs to yield superior identification and classification results. A multiscale fusion architecture is designed to fuse CXR features at multiple scales. In feature fusion, the architecture can reduce the number of feature channels while preserving key feature parameters. In addition, 1 × 1 convolution and concatenation were used multiple times to integrate information across channels, thus reducing the loss of key information in feature fusion. In the network framework design, our model's performance evaluation extends beyond a single dataset, encompassing three public datasets with varying characteristics to demonstrate the model's robustness and the advantage of using the Grad-CAM algorithm.
The rest of this paper is organized as follows. The next section reviews related work, the section following the next outlines our model's structure, The penultimate section reports the experimental results, and the final section summarizes our study's findings.
Method
Proposed model framework
To develop a robust and computative model suitable for practical clinical applications, an efficient deep CNN diagnostic framework and multi-scale feature fusion architecture are proposed in this section, and the proposed model network structure is shown in Figure 1. First, DenseNet121, 26 pretrained on the ImageNet dataset, was fine-tuned on the target dataset, and the feature maps f1–f4 of multiple scales were extracted. Then, the extracted feature maps were input to the attention module for the internal weight allocation of the feature maps, and a multiscale feature fusion architecture was designed for feature fusion of the feature graphs with the internal weight distribution. The fused feature maps were integrated through a convolutional layer and then input to the classifier to create three CXR classifications: COVID-19, pneumonia, and normal.

Network framework of the proposed COVID-DenseNet model.
Feature extraction module
Each layer of DenseNet121 receives feature mappings from all previous layers, not just adjacent layers, and enables feature reuse through feature connections on channels. The feature reuse design allows DenseNet121 to require fewer parameters than traditional convolutional neural networks, improving information flow and gradient. Reduce model overfitting merging and maintain high model accuracy. In the diagnosis of lung diseases, DenseNet121 has a good performance. For example, Karthik Kantipudi et al., 27 in the diagnosis of tuberculosis, the model based on DenseNet121 has better performance than the model based on YOLOV5n. Rupali Vyas et al. 28 used a combination of deep learning and machine learning classifiers to classify and identify pneumonia, in which DenseNet121 combined with machine learning classifiers achieved the best recognition accuracy. Taking DenseNet121 network architecture as the feature extraction layer of model COVID DenseNet is conducive to obtaining better feature extraction capability.
In deep learning, since the model parameters are randomly initialized, training the model from scratch in the target domain can incur high learning costs. Transfer learning can deal with this problem. Transfer learning can apply the knowledge learned from one task to another related task, namely the source domain (usually an already trained model or data set) and the target domain (usually a new task we wish to solve), by using the knowledge of the source domain to improve the learning effectiveness of the target domain. Transfer learning can be divided into several different methods, including feature extraction, model fine-tuning, domain adaptive, etc. In transfer learning, we extract the important features of the target domain through model fine-tuning.
We use transfer learning to fine-tune the ImageNet pre-trained DenseNet121 on the target dataset as the feature extraction module of the model. By adopting DenseNet's dense connection structure, the network can extract more feature information as much as possible, integrate the information of the front and rear feature layers, improve the performance of the model on the target task to a certain extent through transfer learning, accelerate the convergence process of the model in the target domain, and improve the training efficiency.
Coordinated attention module
Coordinate attention mechanism 29 is proposed in CVPR2021. This module summarizes the features of input information horizontally and vertically to obtain a pair of directional perception feature maps, thus effectively capturing the relationship between different positions in the captured image. The structure chart is shown in Figure 2. It is usually calculated using dot products or other similarity measures, and then the attention weight of each position is calculated according to the similarity, and the value vector is weighted and summed according to these weights to get the final attention output. Coordinate attention can help the model to weight the information of different positions in the image, so that the model can pay more attention to important areas or features in the image. By introducing coordinate information, the model can pay more attention to local features of different positions in the image, so as to better capture the subtle differences and feature changes in the image. By helping the model automatically learn the importance of different locations in the image, it reduces the influence of redundant information and improves the efficiency and performance of the model.

Coordinate the structure of attention mechanism.
Coordinate attention mechanism in image classification can improve the perception and utilization of the position information in the image, so as to help the model to classify more accurately. In addition, the coordinated attention module is lightweight and flexible, and does not increase the network burden. It can capture the key information of features well and improve the network performance.
Multiscale fusion module
This study developed a multiscale feature fusion architecture, as shown in Figure 3. The four extracted feature maps f1–f4 have different scales and are passed through a two-dimensional convolution layer with 128 channels and 1 × 1 convolution kernel size. Through this step, information can be interacted with and integrated across channels, and the purpose of dimensional reduction and valuable information retention can be achieved.

Multiscale feature fusion module.
Feature map f1 is convolved and then maximally pooled to 28 × 28, which is spliced with the convolved feature map f2. Then, the spliced feature layer is convolved by 1 × 1 to integrate feature information of various scales. Similar operations are performed on feature maps f3 and f4; in this way, we can retain important information and remove redundant information. To ensure the integrity of information, the feature dimensions of convolved feature maps f3 and f4 are upgraded.
Based on the architecture, the inter-channel information of the same scale and the channel information between feature maps f1–f4 can be integrated through operations such as the size, concatenation, and convolution of the same feature map to enrich the feature information.
Classifier
The structure diagram of the classification module is shown in Figure 4. For the Covid-DenseNet model, we made the following modifications to the classifier. Compared with the DenseNet121 model, which uses global average pooling and a dense layer, our classifier has additional dropout and dense layers. The dropout layer was set to ignore node values and reduce the occurrence of overfitting. A dense layer with an output dimension of 64 was added to capture more associations between features.

Classification module.
Experiment
The experiment was divided into three stages. The first phase involves building our model on a baseline dataset. The second stage verifies the robustness of our model by evaluating other data sets. Finally, the third phase evaluates the performance of the model on an external test set.
Dataset
To better evaluate the robustness and generalization ability of the proposed model in this study, experiments were conducted on three publicly available datasets without any screening of the datasets. These three datasets were created by researchers who collected data from publicly available sources, and patient-specific information was withheld. Among them, the COVID-QU-Ex dataset 30 and the COVID19-Pneumonia-Normal-Chest-Xray-PA dataset 31 are publicly available on Kaggle. The COVIDx dataset 20 adopted is the version publicly released on GitHub in November 2021.
We used the COVID-QU-Ex dataset as the benchmark. We used only the original undivided lung images of this dataset, and the dataset partition we used was the original partition. The ratio of training, validation, and test sets was 6:2:2. And we divided the COVIDx dataset into training, validation, and test sets (patient IDs did not cross) with a ratio of 6:2:2, and we performed fivefold cross-validation on the COVID19-Pneumonia-Normal-Chest-Xray-PA dataset and extracted 10% of the data from the training set to use as the validation set.
The categories and number of images in these three datasets are shown in Tables 1–3. Figure 5 shows sample images in the dataset. The three datasets are identified for convenience: D1, D2, and D3. When evaluating the model performance on external test sets, in order to evaluate the model performance more intuitively, we selected some samples from data sets D1′ and D2′ respectively to form new data sets D1′ and D2′, which will be introduced in detail in section Model performance evaluation on an external test set.

Data samples: (a) D1, (b) D2, and (c) D3.
COVID-QU-Ex dataset (D1).

COVIDx dataset (D2).

COVID19 pneumonia normal chest X-ray PA dataset (D3).

Evaluation metric
This experiment used accuracy, sensitivity, specificity, precision, and F1-score as indicators of the model's performance.
Accuracy is an important index for evaluating the classification effect of medical image classification models, and its formula is shown in the following equation:
Sensitivity represents the ability to predict positive samples. The larger the sensitivity value, the more accurate the type of chest radiographs to be predicted. The formula is shown as follows:


Experiment settings
Software environment: operating system, Windows 11; Programming language, Python 3.7; and DL framework, Tensorflow-GPU2.5.0.
Hardware environment: CPU, Intel Core i9-12900; GPU, NVIDIA RTX 3090 (video memory, 24 G); and RAM, 32 G.
The optimizer is Adadelta, 32 an extended version of AdaGrad. It adjusts the learning rate according to the moving window of the gradient update and sets the initial learning rate to 1.0, the attenuation factor to 0.95, and fixed parameters to random seeds. The loss function is the focus loss. 33 In addition, we adjust the size of the input image to 224 × 224 and the batch size to 16 and set the epoch for D1–60, D2–30, and D3–40. In the experimental evaluation of model performance on the external test set, the epoch on the datasets D1′ and D2′ was set to 60, while other parameters were kept consistent with those used earlier.
Results
Experimental results on the benchmark dataset D1
In this stage, we constructed our model based on D1. After pre-training on the ImageNet dataset, DenseNet121 was used as the backbone model for experiments involving the attention module and the designed multi-scale fusion architecture. We compared our model with similar current classification models.
Other selected models were pretrained on the ImageNet dataset and then fine-tuned on D1. The image input size is also 224 × 224 × 3, and other experimental settings were identical. The experimental results are shown in Table 4 and Figure 6.

Training performance plots.
Experimental results on D1 (various categories).

As can be seen from Table 4, our model Covid-DenseNet has the highest recognition accuracy on the test set, outperforming other models in recognizing COVID-19 and normal categories, and only slightly lagging behind ResNet101 in pneumonia recognition.
The training performance of the model is shown in Figure 6, where the blue curve represents the training curve of our model. Although the convergence rate is not the fastest, our model outperforms others on the verification set.
Figure 7 illustrates the confusion matrix of the model on the test set, which is used to evaluate the classification performance of each model on the test set. The main diagonal of the confusion matrix represents the number of correct classifications of the model in each category on the test set. As can be seen from Figure, our model correctly predicted 2731 cases of COVID-19, 2048 cases of normal status, and 2158 cases of pneumonia. Only in the prediction of pneumonia was the number of correctly predicted cases lower than that of ReseNet101 and DenseNet121, but the numbers of correctly predicted COVID-19 cases and normal cases were higher than those of other models. The accuracy of COVID-19 prediction was higher than that of other models, and only 24 cases were mistaken as non-COVID-19, which is lower than the misjudgment rate for other models. Our model thus had fewer FNs.

Confusion matrix: (a) MobileV2, (b) EfficientNetB0, (c) ResNet50, (d) ResNet101, (e) DenseNet121, and (f) COVID-DenseNet (ours).
We also compared it to a network specifically designed to identify COVID-19 from these three categories, and the experimental results are shown in Table 5 and Figure 8. As can be seen from Table 5, flop of our model is relatively small, and the recognition accuracy is the highest on the test set. Compared to existing networks specifically designed to identify COVID-19 from three categories, our model has the best performance metrics across all categories on the external test set.
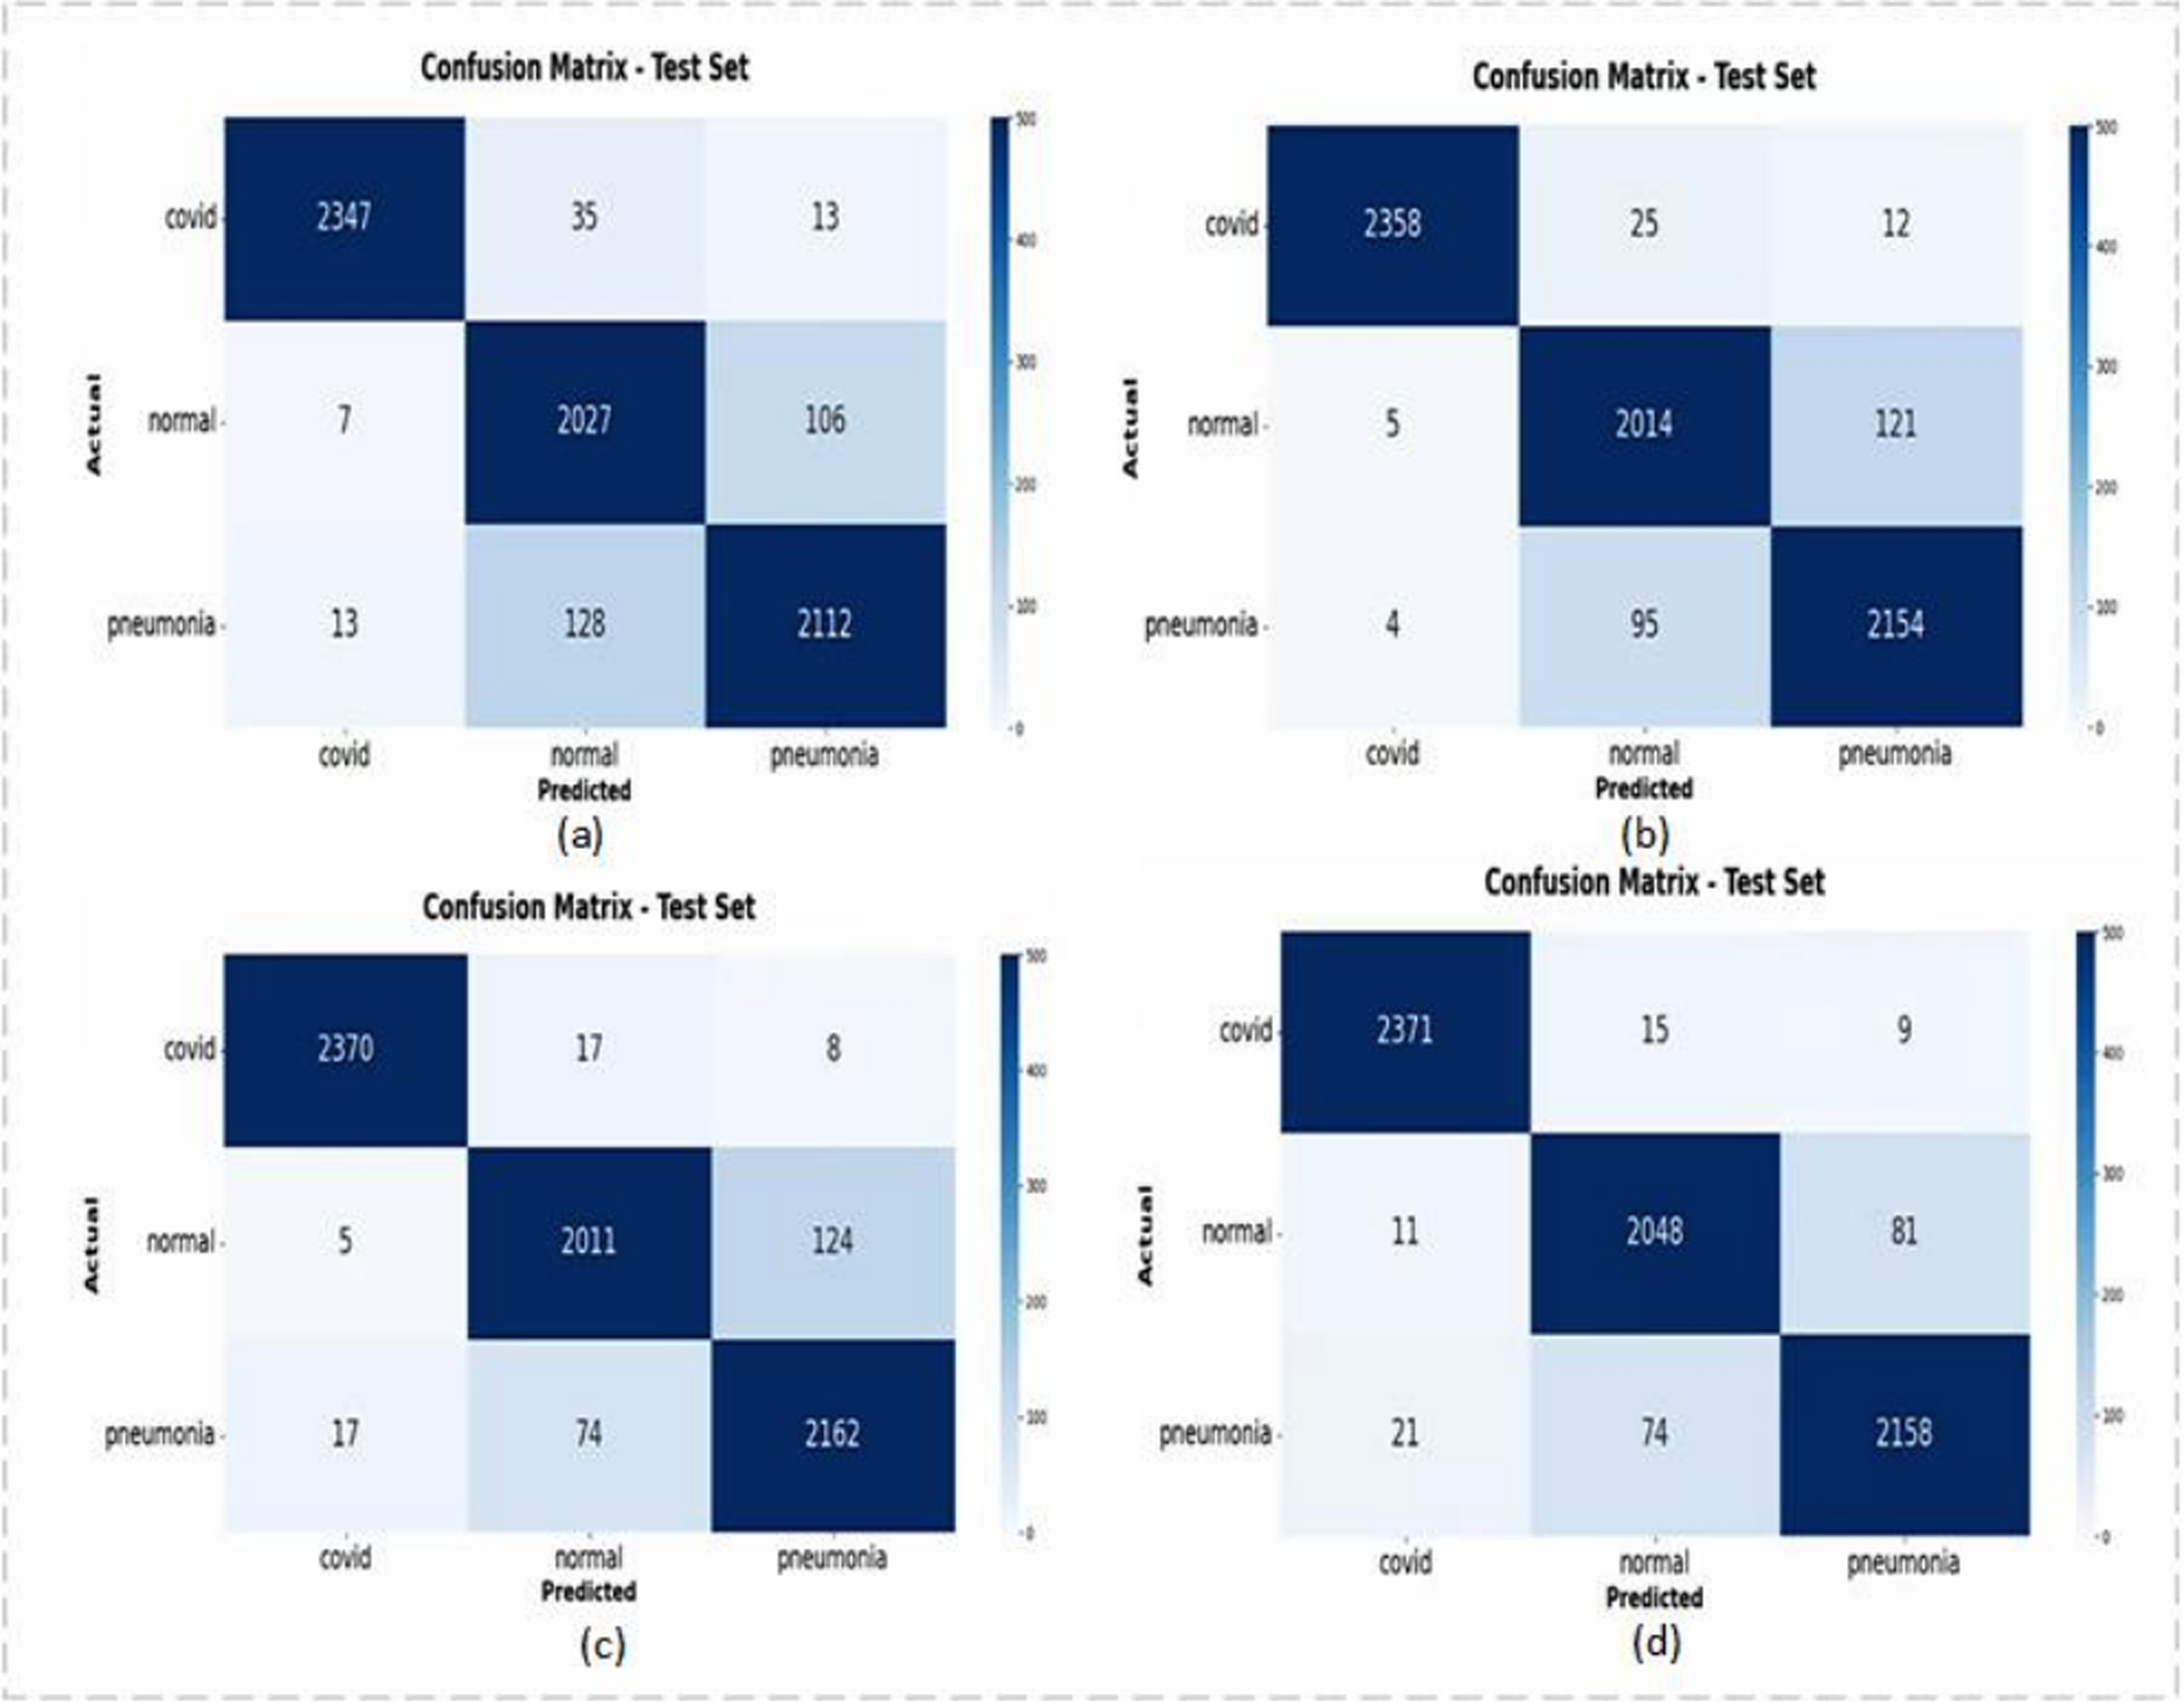
Confusion matrix: (a) INASNET, (b) DFFCNet, (c) ResNet-50 + MCRA, and (d) COVID-DenseNet (our).
Experimental results on D1.

As can be seen from Figure 8, our model Covid-DenseNet has the best recognition effect on normal and common pneumonia, and correctly identifies the largest number of COVID-19 samples.
Experimental results on D2 and D3
Experiments were conducted on D2 and D3 to verify the robustness and generalization of our constructed model.
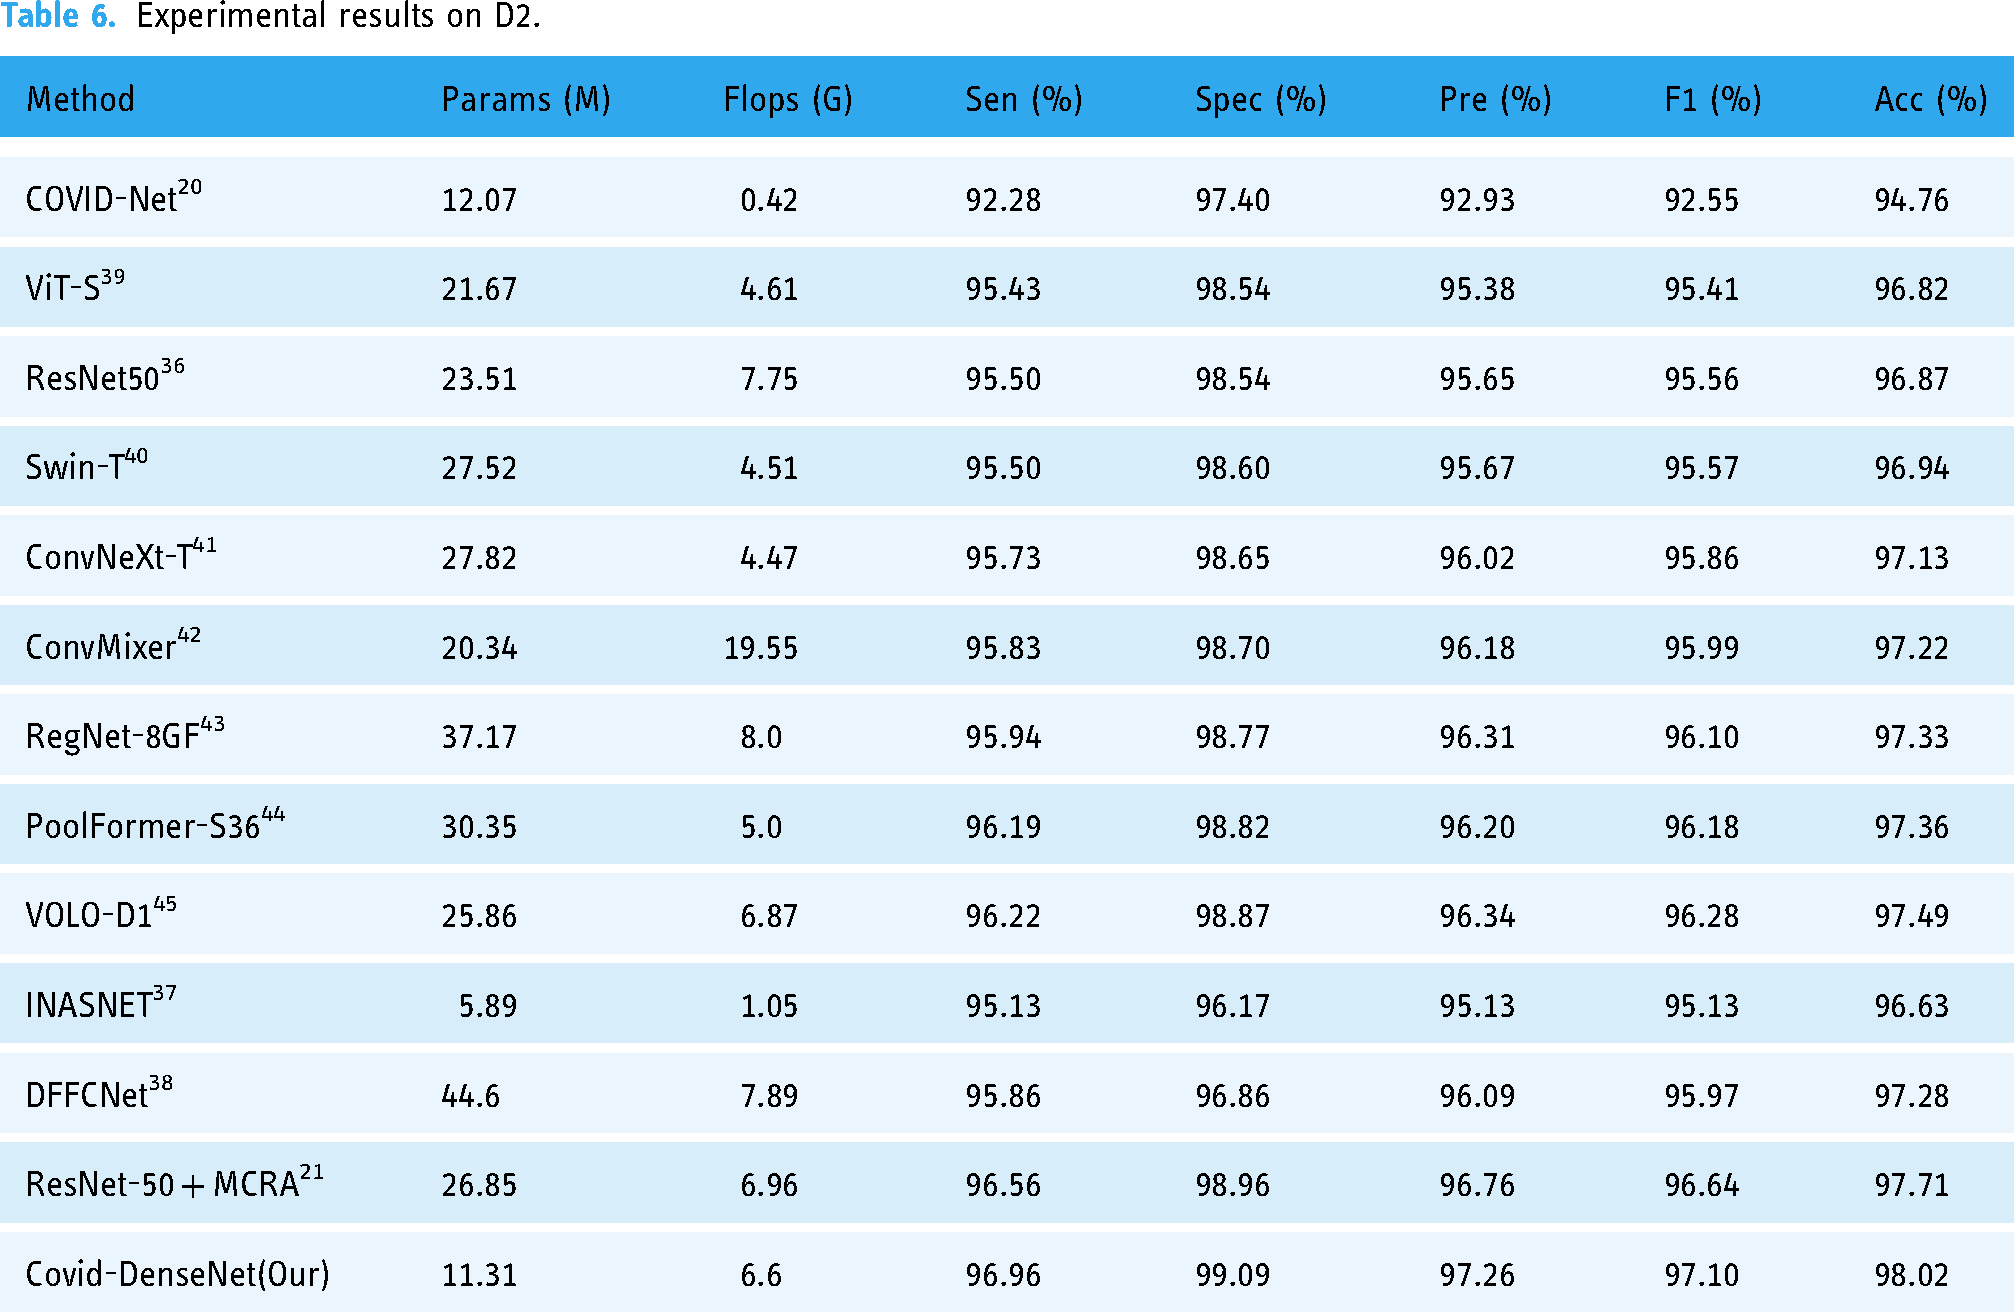
Table 6 lists the experimental results for our model and the current DL model on D2. Although the sample distribution of D2 is extremely unbalanced, with the total ratio of COVID-19, normal, and pneumonia samples being 6:3:2, our model still demonstrates excellent classification ability on D2. As shown in Table 6, our model uses a small number of parameters, only 11.31 M, and the calculation of Flops is medium. However, the value of each performance index reaches its optimum, which means that our model has the best accuracy and sensitivity for coronavirus detection.
Experimental results on D2.
D3 has a small number of samples and is a small dataset, but our model still has an excellent classification effect on this dataset. Table 7 presents the experimental results of our model on D3 and a comparison with current methods on this dataset. In the experiment, the method 22 divides the same dataset proportionally. The training is also conducted through fivefold cross-validation, and the average of the five results is recorded in Table 7. As can be seen from Table 7, the experimental results of our model on D3 also exceed those of the most advanced methods of experiments on this dataset with excellent results.
Experimental results on D3 (fivefold cross-validation).

Model performance evaluation on an external test set
We evaluated our model's performance on datasets D1–D3, demonstrating superior pneumonia classification recognition capabilities compared to most state-of-the-art approaches. When trained and tested on multiple datasets, the model exhibited robust generalization ability. During internal testing within the dataset, we shuffled the dataset and generated an independently sourced dataset denoted as an external test set. We compared the model's performance metrics on this external test set to further evaluate its generalization performance.
In order to ensure the accuracy of the experiment, we traced the source of the samples in the dataset and found that some samples in the D3 dataset duplicated D1 and D2, so we created the dataset D4, including 240 samples from D3, 80 samples of each type. The sample sources in D4 are different from those in datasets D1 and D2, which guarantees the authenticity of our experimental results. This phase involved two parts. First, we trained the model on datasets D1′ and D2′, and then evaluated its performance on the external test set to explore the influence of the sample category distribution balance of the dataset on the model performance on the external test set and compared generalization performance with the DenseNet121, INASNET, DFFCNet and ResNet-50 + MCRA. Second, we varied dataset sample sizes used for the Covid-DenseNet network to assess their impact on model performance using the external test set.
In the experiment, DenseNet121 and Covid-DenseNet parameters were set identically. Set the image input of INASNET, DFFCNet, ResNet-50 + MCRA to 224 × 224 × 3, and keep other parameters unchanged.
Performance on an external test set
To further evaluate Covid-DenseNet's performance, we substituted the test set in the dataset with an external test set: dataset D4. Table 8 displays the training, validation, and test sets utilized in the experiments.
Combinations of experiments on the external test set.

In Experiment 1, the training and validation sets from D1 were employed, with 18,318 randomly selected samples from the training set forming dataset D1′, still maintaining a balanced sample distribution and substituting the sample data in the test set with D4. For Experiment 2, we adopted the same approach but employed D2 for model validation, randomly selecting 5417 samples from the validation set to form dataset D2′. By comparing the results of Experiments 1 and 2, we investigated the impact of sample category distribution balance of the adopted datasets on model performance using the external test set.
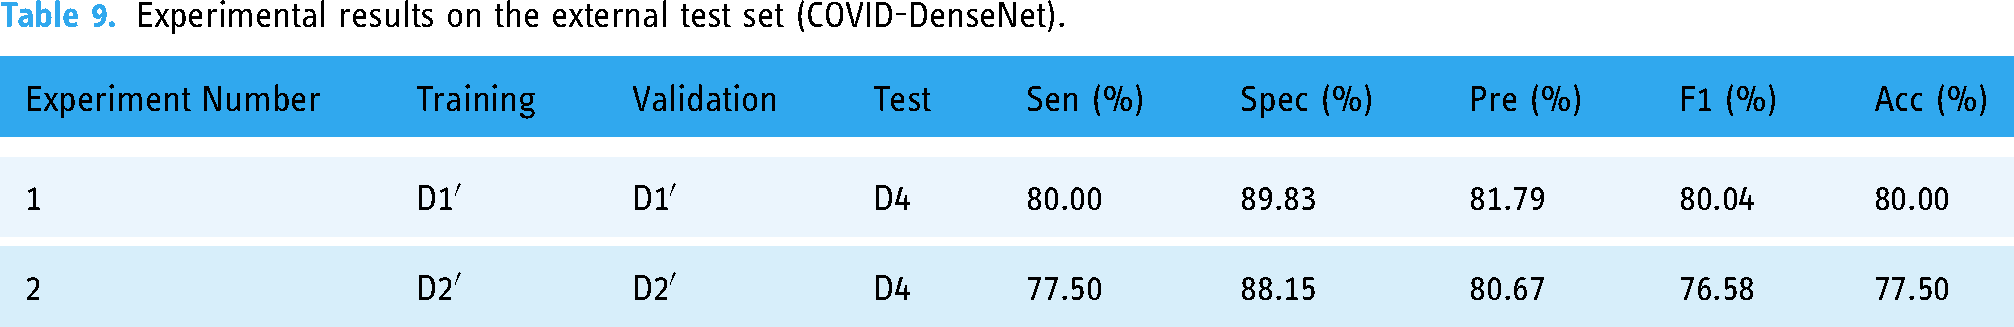
We conducted the experiment under consistent parameter Settings. The experimental results are shown in Tables 9 and 10. The classification accuracy and specificity of the model trained and verified on D1′ on the external test set D4 reached 80%, and the specificity reached 89.83%, which was better in COVID-19 recognition. When the classification accuracy of the model trained and validated on D2′, a data set with uneven sample distribution, decreases on the external test set, compared with the model trained on D1′, the classification accuracy and specificity decrease by 2.50% and 1.68%, respectively, and the performance indicators in COVID-19 recognition also decrease (see Table 10).
Experimental results on the external test set (COVID-DenseNet).
Experimental results on the external test set (COVID-DenseNet) (various categories).

Figure 9 depicts the confusion matrix of the model on the test set, revealing the model's high ability to identify COVID-19 cases on external datasets but a tendency to misclassify common pneumonia as normal. Although Experiment 1 exhibits a higher probability of misclassifying normal cases as common pneumonia compared to Experiment 2, its recognition ability of COVID-19 cases and common pneumonia cases surpasses those of Experiment 2, with Experiment 1 correctly identifying two more COVID-19 cases and 11 more cases than Experiment 2.

Confusion matrix (COVID-DenseNet model): (1) and (2) denote experiments 1 and 2, respectively.
Experiments 1 and 2 employed the same number of samples during model training and validation, with identical conditions and testing on the same external test set. However, the model trained in Experiment 1 outperforms the model trained in Experiment 2 on the external test set. This finding highlights that the degree of sample equilibrium between the training and validation sets impacts Covid-DenseNet's performance on the external test set.
In addition, we compared Covid-DenseNet to DenseNet121, INASNET, DFFCNet, and ResNet-50 + MCRA. According to Tables 11 and 12, compared with the model saved on the training set and verification set with unbalanced samples, the model saved on the training set and verification set with balanced sample distribution has better recognition effect on the external test set. Among them, our model, Covid-DenseNet, performs better than other models on external test sets. The recognition accuracy in Experiments 1 and 2 is the highest, and the overall performance is also very good in the recognition of various categories on the external test set.
Experimental results on the external test set.

Experimental results on the external test set (various categories).

Figures 10 and 11 show the confusion matrix of Covid-DenseNet, DenseNet121, INASNET, DFFCNet, and ResNet-50 + MCRA in the test sets of Experiments 1 and 2, respectively. As can be seen from Figure 10, in the identification of COVID-19, Covid-DenseNet correctly identified all samples, and the misdiagnosis probability of Covid-DenseNet was the lowest in terms of false negatives of Covid-DenseNet. It can be seen from Figure 11 that the number of samples correctly identified by Covid-DenseNet is still the largest when training on the data set with unbalanced samples.

Confusion matrix (experiments 1): (a) DenseNet121, (b) INASNET, (c) DFFCNet, (d) ResNet-50 + MCRA, and (e) COVID-DenseNet(our).

Confusion matrix (experiments 2): (a) DenseNet121, (b) INASNET, (c) DFFCNet, (d) ResNet-50 + MCRA, and (e) COVID-DenseNet (our).
From the experimental results, Covid-DenseNet validated by training on the dataset with balanced sample distribution performs better performance on the external test set. Compared with other models, Covid-DenseNet has the best overall performance in identifying COVID-19 cases on an external test set, with stronger robustness, enhanced recognition ability, and fewer false negatives.
Model behavior with variation in the sample size
In the preceding section, we evaluated the model performance of Covid-DenseNet on the external test set and compared it with DenseNet121 under identical conditions. In this subsection, we varied the dataset sample size to investigate its relationship for model training validation with the model performance on the external test set. Therefore, we conducted experiments by altering the dataset's sample size, as outlined in Table 13.
Experiments on dataset sample size variation.

Experiment 3 involved amalgamating the training sets of datasets D1′ and D2′ and the validation sets of both datasets, totaling 36,636 images in the training set and 10,834 images in the validation set, which were tested on the external test set D4. The resulting model achieved classification and recognition accuracy of 82.08%, with comfort, specificity, precision, and F1-score indicators reaching 80% (Table 14). The performance of the model trained on the mixed dataset surpassed that of models trained solely on D1′ or D2′ datasets (Table 9). In Experiments 4 and 5, we halved the sample size of both D1′ and D2′ datasets to maintain the dataset sample distribution balance, resulting in reduced model performance compared to models trained solely on D1′or D2′ datasets. By observing Table 15 and Table 10, we can also find that when the number of samples increases, the model also improves in terms of performance indicators for various categories.
Experimental results under varying dataset sample size (COVID-DenseNet).

Experimental results under varying dataset sample size (COVID-DenseNet) (Various categories).
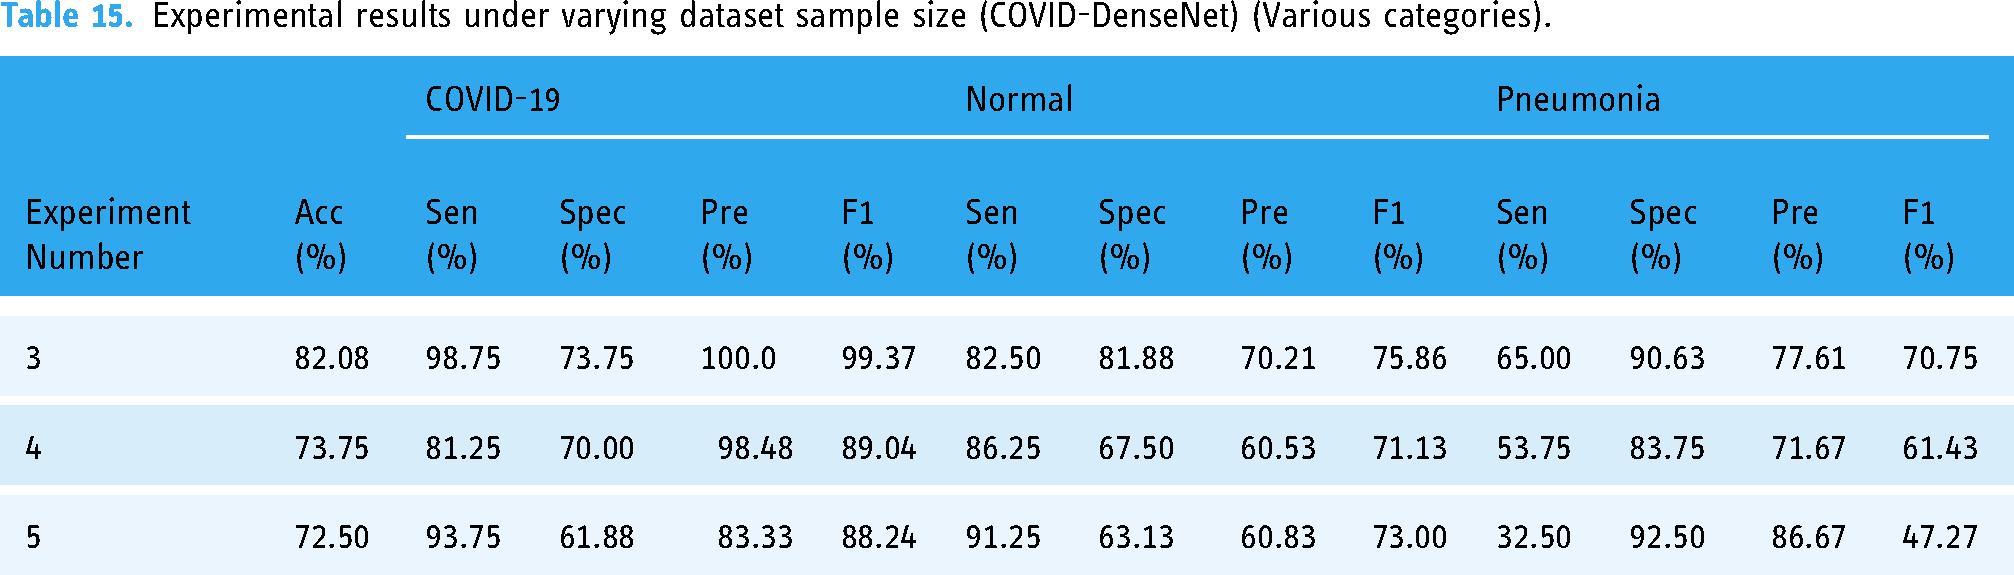
By observing Tables 15 and 10, it can be seen that with the increase of the number of training set and verification set samples, the performance indicators of model Covid-DenseNet in various categories also show an overall upward trend.
The confusion matrix for the experiment is depicted in Figure 12. Comparing it with Figure 9, it is evident that amalgamating the training and validation sets of datasets D1′and D2′ notably enhances Covid-DenseNet's capability to identify COVID-19 and common pneumonia cases. The Covid-DenseNet model misclassifies only one COVID-19 case as another category, and the misclassification of common pneumonia cases as normal also improves. Reducing the sample size of D1′ and D2′ datasets decreases the overall number of correctly identified cases on the external test set, with a worsening misclassification of common pneumonia cases as normal.

Experimental confusion matrix of COVID-DenseNet model under varying dataset sample size in experiments 3–5.
These experimental findings underscore the correlation between Covid-DenseNet's performance on the external test set and the dataset's sample size utilized for model training and validation. Model performance validated on datasets with larger training sample sizes exhibited superior performance than that of those trained on smaller sample sizes. Models trained on merged datasets outperformed those trained on separate datasets, achieving a synergistic effect of 1 + 1 > 2.
Discussion
During the COVID-19 pandemic, neural network systems have been providing assistance for clinical decision making. However, in practical application, factors such as clinical variables need to be overcome to make decisions, which puts higher requirements on the generalization ability and robustness of the constructed models. 46 At present, the number of studies using artificial intelligence to diagnose COVID-19 has increased exponentially, but most of these studies lack prospective studies and external validation, and are not suitable for routine applications in clinical practice. 47 The approach presented in this paper aims to build a robust network model that integrates with existing IT systems to help radiologists work and improve their efficiency and effectiveness. We propose Covid-DenseNet model and conduct a comprehensive evaluation of it, including internal evaluation of multiple data sets with different sample distribution characteristics and external validation of external test sets.
During the evaluation on the internal test set, we selected three data sets with different sample numbers and sample distributions (see Tables 1–3) for the experiment. First, we built our model Covid-DenseNet on dataset D1 and compared it with some existing advanced models. According to the data in Table 5, Covid-DenseNet has the highest recognition accuracy on the test set when evaluated on the data set with a balanced sample distribution and a large number of samples.
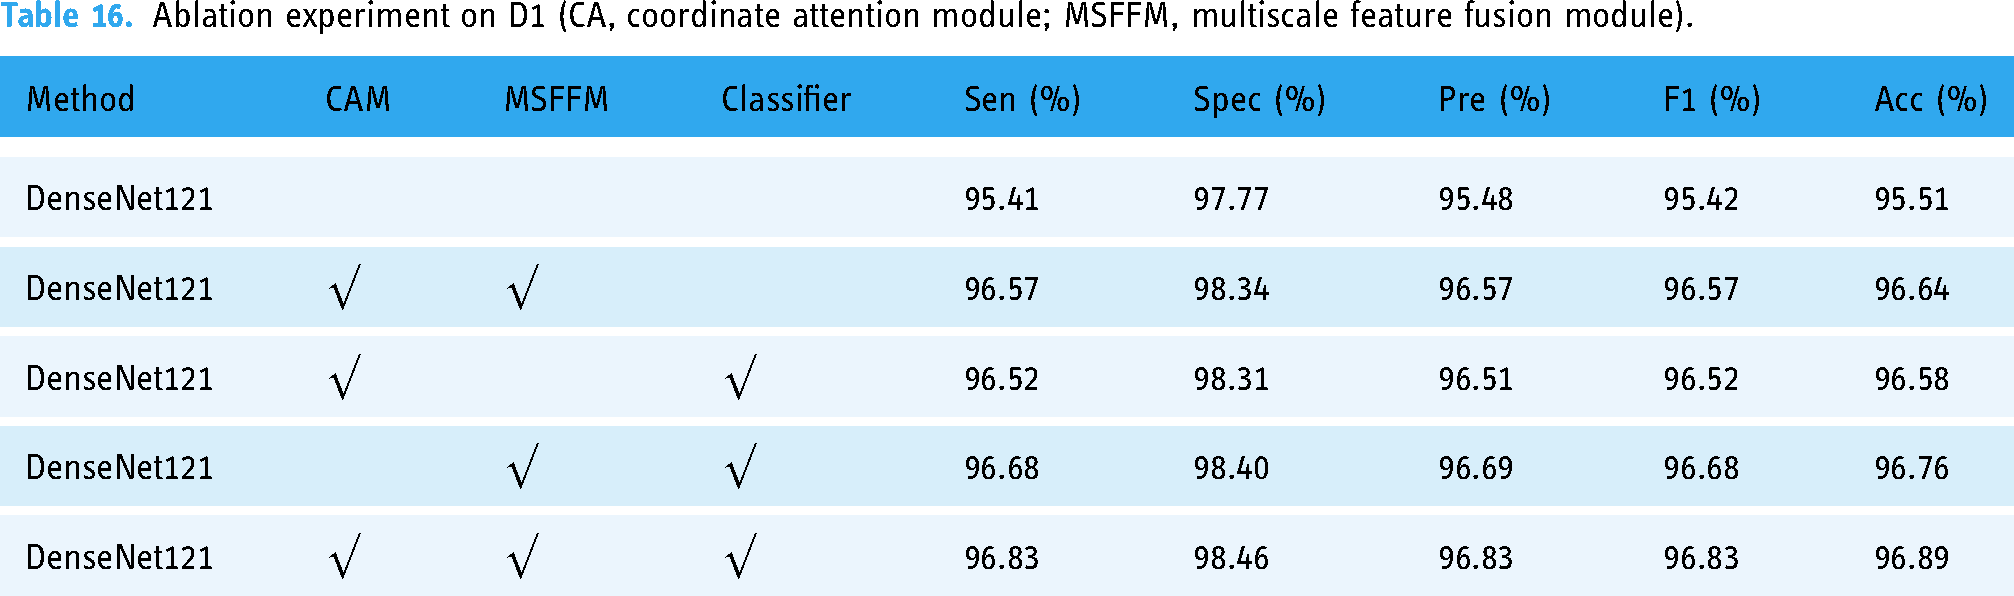
In addition, to demonstrate the importance of each module in our proposed framework, we conducted ablation experiments, and the experimental results are shown in Table 16. As can be seen from Table 16, each module in our framework is necessary and affects the model's performance. When using DenseNet121's original classifier, model classification accuracy decreased by 0.25%. The model performance was 0.31% lower without the multiscale feature fusion module. Without the coordinate attention module, the model accuracy dropped by 0.13%. The multiscale feature fusion module has the greatest effect, and the model performance declines the most.
Ablation experiment on D1 (CA, coordinate attention module; MSFFM, multiscale feature fusion module).
Compared with DenseNet121, which adopts the same optimizer and loss function combination, the model framework we constructed improved by 1.38% in accuracy and the most in sensitivity, by 1.42%, 1.35% in precision, and 1.41% in F1-score, while Flops only increased by 0.9 g.
We also conducted experiments on data sets D2 and D3, which were characterized by uneven sample distribution and small sample size, respectively. In these two data sets, the recognition effect of our model also exceeds that of some existing advanced models. Through experimental evaluation on D1–D3, it is proved that our model has strong resistance to changes in sample distribution, and exceeds that of some current advanced models. We also illustrate the interpretability of Covid-DenseNet on D1–D3 datasets with the Grad-CAM algorithm and visualize the prediction process with the heat map in Figure 13. The depth of the color indicates the focus area of the model prediction process. The arrows indicate the focus area on which our model is based in the classification, and it can be seen from Figure 13 that the focus area is in the lungs, which affirms the reliability of our model.

Examples of heat maps for COVID-19 diagnosis of datasets: (a) D1, (b) D2, and (c) D3.
By above experiments, we only evaluated Covid-DenseNet on the internal test set. Although it has been proved that our model has good adaptability to data sets with different sample distributions, this evaluation only shows that the recognition effect on the internal test set of Covid-DenseNet is slightly better than other advanced models.
On the external test set, we reconstruct the data set D4, the sample sources in D4 are independent of D1 and D2, and some samples are randomly selected from D1 and D2 to form the training set and the validation set. According to the experimental results on the external test set, it can be seen that the recognition effect of Covid-DenseNet on the external test set is better when the sample distribution is balanced and the sample features are abundant.
In addition, combined with Tables 5, 7 and 12, it can be seen that the robustness of Covid-DenseNet is superior to other models, and it always achieves the best effect on the internal test set as well as the external test set. The above shows that our model has good generalization performance and robustness. Combined with small calculation and reference amount, it is proved that our model Covid-DenseNet has good clinical practice.
Of course, Covid-DenseNet still have some limitations in our study. For example, we only conducted research on the chest radiographic data set of three categories for the identification of COVID-19, and did not evaluate whether our Covid-DenseNet model also has excellent recognition ability in other similar respiratory diseases. The identification of COVID-19 was only conducted on the chest radiographic data set. No evaluation was performed on CT images. And due to the relatively small number of relevant data sets, the model's ability to recognize COVID-19 in patients with multiple similar respiratory diseases is not considered. Future studies may evaluate these deficiencies experimentally to obtain more comprehensive results. From Tables 5 to 7, the amount of computation is relatively small compared with similar other models, especially on D2 and D3 dataset. This will make the clinical application possible. In fact, the computation resource requirements are not big when our model is trained to be used to recognize COVID-19. The trained model can be made into an executable file that runs independently of the original programming environment. Therefore, our model has good portability and can be easily integrated into existing medical system. Of course, the amount of computation of our model still has certain improvement room in order to real time application in clinical practice. To demonstrate the good clinical practice of Covid-DenseNet, evaluation on an external test set is needed to further demonstrate the robustness of the proposed model.
Conclusion
By evaluating the performance effect of Covid-DenseNet on datasets with different sample distribution characteristics and the model on datasets other than the baseline dataset, we can find that the constructed Covid-DenseNet not only requires less computation than other models, but also has better recognition accuracy and good generalization performance. We also explored the performance of Covid-DenseNet on external test sets, conducted experimental evaluation according to the different distribution of the training set samples, and compared it with DenseNet121, which further proved that the improvement of our model was effective and could further enhance the robustness of the model. In addition, the effect of sample feature richness in the training set on the performance of Covid-DenseNet on the external test set is also explored, and the results show that the sample feature richness in the training set is directly proportional to the robustness of the proposed Covid-DenseNet.
Although our Covid-DenseNet model have good effect in recognize COVID-19 compared existing similar methods, there are still some limitations and challenges. First, there are still certain improvement room in computation complexity although computational amount of our model is relatively small. In the future, we will simply the structure of our model to further reduce requirement to computation resource. This will be valuable to real-time clinical applications. Second, only CXR images are used to build the COVID-19 recognition model based on deep learning. Our model does not consider the COVID-19 patients who might present other similar respiratory diseases. In the future, we will expand our dataset to further improve the robustness and generalization ability of our model to deal with more complicated conditions.
Footnotes
Acknowledgments
Contributorship
ZCJ and RLT have conceived the study, made experiments, and written the draft of the manuscript. JLF was involved in data acquisition and analysis. FLL and TFQ discussed and interpreted the results. All authors read and approved final manuscript.
Declaration of conflicting interests
The authors declared no potential conflicts of interest with respect to the research, authorship, and/or publication of this article.
Funding
This work was supported in part by National Natural Science Foundation of China (41575046), and in part by the Project of Commonwealth Techniques and Application Research of Zhejiang Province, China under Grant TGG24D050001.
Ethical approval
This study was approved by the Ethics Committee of Taizhou Central Hospital, Zhejiang province, China (Approval No. 2024L-07-62)
Guarantor
Li-Li Feng.