
Abstract
Objective
This study assesses the application of interpretable machine learning modeling using electronic medical record data for the prediction of conversion to neurological disease.
Methods
A retrospective dataset of Cleveland Clinic patients diagnosed with Alzheimer's disease, amyotrophic lateral sclerosis, multiple sclerosis, or Parkinson's disease, and matched controls based on age, sex, race, and ethnicity was compiled. Individualized risk prediction models were created using eXtreme Gradient Boosting for each neurological disease at four timepoints in patient history. The prediction models were assessed for transparency and fairness.
Results
At timepoints 0-months, 12-months, 24-months, and 60-months prior to diagnosis, Alzheimer’s disease models achieved the area under the receiver operating characteristic curve on a holdout test dataset of 0.794, 0.742, 0.709, and 0.645; amyotrophic lateral sclerosis of 0.883, 0.710, 0.658, and 0.620; multiple sclerosis of 0.922, 0.877, 0.849, and 0.781; and Parkinson’s disease of 0.809, 0.738, 0.700, and 0.651, respectively.
Conclusions
The results demonstrate that electronic medical records contain latent information that can be used for risk stratification for neurological disorders. In particular, patient-reported outcomes, sleep assessments, falls data, additional disease diagnoses, and longitudinal changes in patient health, such as weight change, are important predictors.
Introduction
The burden of neurological disease in the United States is large and increasing, with incident cases of Alzheimer's disease (AD) and other dementias increasing by 48.4%, Parkinson's disease (PD) increasing by 98.3%, multiple sclerosis (MS) increasing by 23.9%, and motor neuron diseases, including amyotrophic lateral sclerosis (ALS), increasing by 86.8% from 1990 to 2017. 1 While these diseases are currently incurable, interventions have the potential to delay the onset of disease, slow disease progression, and manage symptoms.2–8 Quantitatively determining an individual's risk for neurological disease could better inform patients and clinicians about opportunities for early interventions, test candidate therapies earlier in the disease process, and provide insight into disparities of disease risk for subpopulations.
Diagnostic and prognostic predictions of neurological disease risk in the literature commonly rely on data elements gathered beyond the current clinical standard practice, including questionnaires, imaging, voice recordings, genetic testing, and combinations of these techniques with other biomarker samples.9–23 While these approaches have tremendous value from a research perspective, they have not yet been adopted widely or integrated into routine clinical care. A risk prediction tool using existing data gathered as part of routine clinical care may provide an automated screening for neurological disease with little to no additional time for the provider.
Records within the electronic medical record (EMR) system contain longitudinal histories of medical data for large and diverse cohorts of patients, including those who do and do not develop neurological disease. Retrospective data analysis allows for larger datasets, both in the number of patients and duration of the study, than is often feasible in randomized clinical trials. 24 Since EMR data are structured for clinical use, substantial effort is necessary for parsing, cleaning, and transformation for use in predictive modeling. These initial data verification and validation steps have served as a barrier to its use in the development of informative disease prediction models. The quality and completeness of EMR data vary dramatically within and across healthcare systems and clinical practices and can affect the performance and generalization of EMR-based models. 25
Machine learning (ML) is an effective tool for modeling EMR data, as it can work with high-dimensional data to produce complex, nonlinear models. 26 A clinical decision support tool using ML algorithms trained on EMR data has the potential to guide and prioritize preventive intervention at little to no extra cost or could be used as a screening tool for appropriate further testing. Historically ML has been slow to be adopted in the healthcare setting due to a “black-box” methodology which results in a lack of trust in the algorithm by clinicians. 27 Explainable Artificial Intelligence (XAI) is an emerging modeling approach that aims to provide transparency and evaluate fairness of even the most complex predictive models, but to date it has been underutilized in medicine. 28 Explainable Artificial Intelligence provides context and transparency for clinicians to understand each prediction and apply their own medical expertise to the unique circumstances of each patient.
Electronic medical record-based prediction models are an active area of research in neurological care. In their 2023 scoping review of dementia phenotypes in electronic health records, Walling and colleagues noted the significant role EMR data can play in identifying patient cohorts for dementia care and research and reviewed two categories of algorithms. In the first category, algorithms identifying patients already diagnosed with dementia, each algorithm minimally includes International Classification of Disease (ICD) codes as predictors, with the most specific approaches incorporating multiple ICD codes, natural language processing (NLP), or keyword searches. In the second category, algorithms identifying patients at high risk for dementia, the goal is a more sensitive algorithm. 29 While many of these models are derived from restricted clinical settings such as the ICU or focus only on a diagnostic timepoint, several studies use a large EMR dataset for earlier prediction of AD or other dementia.30–32 Li et al. published a systematic comparison of EMR-based models for early prediction of AD and related dementias and demonstrated the effectiveness of ML and XAI techniques. 32 In their models, variables which could change over time were binned according to their most recent value, though there is research supporting using trajectories of patient vitals for prediction of AD. 33 Electronic medical record data augmented with knowledge graphs have also shown success in early detection of PD and MS.34,35 More research is needed for the use of EMR data and ML for early detection of ALS, but the disease has been characterized in a large cohort of military Veterans’ EMR data. 36 Further, there are examples of EMR-based models for treatment and prognosis of these diseases, not all of which are included here.23,37,38 While Simonet et al. address the importance of fair representation in research datasets, 39 few EMR-based prediction studies report on equitability, despite the known existence of health disparities in neurological care.40,41
This retrospective study assesses an application of ML in developing predictive models for conversion to one of multiple neurological diseases using EMR data. The study leverages the Cleveland Clinic Health System (CCHS) medical records of patients diagnosed with PD, AD, MS, and ALS, along with control patients from Internal Medicine and Geriatrics. The performance of EMR-based ML risk stratification for neurological disease is assessed at different timepoints in a patient’s history, from prognostic risk predictions to early detection of disease. Explainable Artificial Intelligence methods enable the examination of individual variable importance and interactions between variables. Additional analyses by sex and by race add to the transparency and fairness of the model evaluation. Previous work indicates that predictions derived from high-quality and highly curated EMR data can generalize well across disease categories, racial subgroups, future years, and individual sites within the same hospital system. 42
This is the first systematic study to compare the same powerful ML algorithm on the same clinical dataset for four neurological diseases, which vary in pathology and prevalence. It is the first ML risk stratification study of this breadth for predicting conversion to neurological disease using routine EMR data. The full available patient history is considered, including how patient-reported outcomes, lab values, vitals, and other metrics have changed and varied, in contrast to studies which only consider a most recent snapshot. We also address a gap in the literature for evaluation of fairness in neurological disease predictors. Generalizability of the models will be strengthened when validated across other healthcare systems, however, the interpretable results provide new generalizable knowledge about data elements that have predictive power and how far in advance of disease diagnosis they may be used. The results may be used by other healthcare systems to guide investment in their own EMR prediction models and data collection practices, and by clinicians to evaluate existing signs and symptoms in their daily practice. This study was approved by the Cleveland Clinic Institutional Review Board as a minimal risk study with a waiver of individual informed consent.
Methods
Data collection
Data were collected from CCHS internal databases which combine EMR data, billing data, geocoding, national and Ohio death index datasets, and surveys into a research-ready format. 43 The data pipeline includes standardized filters, NLP for keyword extraction, and a mapping of terms to Unified Medical Language System (UMLS) concepts. 44 The CCHS is a large, integrated health system with national and international locations. In-person encounters were included for 10 acute care hospital sites in Northeast Ohio, the Lou Ruvo Center for Brain Health in Nevada, and over 200 outpatient facilities throughout the healthcare system.
Patients included in the neurological disease cohort have two or more instances, at least 30 days apart, of an ICD code for one of the four neurological conditions, the first of which could be sourced from medical history. This definition yields a high sensitivity of the algorithms to probable disease cases, at the expense of a potentially higher rate of false positive misclassification. The EMR contains two date fields for a diagnosis. One is an optional field for the date the diagnosis was made and can be a historical date from another institution. The second is the date of the associated patient encounter. The earlier of the two date fields is taken as the diagnosis date, and the earliest diagnosis date of neurological disease or a preceding dementia is taken as the index date for this study. This definition of index date is designed to capture the earliest probable clinical onset of the disease, whether it was diagnosed outside of our healthcare system, or whether it was preceded by a more general dementia diagnosis, as is common in AD. Index dates were selected from the years 2001–2020, with patient history spanning from 2000–2020. There is no restriction on the clinical setting of the associated encounter.
Control patients were matched to the neurological disease patients based on age, sex, race, and ethnicity. To be eligible for the control group, patients must have completed a visit with a Geriatrics or Internal Medicine provider in the same calendar year as a neurological disease patient's index diagnosis. They must be at least 19 years old and have another visit at least one year prior. Patients are ineligible if they have any ICD code for one of the four listed neurological conditions at any time, or a diagnosis of dementia prior to or within 30 days of the encounter date. The index date for each control is the date of the encounter that made them eligible for inclusion. If an exact match was not available, the algorithm expanded the age range matching criterion up to 10 years and less often, removed demographic matching criterion.
Candidate variables were selected based on clinical review, literature review, experience from previous EMR calculators, and availability in the EMR system. A wide selection of candidate variables was desired, regardless of mutual information, to allow the data-driven selection of variables by the ML algorithms. The following types of data were collected: Patient demographics, diagnoses, symptoms, lab values, and patient reported outcomes, including self-reported falls data, the Patient-Reported Health Questionnaire nine item depression module (PHQ-9), 45 and the Patient-Reported Outcomes Measurement Information System mental and physical health scores. 46 Cleveland Clinic holds copyright permissions for all tools and questionnaires used in the analysis. Diagnosis categories were created according to the Charlson Comorbidity Index, 47 cardiovascular outcomes from models by Young et al., 48 and UMLS concepts. Additional definitions and a full variable list are included in Supplementary Tables 1 and 2.
Demographics and key variables for controls and neurological disease cases in the full dataset.

Key variables are taken from the top five variables in each model according to SHAP mean absolute value.
SD, Std: standard deviation; n: number in cohort; %: Percent of cohort; Dx: Diagnosis of; REM: rapid eye movement; PHQ-9: Patient Health Questionnaire-9; HDL: high-density lipoprotein; LDL: low-density lipoprotein, falls last year injury: “Have you had 2 falls in the past year or 1 fall with injury?,” falls last year injury or device: “Has the Patient Had 2 Falls in the Last Year or 1 Fall with Injury or Currently Using an Ambulatory Assistive Device (Walker, Cane, Wheelchair, Crutches, etc).”
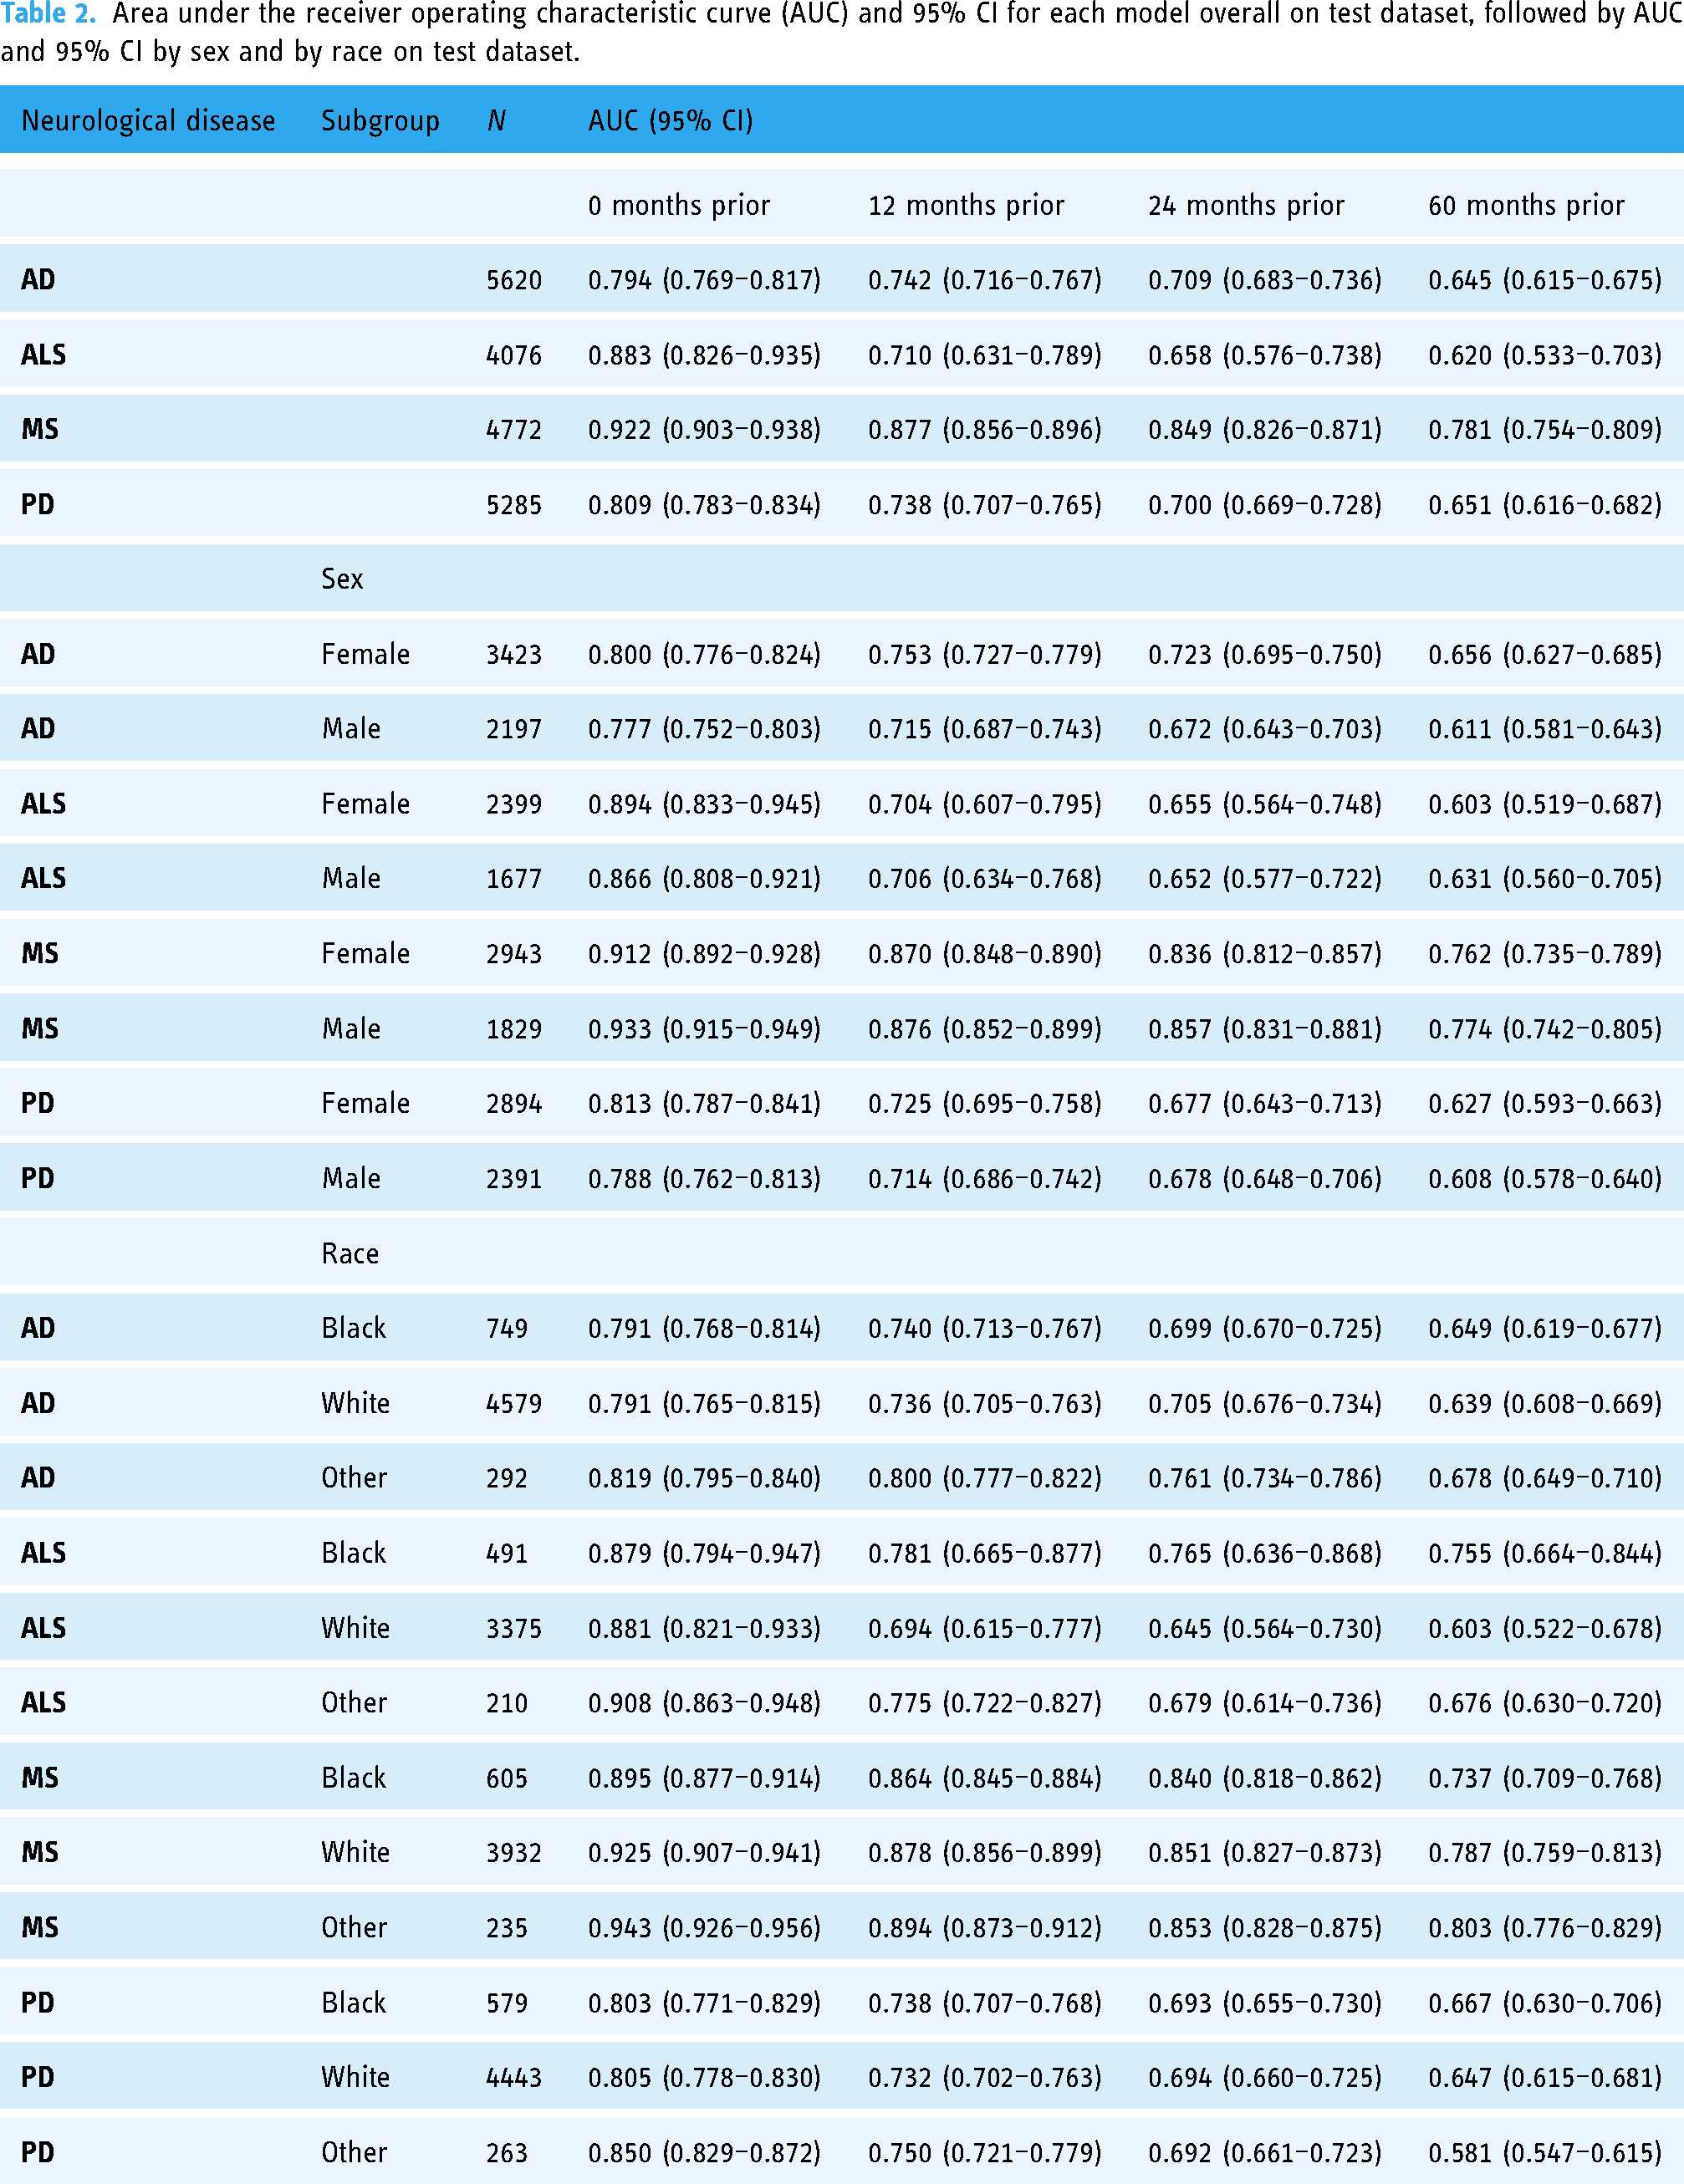
Area under the receiver operating characteristic curve (AUC) and 95% CI for each model overall on test dataset, followed by AUC and 95% CI by sex and by race on test dataset.
Longitudinal data were cleaned for inconsistencies, such as removing outliers in a series of height measurements. Additional statistical variables including min, mean, max, standard deviation, slope, and most recent value were derived for longitudinal lab values, vitals, and surveys.
Missing data are common in EMR data and are often not missing at random. Missing data could demonstrate a low utilization of healthcare services, healthcare services that were received at other institutions, or a lack of an indication for certain tests or diagnoses. For example, a patient with no risk factors or symptoms of Diabetes is unlikely to have HgbA1c tests, and these missing data are more likely to be in the normal range. Diagnoses are only included on patient problem lists when positive; that is, there is not a list of diagnoses the patient is confirmed not to have. Therefore, all diagnosis variables in this analysis are either positive or negative with no missing data. Any remaining missing data were not imputed and were handled natively by the ML algorithm.
All patient identifiers were replaced with a random 10-digit Subject ID. Each patient was assigned a random offset from 0 to 364 days, and all treatment dates were adjusted back in time by this offset. This kept all timeline intervals intact while masking the actual treatment dates. Any patient history prior to their 18th birthday was excluded.
Statistical analysis and model development
The Positive Predictive Value (PPV) and Negative Predictive Value (NPV) of neurological disease by the cohort definitions were measured through manual chart review of 50 patients randomly subsampled from each of the four neurological disease cohorts and the controls group.
The dataset was randomly split so that 60% of patients were part of a training set, 25% of patients were part of a validation set, and 15% of patients comprised the test set. The training set was used to train multiple candidate algorithms. The validation set was used to evaluate the performance of each candidate and select the final models. The test set was reserved to evaluate the performance of the selected models, mitigating any bias in the performance estimates resulting from the selection process.
A diagram of the model development is provided in Figure 1. For each of the 16 models estimating the risk of diagnosis of one of four neurological diseases at four timepoints, two candidate models were developed, which varied in whether sensitive racial variables were included. Each candidate model was evaluated on the validation data set by the area under the receiver operating characteristic curve (AUC), visual assessment of calibration, and equitability of AUC and calibration between patient subgroups. Confidence intervals (CIs) for AUCs were derived from 1000 bootstrap samples. Based on these results, desirable models were selected and evaluated on the test data set by the same metrics, presented here.
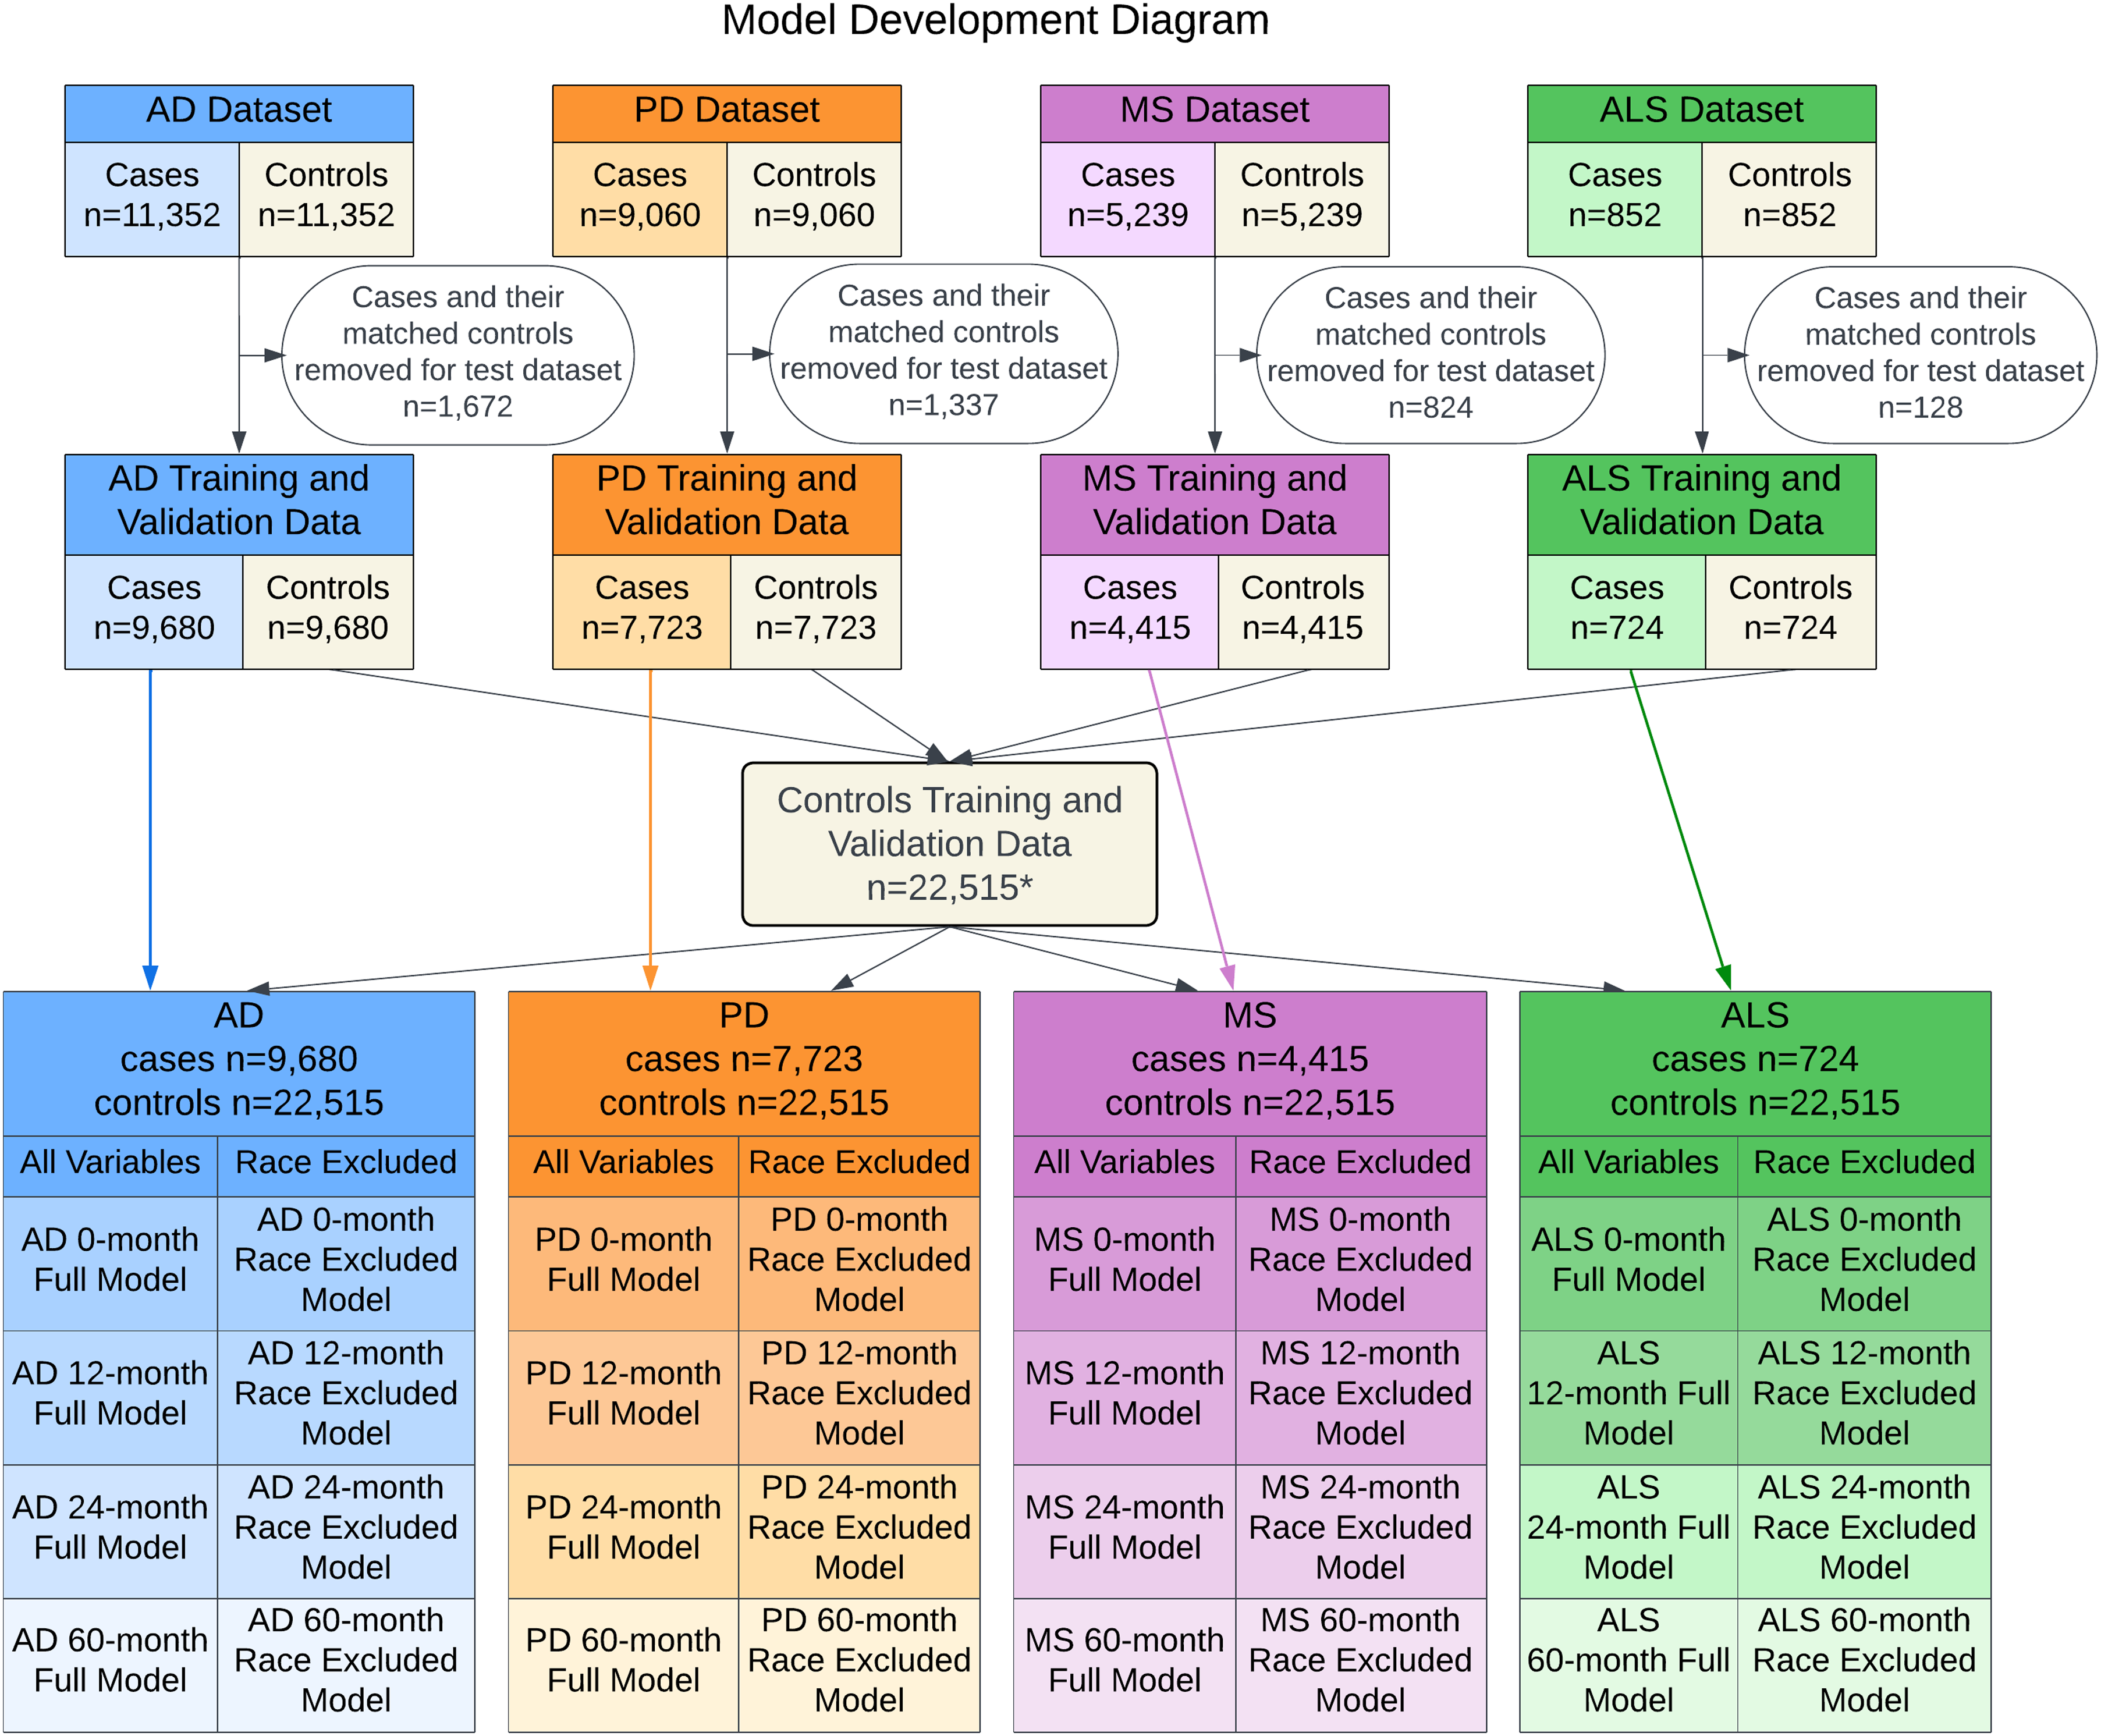
Model development diagram. Summary of the model development process from the initial matched patient cohort to the 32 models evaluated. * Nine duplicate control patients were removed from the aggregated control set.
Prior research and testing on a preliminary dataset highlighted eXtreme Gradient Boosting (XGBoost) as an appropriate algorithm for the models. XGBoost is an ensemble learner of gradient-boosted trees that has been shown to outperform other algorithms in many contexts. 49 The algorithm is data-adaptive, allowing complex, nonlinear relationships to emerge. Other desirable features of the algorithm include native feature selection and reporting of variable importance, native handling of missing data, robust integration of data on differing scales, computational efficiency, and seamless integration with model explainability techniques.
All collected predictors were eligible for inclusion, allowing the XGBoost algorithm to select only the variables that contributed to prediction accuracy. XGBoost hyperparameters were selected using 5-fold cross-validation on the training set. Maximum tree depth, number of trees, and learning rate were selected for each model via an iterative algorithm, which first established the global maximum for the AUC on the validation data. The algorithm then successively subsampled combinations of the hyperparameters which yielded AUC values within 0.01 of the global maximum. The algorithm ran until the unique combination of parameters was found that satisfied the global maximum criterion with the fewest number of trees required.
Python (versions 3.6 and 3.7) 50 was used for all analyses, including freely available packages Scikit-Learn, 51 XGBoost, 49 and SHAP. 52 We adhered to the TRIPOD (Transparent Reporting of a multivariable prediction model for Individual Prognosis Or Diagnosis) checklist for prediction model development. 53
Results
Study cohort
The study includes 52,939 patients, of which 26,463 are in the control group. There are 11,352 patients diagnosed with AD, 5,239 with MS, 825 with ALS, and 9,060 with PD. The average age is 70.0 (SD 16.2) with 58.4% of the cohort being female. The majority of patients are White (82.2%) followed by a sizable minority of Black patients (12.8%). Demographics and key variables in the population are provided in Table 1.
A total of 250 charts were reviewed for clinically confirmed diagnoses in histories, problem lists, and notes. The PPV for AD was 98%, for ALS was 84%, for MS was 94%, and for PD was 86%. Common reasons for misclassification included differential diagnoses resulting in an inconclusive diagnosis or a diagnosis for a related condition such as drug-induced Parkinsonism, bulbar-onset motor neuron disease, or transverse myelitis. All 50 control group patients were confirmed not to have one of the four neurological diseases for a NPV of 100%.
Model performance
The predictive performance of the models decreases as the number of months prior to the index date increases (see Table 2). At timepoints 0-months, 12-months, 24-months, and 60-months prior to diagnosis, AD models achieved AUCs of 0.794 (95% CI: 0.769–0.817), 0.742 (CI: 0.716–0.767), 0.709 (CI: 0.683–0.736), and 0.645 (CI: 0.615–0.675); ALS of 0.883 (CI: 0.826–0.935), 0.710 (CI: 0.631–0.789), 0.658 (CI: 0.576–0.738), and 0.620 (CI: 0.533–0.703); MS of 0.922 (CI: 0.903–0.938), 0.877 (CI: 0.856–0.896), 0.849 (CI: 0.826–0.871), and 0.781 (CI: 0.754–0.809); and PD of 0.809 (CI: 0.783–0.834), 0.738 (CI: 0.707–0.765), 0.700 (CI: 0.669–0.728), and 0.651 (CI: 0.616–0.682), respectively. MS models had the highest AUC across all timepoints. Models for ALS and models at 60-months prior to diagnosis had notably lower AUCs. Alzheimer's disease and PD models reached acceptable performance at 24-months prior to diagnosis with increasing performance at timepoints nearer to diagnosis. All models perform well at the baseline of 0-months prior and at 12-months prior.
Calibration of the models is presented in plots of predicted risk against observed proportions of disease occurrence (Figure 2). All models demonstrated excellent calibration through their close adherence to the 45-degree line that represents perfect calibration. The models display comparable ranges of predictions, except ALS models which were much more conservative. Models for the same neurological disease displayed smaller prediction ranges for timepoints earlier in a patient’s history, with the 60-month models demonstrating the smallest prediction ranges. The 60-month AD model shows a spike in underprediction just below the mean predicted risk of 0.3, which corresponds to the largest bin of predictions for the model.

Calibration and prediction histograms. The mean predicted risk of disease is compared to the observed proportion of disease in eight quantiles. Bars indicate numbers of patients in evenly spaced bins of predicted risk and utilize the secondary y-axis. All models demonstrate excellent calibration, as measured by their adherence to the 45-degree line that represents perfect calibration. The models display comparable ranges of predictions, except for ALS models which were much more conservative in range. Models for the same neurological disease generally displayed smaller prediction ranges for timepoints earlier in a patient's history, with the 60-month models demonstrating the smallest prediction ranges.
To use a model in clinical practice, it is usually necessary to choose a threshold for a planned intervention by considering the sensitivity and specificity of the model at the chosen threshold as well as the risks and benefits of the intervention. A specific intervention proposal is not part of this study; however, the sensitivity and specificity across a range of thresholds for each model on the test dataset is provided in Supplementary Figure 1.
Explainability
This analysis uses SHAP (SHapley Additive exPlanations), 52 a computationally efficient Python package based on Shapley values, 54 to estimate the marginal contributions of each predictive variable to the prediction. This is a model-agnostic XAI technique that provides global interpretability of the models, but can also be used to interpret an individual patient's unique predictive factors. Variables with SHAP values of greater magnitude are considered more important to the model. SHAP values are expressed in the same units as the model output, which are log odds for XGBoost. To examine the model as a whole, the SHAP absolute values are averaged across patients in the test dataset. The resulting mean value is referred to as the global feature importance. The values indicate a magnitude, but not a direction, of correlation. As the model is nonlinear, it is possible that a variable’s value is not linearly correlated with the prediction and could also be dependent on interactions with other variables.
Summary plots of the top five variables, or “features,” for each of the 0-months prior (Figure 3) and 12-months prior (Figure 4) timepoints display the relationship between the feature's data values (e.g., years of education = 12) and its SHAP values (e.g., 0.2 increase in log odds). Summary plots for the additional timepoints are available in Supplementary Figures 2 and 3. The models use a large number of variables and the top five represent a fraction of the cumulative importance of all variables, indicated in parentheses in the plots. In each figure, the top five predictive variables are displayed in descending order of importance along with the vertical axis. Each variable has a beeswarm plot where each dot represents a record in the test dataset, colored according to the record’s data value and positioned along with the x-axis according to its SHAP value. The vertical spread of the beeswarm indicates the distribution of the SHAP values. The color indicates whether the feature value is missing (gray), high (yellow), low (purple), or somewhere in between as referenced by the color bar. The vertical gray line represents the model’s mean prediction. Positive SHAP values are on the right side of the vertical line and indicate that the variable increases the predicted probability of neurological disease. In a variable with a simple direct relationship between the data values and the probability of conversion to neurological disease, the beeswarm will progress from dark purple on the left to bright yellow on the right. When the coloring is mixed along with the horizontal axis, the relationship is nonlinear and might include interactions with other variables. Binary variables are coded with No = 0 which will display as dark purple and Yes = 1 which will display as bright yellow.

Top five variables for 0-month models by SHAP mean absolute value. The top five predictive variables for each baseline model are displayed in descending order of importance along with the vertical axis according to SHAP mean absolute value. The SHAP mean absolute value divided by the cumulative sum of all variables’ SHAP mean absolute values is indicated in parentheses. The most important model variables are minimum patient weight in AD, mean PHQ-9 score in PD, numbness in MS, and male sex in ALS.

Top five variables for 12-month models by SHAP mean absolute value. The top five predictive variables for each 12-month model are displayed in descending order of importance along with the vertical axis according to SHAP mean absolute value. The SHAP mean absolute value divided by the cumulative sum of all variables’ SHAP mean absolute values is indicated in parentheses. The most important model variables are the slope of a linear fit of patient weight throughout time in AD, male sex in PD, maximum urea nitrogen lab value in MS, and most recent total cholesterol lab value in ALS.
Alzheimer's disease: Several weight variables, the binary variable alcohol use, and years of education were the main variables for prediction in all models. Patients who report using alcohol have reduced probability of classification of AD in all models. Weight variables, discrete and derived, appear across all models, with a trend of weight loss or low weight leading to the classification of neurological disease. If a patient is diagnosed with a pulmonary disease, for the baseline model, they are more likely to be classified as not having AD, while in the 12-month model, a cardiovascular diagnosis is more likely to result in an AD diagnosis. The top five variables represent between 12.9% and 24.3% of the cumulative SHAP values for the four timepoint models.
Amyotrophic lateral sclerosis: In all models, male patients are more likely to convert to disease. PHQ-9 mean and max are influential variables in the baseline model, having higher values associated with disease, but do not appear in the top five for any of the other timepoints. Symptoms such as dysarthria and falls last year injury, which summarizes self-reported answers to whether two falls have occurred in the previous year or a fall resulting in injury, are prominent in the baseline model, implying that several characteristics of disease are present when the diagnosis is first made. Predictions at earlier timepoints, which did not perform well by AUC, rely heavily on lab values. Lab values for Triglycerides, LDL, creatinine, and hemoglobin appear in the baseline model as well. The top five variables represent between 22.7% and 43.6% of the cumulative SHAP values for the four timepoint models.
Multiple sclerosis: All MS models associate a lower value of urea nitrogen with probability of disease, using both the most recent value and the average value in the patient history. Cholesterol and systolic max variables appear in all models, and across the board females are more likely to be diagnosed with the disease. The baseline model includes symptoms of numbness and falls last year injury. The top five variables represent between 13.8% and 28.4% of the cumulative SHAP values for the four timepoint models.
Parkinson's disease: Across all models, males are more likely to be categorized as PD patients. Alcohol use or a diagnosis of pulmonary disease were associated with a decreased risk of PD. PHQ-9, mood disorders, and falls last year injury were also represented. Black race was in the top five variables for the 24-month and 60-month models. The top five variables represent between 20.8% and 31.2% of the cumulative SHAP values for the four timepoint models.
The global feature importance metrics discussed so far represent an average effect across all patients in the model. There are some variables that may not have a strong average effect, but still have a substantial impact on a subset of patients. To evaluate those variables, similar plots are generated using a maximum absolute value of all individual SHAP values for the 0-month models (Figure 5). While many of the same variables are important when computed via mean or maximum, there are new variables in the top five ranking by maximum that include REM sleep behavior disorder, PHQ-9 slope as computed by a linear fit of PHQ-9 scores through time, paralysis, dysarthria, and having a vision problem. The variable falls last year injury or device also appears, which differs from falls last year injury by additionally including whether the patient is using an ambulatory assistive device. Extreme lab values, such as sodium, creatinine, and albumin, can also produce large SHAP values.

Top five variables for 0-month models by SHAP Maximum absolute value. The top five predictive variables for each baseline model are displayed in descending order of importance according to SHAP maximum absolute value along with the vertical axis. Extreme lab values, such as Sodium, Creatinine, and Albumin, have relatively large SHAP values. Rare conditions, such as a diagnosis of REM sleep behavior disorder, paralysis or reported symptoms of dysarthria or vision problems, have large effects on small numbers of patients. The PROMIS global mental health z-score and the slope of a linear fit of longitudinal PHQ-9 scores are also ranked.
Fairness
Models were examined for equitable performance in AUC and calibration by sex and by race (Table 2). In most models, male and female subgroups showed comparable performance as measured by AUCs falling within the 95% CI of the comparative group. The exceptions are that AD models demonstrate better performance for females at the 12, 24, and 60-months prior timepoints, and MS models demonstrate better performance for females at the 0-months prior timepoint. In the racial subgroups, particular attention is paid to the Black race and White race subgroups, which represent the two largest subpopulations. Most models showed comparable performance between races, with the exceptions of ALS models demonstrating better performance for Black patients and MS models better performance for White patients. Racial categories with low representation, including American Indian or Alaska Native, Asian, Multiracial/Multicultural, Other, Declined, Unknown, and missing, were grouped into a single Other category for these analyses. AUCs for the Other category were comparable to or exceeded AUCs for Black and White subgroups in all models except the PD 60-month model.
Calibration for male and female subgroups was excellent. Racial subgroups were generally well-calibrated but showed some variation, particularly for the smallest subgroup of Other race. Moderate underprediction is present for Black patients at moderately high-risk levels of AD and at midrange risk levels of MS in the 0-month models (Figure 6). Calibration plots for the other timepoint models are available in Supplementary Figures 4, 5, and 6.
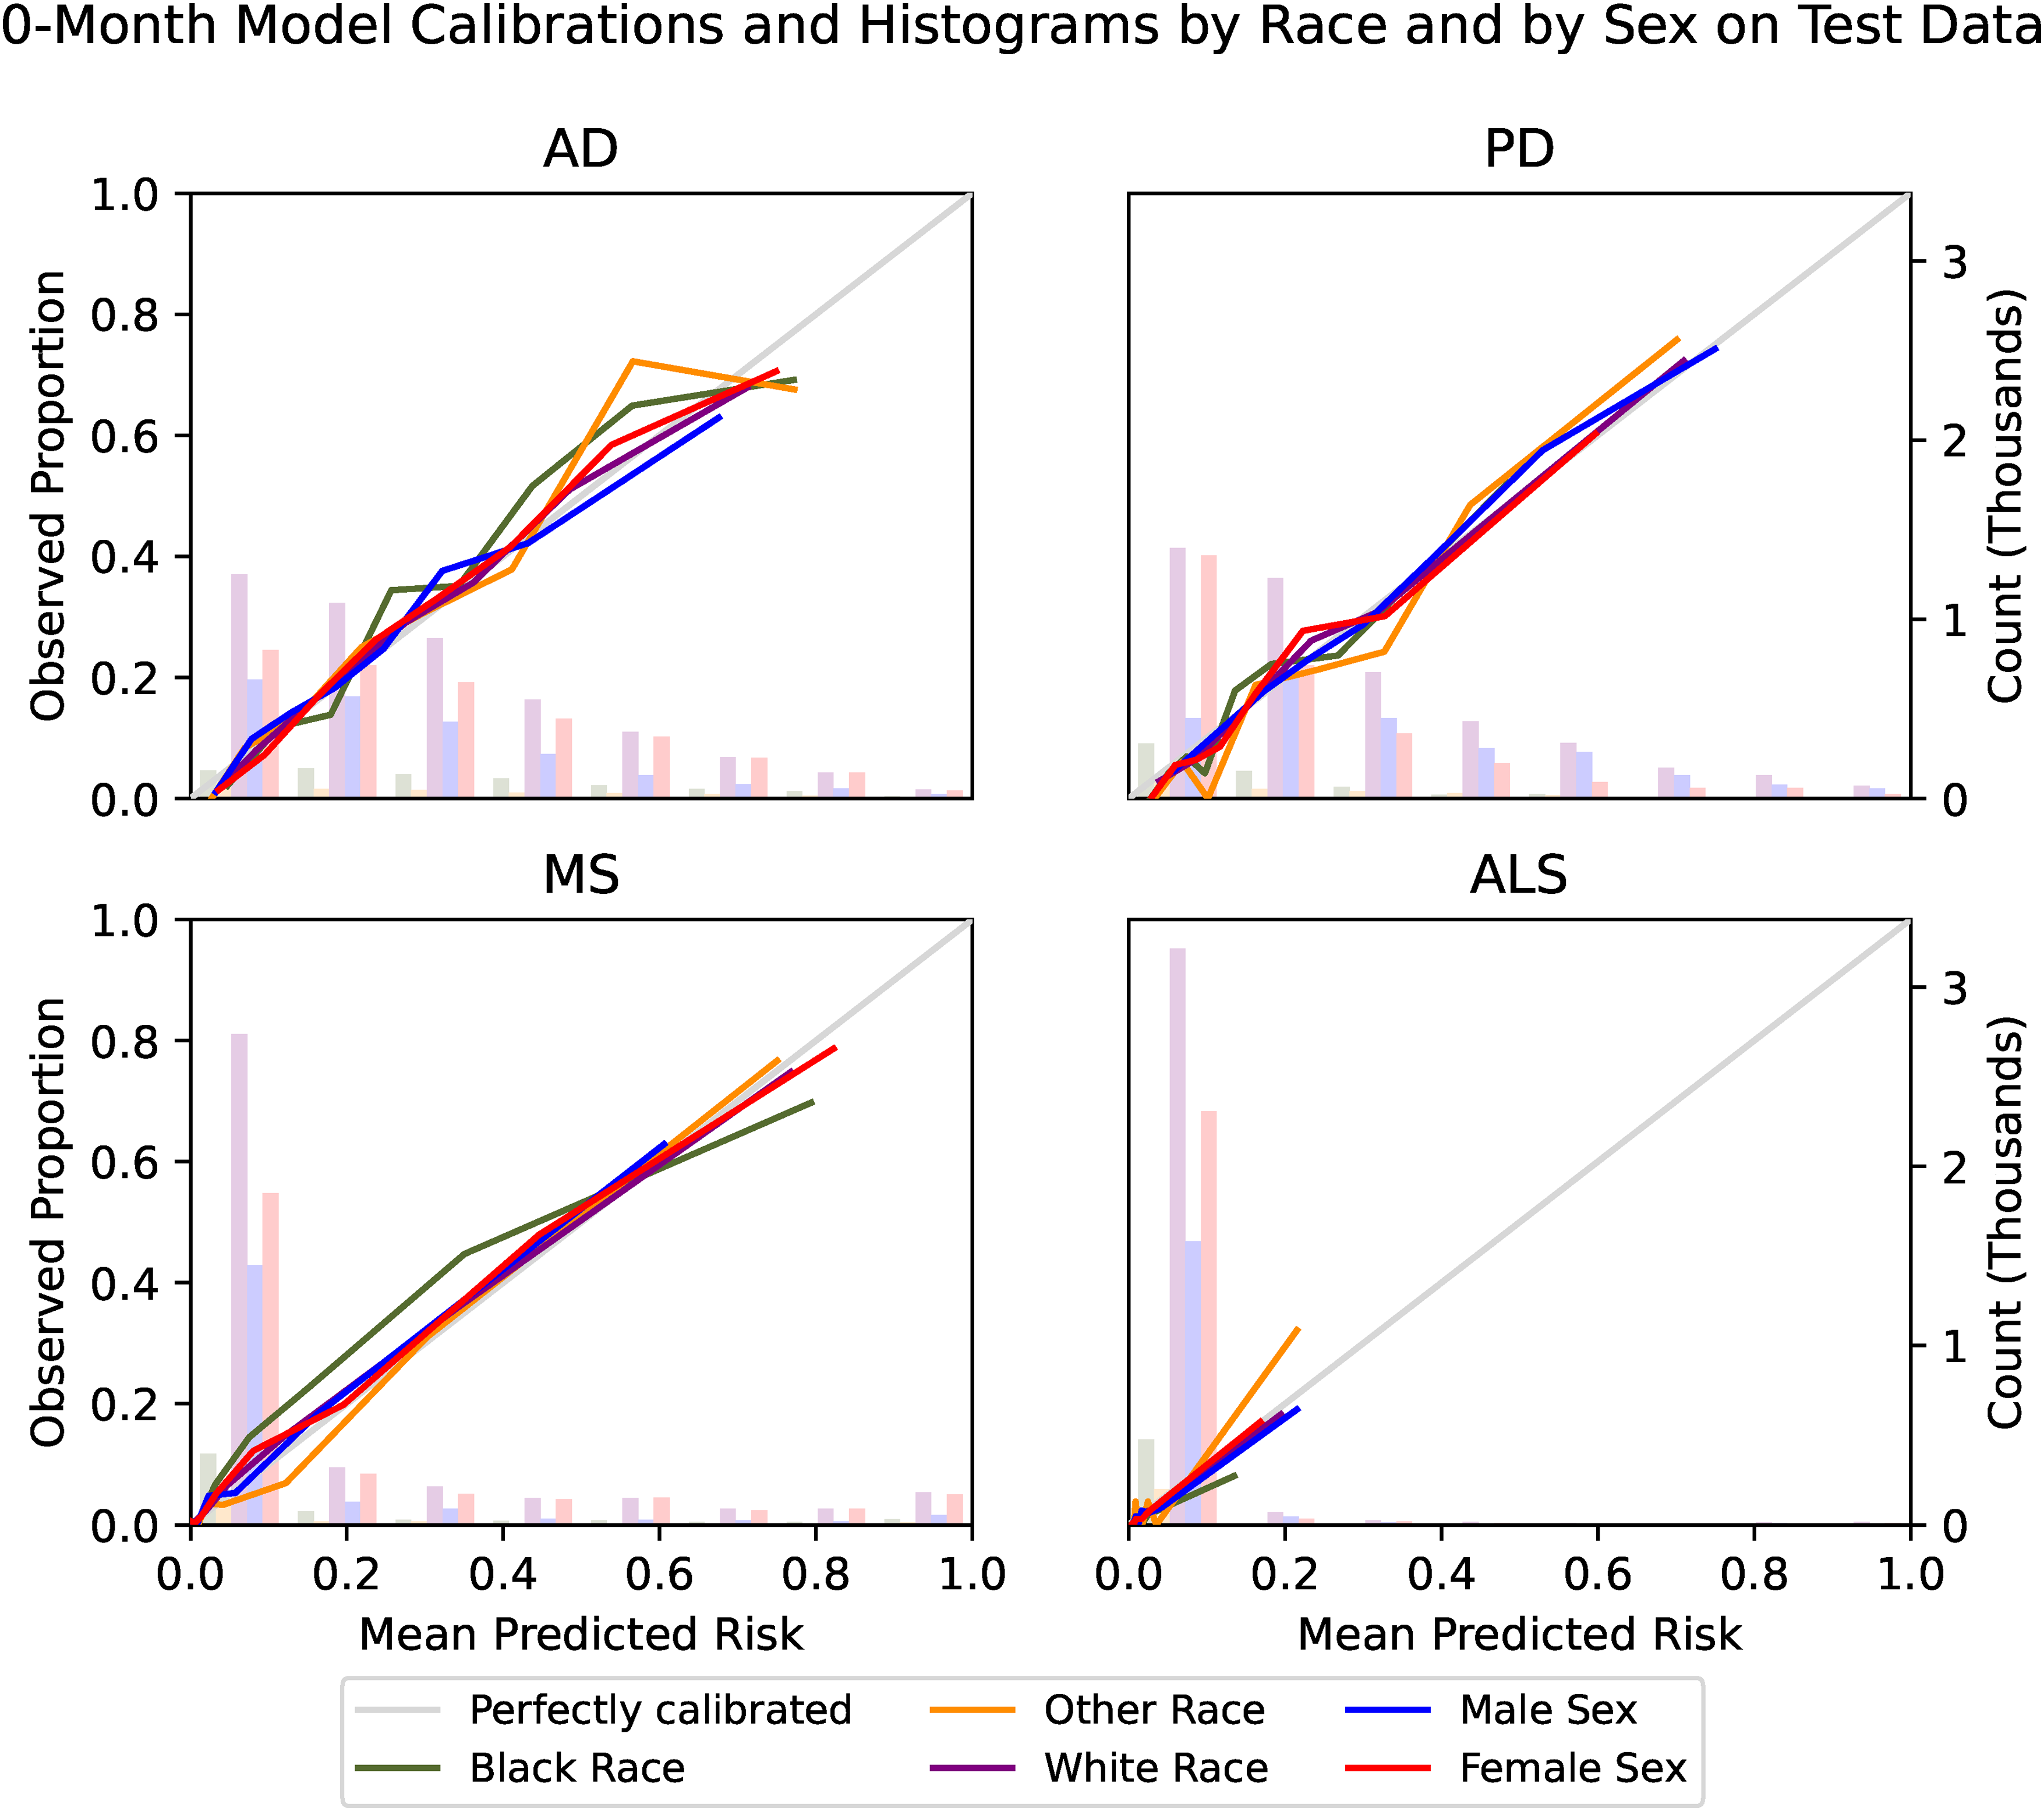
Calibration and prediction histograms by sex and by race. The mean predicted risk of disease is compared to the observed proportion of disease in eight quantiles by sex and by race. Bars indicate numbers of patients in evenly spaced bins of predicted risk and utilize the secondary y-axis. Male and female subgroups demonstrate excellent calibration, as measured by their adherence to the 45-degree line that represents perfect calibration. Racial subgroups were generally well-calibrated but showed some variation.
Additional models were developed with racial variables excluded to test whether this changes the performance between racial subgroups. It can be desirable to exclude protected attributes due to their sensitivity and perceived potential for bias. However, it is possible that in spite of this, models will determine proxies for race, incorporating the same bias but with less transparency. 55 Additionally, the exclusion of protected information could cause a failure to recognize a legitimate relationship with the outcome. 56 As there are potential advantages and disadvantages to the exclusion of racial variables, this modeling strategy is presented as a comparison to the full models.
The exclusion of race variables led to minor changes in overall AUC which were well within the 95% CI of the AUCs of the full models. AUC performance between racial subgroups was also consistent (Supplementary Table 3). Very few differences in the top five global features were noted. The original PD 24-month and 60-month models ranked Black race in the top five and, with the exclusion of this variable, additional variables of systolic max and HDL max entered the top five rankings (Supplementary Figures 7 and 8).
Calibration between racial subgroups was similar for most models; however, the PD models were a notable exception. Parkinson’s disease models excluding racial variables tended to overpredict diagnosis for Black patients (Figure 7). A relationship between Black race and PD diagnosis exists but has not been attributed to a single known cause.57,58 Recognizing that the EMR data may underrepresent true diagnoses, the model’s “over-prediction” could be used to correct for missed opportunities for true diagnosis and provide additional services in a population that may be currently underserved.
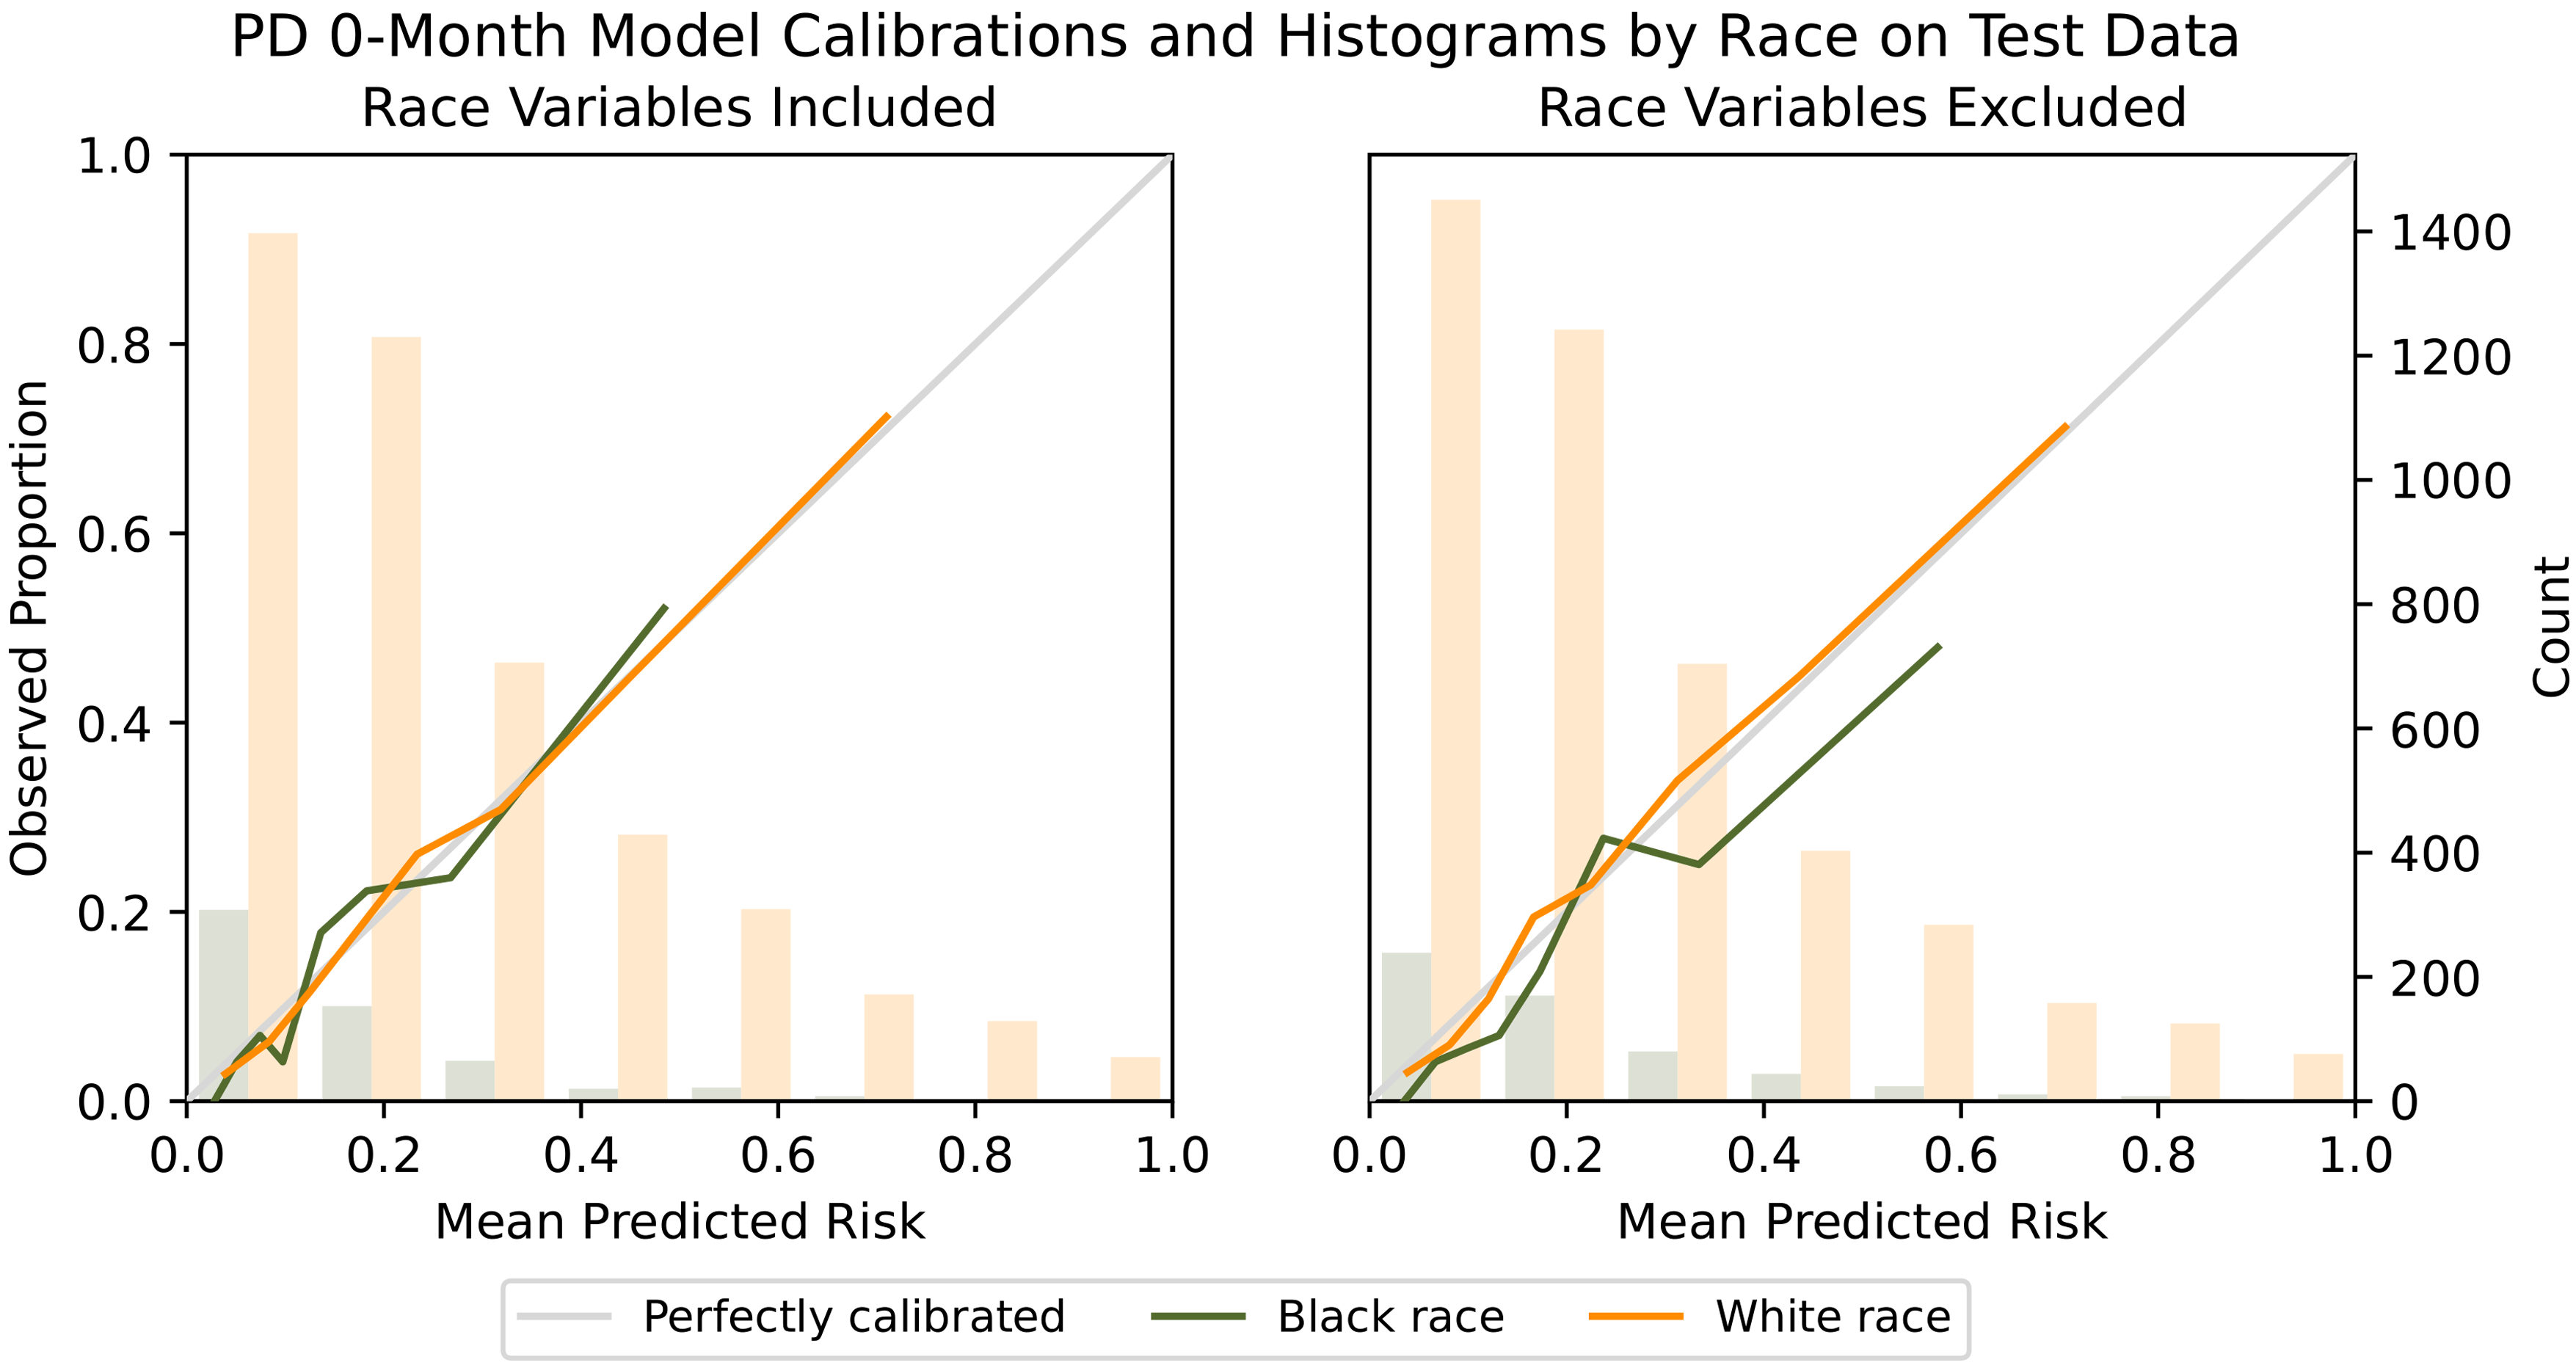
Comparison of calibration when racial variables are excluded. PD models excluding racial variables tended to overpredict diagnosis for Black patients, as seen by the mean predicted risk exceeding the observed proportion of diagnoses for several of the quantiles. Recognizing that the EMR data may underrepresent true diagnoses, models could be used to correct for missed opportunities for true diagnosis.
Discussion
The data in the analysis represent real-world progression toward neurological disease, highlighting important variables for clinical assessment. The routine collection of patient-reported outcomes such as PHQ-9 was instrumental in the quality of predictions. Considering the relative ease in the administration and integration of a screening tool that has been validated in multiple populations, including older adults, 59 the PHQ-9 could provide value to providers beyond its use for depression screening and tracking. Data from sleep studies were less commonly collected but were highly predictive in a subset of patients, in particular those eventually diagnosed with PD. Considering the prevalence of sleep dysfunction associated with PD and suggestions that REM sleep behavior disorder may be a prodromal marker for PD, 60 the ordering of a polysomnogram sleep study may be warranted in those patients who report disruption in sleep in combination with a change in PHQ-9 score.
The most important predictive variables included falls last year injury in all four diseases in the baseline models. Importantly, gait, while traditionally considered a motor task, is actually a very complex dual-task which requires the simultaneous processing of visual information and the execution of motor commands to control lower extremity musculature. 61 Falls history is routinely collected as part of hospitalizations using the Hester Davis Scale, 62 but is frequently overlooked at primary care visits, 63 highlighting the importance of evaluating functional gait in those patients 55+ years as part of their primary care.
There was variation in the predictive ability of the study's models across time and diseases. While the methodology for the development of all models was the same, the diseases themselves differ in prevalence, rate of progression, and symptoms. Three out of four of the 60-month prior models, as well as the ALS 24-month prior model, do not exceed a threshold of 0.70 AUC, a common benchmark for acceptable performance. However, all models at the 0-months and 12-months prior timepoints exceed this threshold, as well as AD, MS, and PD models at the 24-months prior timepoint, and MS models at the 60-months prior timepoint.
An advantage of this modeling approach is that data are readily available in the EMR, requiring no additional data collection, time, or expense for an initial screen. Individualized explanations through SHAP values allow clinicians to evaluate the predictions in the context of their medical expertise and the patient’s history before engaging in patient discussion, implementing preventive interventions, or ordering additional testing. Evaluation of the risks and benefits prior to patient engagement can mitigate possible harms, such as anxiety about an uncertain future problem.
In addition to the clinical utility for an individual patient, risk stratification can be used at a population level to create patient registries and triage by comparative disease risk. Quantitative risk stratification could prioritize outreach by care and research coordinators and facilitate forecasting of resources needed for managing the health care needs of an aging population or identifying subpopulations who could benefit from additional care. Further, the difficulty in navigating the healthcare system, which includes multiple visits with a range of providers and specialists, is socially and emotionally taxing to the patient 64 and delays the onset of medication, behavioral or physical interventions that may in some cases aid in the treatment or serve to slow disease progression. Even after diagnosis of neurological disease, PD in particular, many patients are not being treated by a movement disorders neurologist, which further complicates the effective management of the disease. 65 We are currently evaluating the feasibility of building additional disease-specific models that could be used by those providers, not specially trained in neurological disease management, to aid in treatment strategy and disease tracking.
Careful consideration of the effect on health disparities should be part of any intervention design, to ensure that resource allocation and opportunities are equitable. This begins with an examination of how the models use sensitive data and any differences in the prediction accuracy. The model fairness analysis found generally equitable performance of the models in discrimination and calibration by sex and by race, but these metrics rely on the accuracy of the diagnoses in the medical record, which may be biased. In models where the effect of removing racial variables was negligible, it is reasonable to conclude there are no differences as a function of race, however, it is possible that the models are using other variables to encode racial differences. In PD models, the exclusion of racial variables led to higher proportions of Black patients predicted to be diagnosed than were observed. We hypothesize that there may be underdiagnosis in the Black population, and the models excluding race could be used to direct more attention and services to this population, facilitating equitable treatment. In AD, MS, and ALS, we did not observe the same effect from the models excluding race. Additional fairness analyses are needed for specific interventions to ensure that the models provide equitable opportunities, and if not, post hoc calibration adjustments can be considered.
This study has limitations. The data are limited to patients and medical history available in the Cleveland Clinic medical record. Some health information is unavailable for patients also receiving treatment at other healthcare centers or receiving no treatment. The models rely on appropriate diagnoses of neurological disease in the medical record. The patient population may differ from the community population in motivation to seek care and access to care. Racial disparities in healthcare access and utilization have been noted in neurological care. 40 Although patients of Black and White race were well-represented in this population, other minority groups had less representation. Additional research on the applicability of the risk predictions in a prospective cohort and generalizability to another health system’s EMR data should be completed.
As additional technologies for quantitative assessment are introduced into routine clinical care, such as simple functional gait assessments or sleep evaluation through wearable technology, the predictive ability of EMR data will increase. Clinical practice and data collection among healthcare systems varies, and it is likely that models trained on a healthcare system's own data will perform best in their populations. With explainable methods, knowledge about the workings of these models can be generalized and tested in other health care systems. It is important to share the results discovered from systematic comparisons of methods and data elements.
Conclusions
The results demonstrate that EMRs contain latent information that can be used for accurate risk stratification for neurological disorders, and modeling efforts are expected to improve with continuous improvement in EMR data collection and extraction. Health systems differ in their populations and data collection processes and are likely to benefit from tuning ML algorithms to their own EMR data, but interpretable ML allows data elements, modeling techniques, and outcomes of models to be shared and built upon. The importance of patient-reported outcomes, sleep assessments, and monitoring the incidence and conditions contributing to falls in these models can inform healthcare providers about prognostic risk factors to assess in their own patients. Risk stratification may be used in the care of individual patients or in population health management. It is important that interpretability and fairness be considered in both the model development process and in the clinical workflows that use the predictions.
Supplemental Material
sj-docx-1-dhj-10.1177_20552076241249286 - Supplemental material for Explainable machine learning for predicting conversion to neurological disease: Results from 52,939 medical records
Supplemental material, sj-docx-1-dhj-10.1177_20552076241249286 for Explainable machine learning for predicting conversion to neurological disease: Results from 52,939 medical records by Christina Felix, Joshua D Johnston, Kelsey Owen, Emil Shirima, Sidney R Hinds, Kenneth D Mandl, Alex Milinovich and Jay L Alberts in DIGITAL HEALTH
Supplemental Material
sj-docx-2-dhj-10.1177_20552076241249286 - Supplemental material for Explainable machine learning for predicting conversion to neurological disease: Results from 52,939 medical records
Supplemental material, sj-docx-2-dhj-10.1177_20552076241249286 for Explainable machine learning for predicting conversion to neurological disease: Results from 52,939 medical records by Christina Felix, Joshua D Johnston, Kelsey Owen, Emil Shirima, Sidney R Hinds, Kenneth D Mandl, Alex Milinovich and Jay L Alberts in DIGITAL HEALTH
Footnotes
Acknowledgements
The authors wish to acknowledge Sean C. Sansiveri, Peter Haaland, PhD, and William P. Meehan III, MD for their invaluable comments and insight.
Code availability
The software packages used are open source and cited in “Methods” section.
Contributorship
C.F. participated in literature search, study design, data collection, data analysis, figures, and manuscript preparation. J.J. performed calculation of derived variables and model building. A.M. performed data collection and cleaning. E.S. participated in data analysis and figures. S.H. participated in the literature search and data interpretation. K.M. participated in study design and manuscript preparation. K.O. participated in the literature search. J.A. is the guarantor and participated in literature search, data interpretation, and manuscript preparation. All authors have approved the final content of the manuscript.
Data availability
The medical record data that support this study are available in a deidentified form from Cleveland Clinic, but restrictions apply to the availability of these data.
Declaration of conflicting interests
The authors declared the following potential conflicts of interest with respect to the research, authorship, and/or publication of this article: S.H. reports consulting fees from SCS Consulting LLC, Prevent Biometrics, and Synaptek, and positions with the NFL Players Association as Chief of Health Equity and Deputy Medical Director, and with the MLS Players Association as Medical Director.
Ethical approval
This study was approved by the Cleveland Clinic Institutional Review Board as a minimal risk study with a waiver of individual informed consent.
Funding
The authors disclosed receipt of the following financial support for the research, authorship, and/or publication of this article: This work was supported by the National Football League Players Association and Edward and Barbara Bell Endowed Chair to JLA.
Guarantor
JLA.
Materials & correspondence
Correspondence and material requests should be addressed to the corresponding author. Jay L. Alberts, PhD, Department of Biomedical Engineering, Center for Neurological Restoration, Cleveland Clinic Foundation, 9500 Euclid Ave., Cleveland, OH 44195 (E-mail: albertj@ccf.org).
Supplemental material
Supplemental material for this article is available online.
References
Supplementary Material
Please find the following supplemental material available below.
For Open Access articles published under a Creative Commons License, all supplemental material carries the same license as the article it is associated with.
For non-Open Access articles published, all supplemental material carries a non-exclusive license, and permission requests for re-use of supplemental material or any part of supplemental material shall be sent directly to the copyright owner as specified in the copyright notice associated with the article.