
Abstract
Precision pharmacotherapy of diabetes requires judicious selection of the optimal therapeutic agent for individual patients. Artificial intelligence (AI), a swiftly expanding discipline, holds substantial potential to transform current practices in diabetes diagnosis and management. This manuscript provides a comprehensive review of contemporary research investigating drug responses in patient subgroups, stratified via either supervised or unsupervised machine learning approaches. The prevalent algorithmic workflow for investigating drug responses using machine learning involves cohort selection, data processing, predictor selection, development and validation of machine learning methods, subgroup allocation, and subsequent analysis of drug response. Despite the promising feature, current research does not yet provide sufficient evidence to implement machine learning algorithms into routine clinical practice, due to a lack of simplicity, validation, or demonstrated efficacy. Nevertheless, we anticipate that the evolving evidence base will increasingly substantiate the role of machine learning in molding precision pharmacotherapy for diabetes.
Introduction
Diabetes is a highly heterogeneous disease. The rationale of precision medicine is to find the right therapy for the right patient at the right time. The concept of implementing individualized therapy in diabetes patients is not novel; for instance, insulin therapy has been considered based on patients’ endogenous insulin secretion levels since approximately half a century ago. The main treatment for patients with obvious insulin deficiency, such as those with type 1 diabetes, is exogenous insulin administration. Recent advances in disease etiology and mechanism, encompassing big data, biomarkers, genetics, epigenetics, high-throughput sequencing, proteomics, metabolomics, and gut microbiota, have catalyzed a paradigm shift in diabetes management. In 2020, the European Association for the Study of Diabetes (EASD) and American Diabetes Association (ADA) published their consensus report on precision medicine in diabetes, subdivided into components such as diagnosis, precision therapeutic, precision prevention, precision treatment, precision prognostics, and precision monitoring. 1 A number of studies have been conducted to bridge the evidence gap in the clinical application of precision medicine in diabetes care. Notably, precision therapeutics focuses on refining the classification of patients and selecting the most suitable diabetes management regimes. A variety of technologies have been employed to this end, among which artificial intelligence (AI) has garnered substantial attention.
AI is being heralded as the catalyst for the fourth industrial revolution. Machine learning, a subset of AI, is utilized in the creation of automated systems that learn from experience. The basic process of machine learning involves learning and application. 2 Its commercial success in areas such as computer vision, speech recognition, and natural language processing has stimulated the application of machine learning to many other fields. Within healthcare, machine learning has become a focal point for physicians and clinicians aiming to automate and streamline medical procedures. 3 Machine learning has the potential to enhance predictive accuracy compared to traditional methods using identical variables and cohorts, 4 thus providing a correct estimation of diabetes incidence and progression. However, robust evidence is necessary before clinicians can confidently adopt these techniques in making clinical decisions, especially on individualized drug treatment regimes. The objective of this review is to evaluate whether the current evidence sufficiently supports the integration of machine learning to reshape precision pharmacotherapy for diabetes.
Machine learning
Machine learning is roughly divided into supervised learning and unsupervised learning. 5 Using supervised learning, a model is trained by learning the characteristics related to labeled outcomes, and unknown outcomes can be predicted using the trained model. Specifically, a classification algorithm can be used to predict categorized outcomes, while a regression algorithm can be adopted to predict continuous outcomes. Typical supervised machine learning algorithms include linear regression, random forest, gradient boosting, support vector machines, and artificial neural networks (ANN).
Unlike supervised learning, unsupervised learning does not have a predetermined outcome. The models divided the data automatically according to their similarity in density, structure, distance, or other features. Clustering is the most commonly used unsupervised learning method, including K means or K medium clustering, Density-Based Spatial Clustering of Applications with Noise (DBSCAN), and deep belief networks (Figure 1)

Machine learning algorithms (adapted from Alpaydin et al. 5 ).
Recently, deep learning, as an advanced form of machine learning was applied to medical studies. Using deep learning, researchers can solve difficult problems that shallow architectures were unable to address due to their dimensionality limitations. In deep learning, multiple layers are trained unsupervised, and then all layers are fine-tuned under supervision. This allows the discovery of robust features and precision prediction of outcomes. 6
Machine learning and its application in diabetes
Machine learning algorithms could be applied to precision medicine in diabetes in many ways. Supervised learning can be trained to predict a specific outcome, e.g., incident diabetes,7–9 glycemic control, 10 hypoglycemia,11–13 development of complications,14,15 and the glucose-lowering effect of an intervention. 16 Unsupervised machine learning methods were widely used to categorize and stratify patients. For example, K means data-driven clusters divided diabetes into five different categories and each subgroup had a distinct glucose trajectory and complication development. 17 Alternatively, Bayesian nonnegative matrix factorization (bNMF) clustering was used to identify five clusters of type 2 diabetes mellitus (T2DM), with each cluster displaying differently in clinical outcomes including coronary artery disease (CAD) and stroke. 18 Data-driven clustering can also be used to define subgroups with different cardiovascular risks in participants with T2DM with established atherosclerotic cardiovascular disease (ASCVD). 19 Because of its high accuracy, deep learning has been applied to guide the insulin pump dosage system in type 1 diabetes mellitus (T1DM) 20 and guide insulin dosage and glycemic response in T2DM, 21 which has been validated in clinical trials and implemented in clinics. 22 Additionally, deep learning was used to read fundus photos not only for diabetes retinopathy23,24 but also for diabetes kidney disease. 25
Machine learning and deep learning algorithms have facilitated the process of protein structure analysis and design of novel antidiabetic drugs26,27 or screening for chemicals of novel drug development targets. 28 In addition, novel biomarkers of diabetes and other metabolic diseases are being identified by machine learning and deep learning. These biomarkers also involve multi-omic signatures, e.g., functional connectome on magnetic resonance imaging (MRI) image,29,30 metabolomics, 31 and epigenetics and genetics. 32 The application of deep learning in diabetes-related tasks was properly summarized and reviewed.33–35
Predicting diabetes and its cardiovascular risks using machine learning
Numerous studies have utilized machine learning to predict the incidence or presence of diabetes, largely due to the high diagnostic accuracy of these models. Decision trees, logistic regression, and random forest were commonly employed algorithms for diabetes prediction. Two meta-analyses suggested the average receiver operating characteristic area under the curve (ROCAUC) of these models to be between 0.81 (95% confidence interval (CI) of 0.79 to 0.83) and 0.86 (0.82 to 0.89).36,37 Predictive variables incorporate a range of clinical anthropometric measurements, such as age, gender, and body mass index (BMI), laboratory test results, lifestyle factors, and high-dimensional variables like physical activity tracker data, 38 electrocardiograms (ECGs), 39 and chest radiograph. 40 Deep learning typically performs well when high-dimensional variables are included.40,41 The number of machine learning-based diabetes prediction models is steadily increasing since chatbot-based AI tools now permit clinicians to generate models using various attributes via a simple user interface. 42
A central topic in diabetes management is the micro- and macro-vascular complications of diabetes patients. Cardiovascular disease remains the primary cause of mortality in this population, yet robust tools for estimating cardiovascular risks are lacking. General cardiovascular risk estimation models, e.g., the Framingham score, may be not applicable to participants with diabetes. 43 Current conventional cardiovascular risk scoring systems, such as the Action in Diabetes and Vascular Disease: Preterax and Diamicron-MR Controlled Evaluation (ADVANCE) 44 and SCORE2-Diabetes, 45 performed well within their development cohorts; however, their external validity is less satisfactory 46 or not yet tested in the global area. 45 Machine learning algorithms can be potentially a robust tool to estimate cardiovascular complications. A recent systemic review demonstrated that the ROC AUC for derivation cohorts varied from 0.69 to 0.77. AI models achieved better performance than conventional models in some specific scenarios (ROC AUC 0.75 for AI models and 0.69 for conventional risk scores). However, only one out of the 176 AI models underwent an external validation study. 46 Further studies are warranted to enhance the predictive accuracy of these models and expand the external validation. This will facilitate the implementation of machine learning-based algorithms in clinical settings.
Evaluating machine learning methods in diabetes pharmacotherapy
Even if machine learning-based algorithms had achieved high performance in diabetes and relative complication estimation, there was a missing link in a very critical question: can machine learning shape current strategies for pharmacotherapy in diabetes patients?
Research efforts geared towards seeking empirical support for the application of machine learning in diabetes treatment predominantly follow two distinct strategies, as delineated in Figure 2. Typically, cohort data are processed, and predicting variables are selected. For supervised learning, a specific endpoint was chosen, and the cohort was divided into development cohort and internal validation cohorts. Ideally, an external cohort should be used to test the model performance. Subgroups of patients with different endpoint risks can be stratified using the model. For unsupervised data-driven machine learning, data were automatically subdivided into groups, and clusters’ characteristics, disease trajectory, and drug responses were analyzed. Given the absence of internal validation for unsupervised machine learning approaches, the external validation of identified subgroups assures heightened significance. The researchers evaluated the drug response in these subgroups generated by either supervised machine learning or unsupervised machine learning by assessing the treatment-by-group interaction. (Figure 2) The main studies evaluating the drug responses in subgroups derived using unsupervised learning algorithms and supervised learning algorithms were summarized in Tables 1 and 2, respectively.

Algorithm of machine learning-based algorithms to predict drug responses.
Different responses to pharmacotherapy in subgroups stratified using unsupervised machine learning.
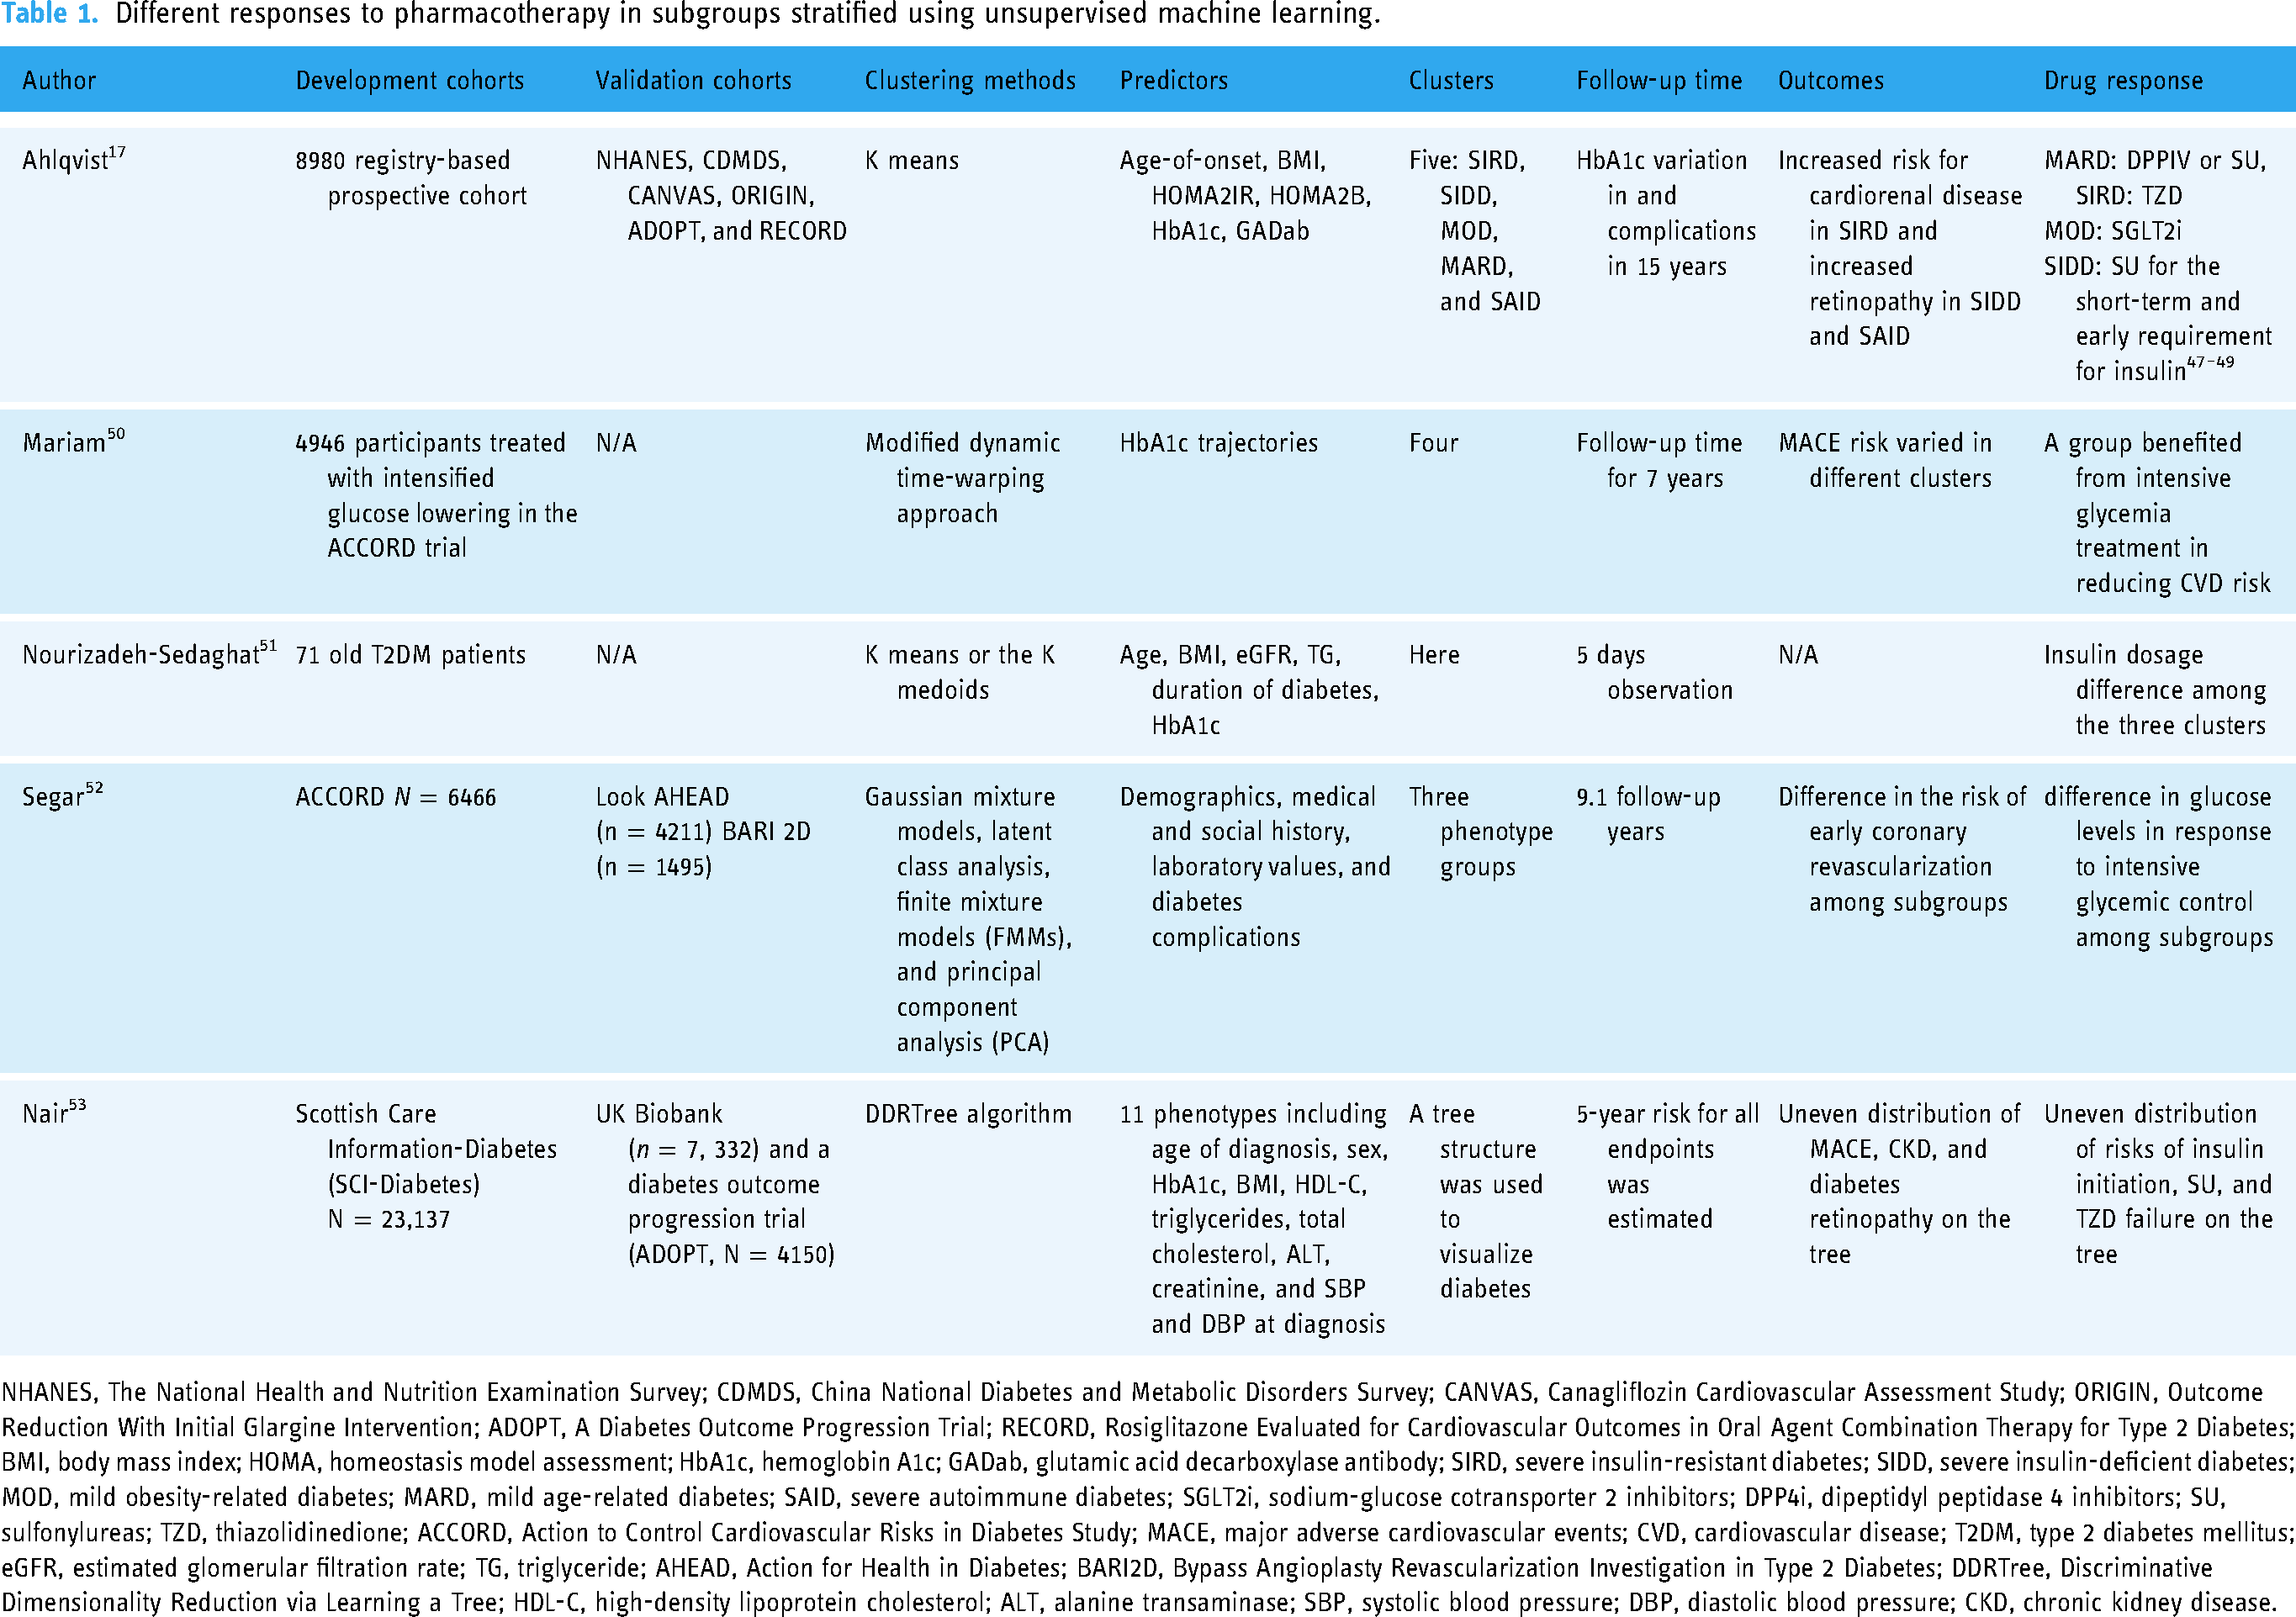
NHANES, The National Health and Nutrition Examination Survey; CDMDS, China National Diabetes and Metabolic Disorders Survey; CANVAS, Canagliflozin Cardiovascular Assessment Study; ORIGIN, Outcome Reduction With Initial Glargine Intervention; ADOPT, A Diabetes Outcome Progression Trial; RECORD, Rosiglitazone Evaluated for Cardiovascular Outcomes in Oral Agent Combination Therapy for Type 2 Diabetes; BMI, body mass index; HOMA, homeostasis model assessment; HbA1c, hemoglobin A1c; GADab, glutamic acid decarboxylase antibody; SIRD, severe insulin-resistant diabetes; SIDD, severe insulin-deficient diabetes; MOD, mild obesity-related diabetes; MARD, mild age-related diabetes; SAID, severe autoimmune diabetes; SGLT2i, sodium-glucose cotransporter 2 inhibitors; DPP4i, dipeptidyl peptidase 4 inhibitors; SU, sulfonylureas; TZD, thiazolidinedione; ACCORD, Action to Control Cardiovascular Risks in Diabetes Study; MACE, major adverse cardiovascular events; CVD, cardiovascular disease; T2DM, type 2 diabetes mellitus; eGFR, estimated glomerular filtration rate; TG, triglyceride; AHEAD, Action for Health in Diabetes; BARI2D, Bypass Angioplasty Revascularization Investigation in Type 2 Diabetes; DDRTree, Discriminative Dimensionality Reduction via Learning a Tree; HDL-C, high-density lipoprotein cholesterol; ALT, alanine transaminase; SBP, systolic blood pressure; DBP, diastolic blood pressure; CKD, chronic kidney disease.
Predicting responses to pharmacotherapy in subgroups stratified using supervised machine learning.

RMSE, root mean squared error; MAPE, mean absolute percentage error; GBM, gradient boosting machines; GLM, generalized linear model; CART, classification and regression tree; BART, Bayesian additive regression trees; RNN, recurrent neural network; GRU, gated recurrent unit; LSTM, long-short term memory; EN, elastic network; DNN, deep neural networks; LASSO, least absolute shrinkage and selection operator; RF, random forest; SVM, support vector machines; LR, logistic regression; BP-ANN, backpropagation—artificial neural network; eGFR, estimated glomerular filtration rate; ROC AUC, area under the curve of the receiver operating characteristic curve; EHR, electronic health record; RCT, randomized clinical trial; CANVAS, Canagliflozin Cardiovascular Assessment Study; NHANES, The National Health and Nutrition Examination Survey; CDMDS, China National Diabetes and Metabolic Disorders Survey; ORIGIN, Outcome Reduction with Initial Glargine Intervention; ADOPT, A Diabetes Outcome Progression Trial; RECORD, Rosiglitazone Evaluated for Cardiovascular Outcomes in Oral Agent Combination Therapy for Type 2 Diabetes; SGLT2i, sodium-glucose cotransporter 2 inhibitors; DPP4i, dipeptidyl peptidase 4 inhibitors
Cohorts
There are no specific requirements for cohort sample size; conventionally, the preference leans towards larger sample sizes. To validate a clinical outcome, most studies utilized prospective or retrospective cohorts rather than cross-sectional studies. The follow-up periods in these studies range widely from as short as 7 days to as long as 20 years, depending on the selected endpoints. The types of studies involve registry-based studies, 17 hospital-based cohorts, 54 epidemiological surveys, 69 electronic health records (EHRs), medical insurance dataset, 68 and clinical trials.50,56
Data processing
Raw data from cohorts can be voluminous and unstructured, so data preprocessing, including cleaning, normalization, and standardization of these heterogeneous data, is essential. Usually, normalization and standardization of the data are necessary to fit the data for machine learning algorithms or statistical testing. Additionally, dimensionality reduction techniques such as principal component analysis (PCA) or t-distributed stochastic neighbor embedding (t-SNE) can be employed to handle high-dimensional data. 70
Dealing with missing data is an imperative issue in machine learning analysis. Missing data can be handled using simple deletion, multiple imputation, full information maximum likelihood, and expectation-maximization algorithm 71 or within the machine learning algorithm, e.g., decision trees. 72 Usually, multiple imputation is only applied if less than 30% of the variables are missing. 69 The nature of missing data is important for choosing methods to handle missing data, since whether the data are missing partly/completely or not at fandom could affect the model. Usually, sensitivity analysis regarding various data processing techniques is required 47 for model development and validation.
Selecting predictors
Machine learning and deep learning allow clinicians to use multi-nominal data as inputs. In spite of traditional clinical data including medical history, physical examination, and laboratory measurements, metabolites, 54 fundus photos, 25 radiographic images, 40 continuous glucose monitoring (CGM) data 73 and genetic information 74 can be candidate predictors. Regardless of the architecture of machine learning models, the selection of predictors is of critical importance in model development. The accuracy of the model hinges largely on the strength of the association between these predictors and the outcomes. Some studies manually chose common clinical variables, such as age, BMI, hemoglobin A1c (HbA1c), homeostasis model assessment (HOMA2IR), and HOMA2B. 17 Most studies initially choose as many parameters as they can and then select suitable predictors using LASSO regression algorithms 9 or other algorithms. Most supervised machine learning algorithms facilitate the computation of variable importance during model derivation. 36 The importance assigned to a variable within a model underscores the correlation between that variable and the endpoints.
Endpoint selection
For supervised machine learning, a specific endpoint should be determined prior to model development. The most common selected endpoints for drug selection are HbA1c decline and HbA1c on-target rate.56,59 Hypoglycemic episodes, one of the most common side effects of hypoglycemic therapies and the key consideration of insulin delivery systems, are usually selected as the safety endpoint. 75 Drug-specific safety endpoints, e.g., lower limb amputation for canagliflozin 66 and acute kidney injury for sodium-dependent glucose transporters 2(SGLT2i), 62 were chosen in specific cohorts. There is a particular focus on models predicting cardiovascular and renal endpoints, including major adverse cardiovascular events (MACE) and albuminuria progress.47,65,68
For unsupervised machine learning, multi-endpoints are evaluated among subgroups in most studies,17,64 and subgroups may have different disease trajectories and cardiovascular outcomes. As an exception, a study used soft clustering methods such as Gaussian mixture models and finite mixture models (FMMs) 52 to predict a single outcome: the atherosclerotic cardiovascular disease risk in type 2 diabetes patients. 52 However, the subgroups were not replicated in other cohorts. There was also a study that identified subgroups with different risks of recurring CVD events; however, these subtypes were not associated with drug treatment decisions. 19
Development and validation of supervised machine learning models
The basic paradigm for developing supervised machine learning algorithms encompasses three stages: derivation, internal validation, and external validation. Cohorts are typically partitioned into training and internal validation datasets. Models are trained using predictors and labeled outcomes. The internal validation datasets, which bear high similarity to the training set, serve to assess the algorithm's predictive capacity for outcomes. To avoid sampling bias, a five- or 10-fold cross-validation is always applied for model deviation and internal validation. The parameters are finely tuned to achieve the highest internal prediction accuracy. Usually, it would be ideal to assess the prediction accuracy both in the internal validation dataset and a spare external validation cohort to avoid model overfitting, which commonly happens in complex models of machine learning and deep learning. C-statistics or the area under the curve of the receiver operator curve (ROC AUC) are usually used to assess diagnostic accuracy. Root mean square error (RMSE) and mean absolute percentage error (MAPE) are typically used to estimate the accuracy of the regression models. Other evaluations include error rates, F1 score, and decision curve analysis (DCA). 61
Subgroups generated by unsupervised learning
Usually, supervised learning algorithms can be used to predict the presence of an outcome in patients treated with certain drugs 59 or stratify participants into groups according to their progression risks or a threshold of predicted outcomes. 47 Clusters are generated based on selected features. Optimal group number is critical, and there are a few methods to determine the optimal subgroup numbers. For example, Gap Statistic, Elbow Method, Silhouette Coefficient, and Bayesian information criterion (BIC) are used to determine the optimal K number for K means clustering. 76 Time-series data such as CGM data usually require specific clustering methods such as longitudinal finite mixture modeling (LFMM), which contains latent class growth analysis (LCGA), group-based trajectory models (GBTM), and growth mixture modeling (GMM). 77 Unsupervised algorithms offer numerous ways to generate subgroups, which necessitate extensive validation of these subgroups. Clinicians only adopt those subgroups that consistently demonstrate influence on key parameters, including glucose endpoints, micro- and macro-vascular complications, and drug responses.
Differences in drug responses
Previous reviews mostly assessed the prediction accuracy of machine learning models. However, even using models with nearly 100% accuracy, it is difficult to be accepted by clinicians unless there is a treatment-by-group interaction between a specific drug and subgroups generated by this model. Algorithms divided cohorts into subgroups and “p” for interaction between drug effect and subgroup was assessed. This process serves to underline the clinical utility of the algorithms.47,50 For decision-making, randomized controlled trials (RCTs) offer high-level clinical evidence. Therefore, subgroup analysis or post hoc analysis can provide exploratory evidence for the algorithm's applicability in drug selection, but is not sufficient enough to bring changes to current clinical practice. In cohorts that have not been randomized, alternative comparisons may also uncover potential treatment differences among drugs. In a study using EHR, the patients on SGLT2i and dipeptidyl peptidase 4 inhibitors (DPP4i) were matched using propensity scoring, and the class effect of these drugs on renal function preservation was examined. 68 These methods could potentially be used to assess the treatment-by-group interaction in machine learning-identified subgroups.
Current clinical evidence
Current supervised learning algorithms have acceptable diagnostic accuracy, and they may help to guide the use of insulin, oral hypoglycemic drugs, and glucagon-like peptide-1 receptor agonist (GLP-1RA) with regard to their HbA1c-lowering effects, HbA1c on-target rates, hypoglycemic episodes, renal function preservation, and cardiovascular outcomes. Some studies were able to identify the class effect of two active drugs 68 or drug versus placebo 67 effect on a specific outcome. Some studies predicted the glycemic response of a single therapy such as insulin 59 and metformin. 58 Despite the promising potential, two primary obstacles hinder the clinical implementation of these algorithms. Firstly, the complexity of some machine learning models remains a significant challenge for clinicians. Certain studies even employed more than a hundred variables as inputs, so the algorithm became too time-consuming to be applicated in routine clinical practice. As an improvement, a study developed online tools with nine inputs to facilitate the use of their algorithm in clinics 67 and another study used only four variables and used easy-to-use cutoff values to define different subgroups to predict the mortality risk of intensive hypoglycemic therapy. 64 For clinical practicality, the models with fewer and simpler predictors are generally more acceptable. However, there might be a trade-off between model simplicity and accuracy. Secondly, another issue is the external validation of the algorithms. Few algorithms have undergone extensive validation in diverse cohorts. Precision medicine is an intricate process. For example, the models specifically designed for canagliflozin may not be suitable for other SGLT2 inhibitors, thus constraining the broader applicability of these models. Therefore, external validation is imperative to ensure the generalizability of these models.
For data-driven clusters, the external validity was much more accepted than supervised machine learning. The All New Diabetics In Scania (ANDIS) study was used to generate five clusters using simple variables and the model was stable in many ethnic groups and clinical trials. To date, external validation of ANDIS clusters was conducted in more than 20 cohorts, although a specific ethnic cluster may exist in India. 78 Evidence was built on different responses of clusters to insulin, 48 sulfonylureas (SU), thiazolidinedione (TZD), metformin, 49 SGLT2i, 47 and metabolic surgery 79 using data from clinical trials and retrospective cohorts. Generally, SU may be used for severe insulin-deficient diabetes (SIDD) to control short-term hyperglycemia; however, the sustainability of blood glucose control was not optimal. DPP4i can be used in mild age-related diabetes (MARD) for the high glycemic on-target rate in this group and low incidence of hypoglycemia. It was found that severe insulin-resistant diabetes (SIRD) may respond better to TZD for better glycemic control 49 and mild obesity-related diabetes (MOD) achieved the highest glycemic decline using SGLT2i compared to DPP4i and SU. 47 However, the evidence for whether data-driven clusters responded differently to GLP-1RA was missing, although disease progression was described in GLP-1-RA cohorts. 80 There was a lack of validation for other subgroups derived from unsupervised learning to predict drug responses.19,50 Before data-driven clusters can be used in clinics, there are still a few things that need to be addressed. (1) Inconsistencies have been observed in the progression of complications across different cohorts, which might be attributed to cluster transitions that occur in some patients. 81 This suggests that the use of simple baseline predictors to create subgroups may not adequately refine responses to drugs, given that both glycemic control and cardiorenal risks are dynamic processes. (2) Although clusters may theoretically respond differently to drug therapies in terms of complication development, 82 few studies have observed the effect of pharmacotherapy can alter the cardio-renal in a specific subgroup. 47 (3) Studies suggested that data-driven clusters were not as effective as simple clinical measurements, e.g., HbA1c, age, and BMI, in distinguishing treatment effects. 49 This may limit the application of this algorithm. In summary, substantial work remains before this method can guide clinical decision-making in pharmacotherapy effectively.
Conclusions
In current practice, machine learning methods are robust to predict clinical outcomes and even drug responses; however, they are not widely accepted to guide clinical decisions in precision diabetes pharmacotherapy. We hope machine learning can help clinicians precisely identify who may achieve the largest benefit from a certain drug.
Footnotes
Contributorship
XTZ and YNL did the literature research. XTZ was a major contributor to writing the manuscript. YNL created the figures. LJ reviewed the manuscript. All authors contributed to the article and approved the submitted version.
Declaration of conflicting interests
The authors declared no potential conflicts of interest with respect to the research, authorship, and/or publication of this article.
Funding
The authors disclosed receipt of the following financial support for the research, authorship, and/or publication of this article: This work was supported by the Beijing Nova Program of Science and Technology (grant number Z191100001119026).
Guarantor
XTZ