
Abstract
The exponential growth in academic and digital health data as well as analytical methods has ushered in a new age of digital epidemiology, however, the conceptual foundations, operational boundaries and translation mechanisms of this emerging field still remain insufficiently consolidated. This narrative review critically examines the historical underpinnings of digital epidemiology, tracing the evolution of its definitions and identifying its key challenges and policy implications through the lens of public health dashboards. Digital epidemiology began as simply the use of digital sources of data for epidemiology, but has over the years developed into a much larger domain that incorporates several other related concepts such as infodemiology, infoveillance, participatory surveillance, dashboards, etc. As we foray into this new domain, it is essential to confront the persisting challenges related to data quality, bias, representativeness, ethics and governance that are inherent in digital epidemiology. At the same time, the expanding role of public health dashboards within this field and key emerging innovations such as artificial intelligence and large language models need to be taken into account keeping in mind the risks of automation and need for evaluation framework. By framing dashboards as the operational nerve centre of digital epidemiology, this study provides a unified conceptual foundation for advancing the field of digital epidemiology towards sustainable, equitable and evidence-backed public health action.
Background
Digital epidemiology is set to revolutionize medical research by transforming data collection, presentation, storage and analysis methods, leading to more meaningful outcomes. The foundations for digital epidemiology were laid down in the early 2000s with the rise in user-generated content on the Internet as well as the rising trend of data digitalization. The advent of Web 2.0 technologies led to a rapid increase in user interaction and content creation, which prompted early applications of digital epidemiology, such as Google Flu trends and social media monitoring models. With recent revolutions in the digital landscape, the scope of digital epidemiology has expanded from merely monitoring infectious diseases to a broad range of health issues such as disease forecasting, early warning systems, research project management, co-occurrence and environmental health. The present narrative review aims to provide a subjective examination and critique of this emerging field, laying the foundation for a standardized definition and framework for digital epidemiology while also contextualizing the role of dashboards within this ecosystem.
Methodology
The methodology proposed by Sukhera (2022) was used to conduct a narrative review of the available literature on digital epidemiology. 1
Research question, rationale and scope
Since it was first conceptualized, digital epidemiology has witnessed rapid expansion resulting in many varying, and sometimes conflicting definitions that obscure its scope and purpose. Though some earlier literature do critically reflect on the theoretical coherence of this domain, much of the recent literature prioritizes only the technical innovation and application specific outcomes of digital epidemiology. Furthermore, as dashboards are increasingly being used for operationalizing digital epidemiology, there is a growing need to explicitly articulate its role and limitations within the larger domain.
To address this fragmentation in the conceptual landscape of digital epidemiology, this review traces the historical emergence and evolution of the field, identifying key milestones and paradigm shifts while also mapping its epistemic framework across three dimensions, that is, data sources, analytical methods and public health application. Based on this subjective synthesis, we attempt to consolidate the disparate perspectives by developing a comprehensive and integrative definition of digital epidemiology which provides a clear foundation for future research and practice. The study also delineates and critically appraises the role of dashboard within the digital epidemiology ecosystem, highlighting its role as a translational interface between complex data streams and public health action.
Study search and selection
A comprehensive search of peer reviewed literature was made on PubMed to capture studies that describe the conceptual development and application of digital epidemiology or any of its related constructs. The search query was designed in such a way that it incorporated all the sister terms related to digital epidemiology, and searches were made on the title and abstract of the study only, in order to ensure that the topic of concern was the major theme of the study and not a passing mention. The following Boolean expression was applied to conduct the search on PubMed: (“digital epidemiology"[Title/Abstract]) OR (infodemiolog*[Title/Abstract]) OR (infoveillance[Title/Abstract]) OR (((epidemiology[Title/Abstract]) OR (“disease surveillance"[Title/Abstract])) AND ((“social media"[Title/Abstract]) OR (twitter[Title/Abstract]) OR (digital data[Title/Abstract]) OR (dashboard[Title/Abstract]) OR (internet[Title/Abstract])))
Only articles written in the English language were included, and any preprints were excluded. Besides these, no other restrictions were applied to the search results with respect to the study design, publication date or geographic location.
Retrieved records were subsequently screened for relevance based on their contribution to the definition, conceptualization or application of digital epidemiology, and the final set of included studies were used to inform a critical and interpretive synthesis of literature.
Results
The search for peer-reviewed literature on PubMed yielded 2812 results, of which 1149 studies were not related to digital epidemiology and were excluded. The remaining 1663 articles were first grouped together based on the type of article, that is, Original Research or Review/Editorial/Perspectives. These were further categorized based on the core theme of the study, that is, big data analytics, comparison with traditional systems, computational modelling/forecasting, dashboards, description of digital data sources, description of digital tools, ethical studies, review of history, evolution or definition, Infodemiology, Infoveillance, participatory surveillance and public health application. The vast majority of the studies found were related to infodemiology (627) or infoveillance (553). Due to their success during COVID-19, 136 studies described dashboards, whereas another 92 studies were related to participatory surveillance. A relatively equal number of studies were based on direct public health applications of digital epidemiology and computational modelling or forecasting (50), while another 60 studies used big data analytics, 36 described digital sources of data and 25 described digital tools. Studies that elucidated the history, evolution and definitions of digital epidemiology were relatively few (20) while some also explored the ethical aspects of digital epidemiology (14).
Tracing the evolution of digital epidemiology: from computational aids to core practice
While digital epidemiology has only recently emerged as a distinct field, the application of computational data-driven thinking to epidemiological problems has been a long-standing effort. The Centre for Disease Control (CDC) in the USA first developed the SOCRATES programme (using FORTRAN) in 1976 to aid epidemiologists in defining epidemiological questions, storing data and summarizing results. 2 This was later updated to the more flexible Epidemiological Analysis System (EAS) between 1978 and 1984, and set up for remote access by the Georgia State Health Department. Later, in the mid-1980s, the EPI info platform was developed, providing various tools for conducting statistical analysis and outbreak investigation. 2
The advent of the digital age in the years that followed brought about a profound and transformative change in the means for data acquisition and analysis, allowing for insights that were previously unimaginable. As the Internet witnessed widespread adoption, digital footprints of a significant proportion of the general population became available, opening up new possibilities to leverage data for epidemiological purposes. Launched in 1994, ProMED became the first venture to draw upon this vast landscape of digital data by using emails and online platforms to crowdsource epidemiological data from unofficial sources (such as clinicians, researchers, media and local observers) and generate real-time reports of emerging infectious diseases. 3 Over the years, ProMED established itself as a critical epidemiological tool, playing a crucial role in identifying outbreaks of SARS, MERS and Ebola. 4 However, despite making effective use of digital data, ProMED was largely dependent on human experts to vet and write reports. Advancements in computational power and machine learning algorithms have made it possible to automate systems for extracting information. This prompted the development of HealthMap in 2006, which used advanced machine learning algorithms for automatic aggregation of online sources to predict disease outbreaks and was one of the first systems, along with ProMED, that identified the spread of a pneumonia-like infection, later identified as COVID-19, in Wuhan, China in 2019. 5 Around the same time, the potential of extracting practical epidemiological inferences from information demand (in the form of search queries) in addition to information supply (published websites and blogs) was being explored, a discipline that was later coined the term infodemiology by Gunther Eysenbach. 6 Additionally, the application of infodemiology for surveillance was termed infoveillance. 7 These fields found a typical intersection with the emerging concepts of digital epidemiology in the development of Google Flu Trends in 2008, which tracked syndromic search queries to provide near-real-time tracking of influenza-like infections, or ‘nowcasting’. Though the initiative subsequently failed to make accurate predictions, primarily as a result of the non-specific nature of search queries and lack of validation with epidemiological data, it generated immense enthusiasm. It exposed fundamental challenges such as data quality, algorithm biases and the need for validation. 8 It also encouraged the development of similar initiatives such as Flu Near You, 9 InfluenzaNet 10 and FluTracking 11 across the world. In recent years, the COVID-19 pandemic has significantly accelerated the adoption and integration of digital epidemiology into public health systems, and numerous dashboards have been built to cater to various public health needs12,13 (Figure 1).

Time-line of major milestones and key innovations in digital epidemiology and public health dashboards.
Towards a comprehensive definition of digital epidemiology
Digital epidemiology was not originally conceived as a separate subject area but instead evolved into a new discipline as new forms of digitized data sources and computational methods became available. The term was first used in 2012, after which it was loosely applied in articles to refer to epidemiology that uses digital data.
14
Salathé et al. (2014) made the first attempt to provide a narrow definition for digital epidemiology, stating that it is ‘epidemiology that uses data generated outside the public health system’, though conceded that this definition excludes data from health systems that are digitized, such as electronic medical records.
15
Park et al. (2018) shift the focus towards the methods employed and define digital epidemiology as ‘epidemiology that uses digital methods from data collection to data analysis’.
16
Walker (2023) attempts to provide a broader definition, stating, ‘Digital epidemiology involves answering questions about population-level disease and health, using remotely sensed or automatically collected sources of data, which are in the digitized format’.
17
Though these definitions differ in their scope, they highlight two important defining features of digital epidemiology – the source of the data and the methods employed in its collection, representation and analysis.
Digital sources of data: The strength of digital epidemiology lies in its ability to extract epidemiological information from non-conventional sources such as social media, search engines, mobile applications, etc. User-generated content on social media websites can be analysed to track disease spread,18,19 health behaviour,20,21 as well as public sentiment,22–25 whereas health-related searches on the Internet may indicate emerging health issues or disease outbreaks.26–28 However, it is important to note that data from these sources lack threat validation and cross-verification, often leading to population and information biases and challenging assumptions of what constitutes as epidemiological evidence. Digital methods in epidemiology: The rapid increase in digital data coincides with advancements in computing power, machine learning and artificial intelligence. These advancements have enabled rapid and efficient extraction, presentation and analysis of large amounts of data, thereby igniting the interest of researchers in gleaning what information may be available in the treasure trove of digital data. Hence, we have seen a significant upsurge in the use of digital technologies in health research in the past decade, such as the use of machine learning for big data and large language models,26,29,30 applying AI image recognition techniques for vector/parasite identification,31,32 as well as the use of digital dashboards for dissemination of health information.33–35 However, these analytical methods are not bereft of inherent biases, which can shape what patterns in data are detected, prioritized or ignored. Therefore, methodological choices in digital epidemiology can actively influence knowledge generation and must be considered in its definition.
Though these two dimensions appear distinct, they are strongly interrelated and mutually reinforcing. Digital data sources such as internet search results or social media generate high volumes of heterogenous data which require advanced computational techniques that are capable of processing, filtering and interpreting them. Conversely, digital methods such as machine learning modelling and dashboard visualization depend on digitized datasets, and gain greater relevance based on their ability to draw epidemiological insights from non-epidemiological data. This inter-relationship has important conceptual implications for defining digital epidemiology. Data-centric definitions overlook how digital traces are generated, processed and interpreted, whereas method-focused definitions undermine the importance of core concepts such as infoveillance and infodemiology. To address these concerns, we propose a more comprehensive definition for digital epidemiology that identifies it as the ‘application of digital technologies and digital sources of data to enhance traditional systems for disease monitoring, analysis and response, focusing on real-time, population level insights beyond clinical records’. This definition integrates the different aspects of digital epidemiology, that is, the data sources and analytical methods applied, while also emphasizing its role in public health decision-making.
Transforming public health surveillance through digital epidemiology
Traditional public health surveillance relies heavily on data from health centres, paper-based surveys and disease registries, which undergo rigorous validation and provide fairly specific and reliable information for public health decision-making. However, these approaches suffer from delays due to the time taken for data collection, are costly and resource intensive, have limited scope and coverage, and only provide a snapshot of the health status at particular points in time. Collating epidemiological data from digital sources has the potential to transform these traditional epidemiological approaches, offering numerous benefits that can significantly improve public health surveillance:
Real-time and cost-effective data collection/analysis: Online surveys, social media, online search trends and health-related dashboards can provide continuous streams of data that can be analysed to detect emerging health threats in real-time. For example, platforms like HealthMap
36
aggregate data from various online sources to provide real-time information on emerging health threats globally. Digital disease dashboards were also used extensively during the COVID-19 pandemic to track and visualize cases, deaths, recoveries and other relevant data in real-time,12,13,37,38 and played a significant role in early outbreak detection and reduced reporting lag.39,40 Bluetooth and GPS-based contact tracing apps were used to provide alerts to individuals who have been in close proximity to a person diagnosed with COVID-19 in several countries.41–44 These apps also assisted in determining whether medical care was necessary or if self-isolation based on symptoms and contact history was sufficient. Therefore, digital epidemiology can reduce the need for extensive fieldwork and data collection efforts and minimize the resources required for manual data processing and interpretation. Enhanced surveillance and early warning: Digital epidemiology enables the development of more sophisticated surveillance systems that can provide early warnings about potential disease outbreaks. By analyzing data from multiple sources, a public health official can identify patterns and anomalies that may indicate the onset of an epidemic. For instance, Google Flu Trends tracked influenza activity weeks ahead of traditional surveillance systems, with initial estimates of accuracy as high as 97%.
45
Though subsequent reports highlighted systemic overestimations in predictions resulting from media driven sensitivity to search behaviour,
46
they have shown to reduce errors in prediction estimates by as much as 52.7% when paired with data from traditional surveillance systems.
47
More recent investigations have also found strong correlation of prediction estimates that include internet based sources with reported incidence of infectious diseases such as COVID-19 (r = 0.51–0.81 at lags of 10 days),
48
Zika (r = 0.77–0.96 at lags of one week), Dengue (r = 0.41–0.93 at lags of 3 weeks)
49
as well as for non-infectious diseases such as cancer (r = 0.46–0.96).
50
Furthermore, the accessibility of mobile devices and the Internet have encouraged participatory surveillance, allowing individuals to self-report symptoms or risk factors for diseases, thereby generating real-time population-level data. Participatory surveillance can significantly enhance early warning capabilities by capturing localized spikes before they reach the public health system. Enhanced information dissemination: Online databases and portals can provide access to vast amounts of health data, enabling researchers to conduct large-scale epidemiological studies and share findings quickly.
35
Digital epidemiology also empowers individuals by providing them with the tools and information needed to monitor their health and contribute to public health efforts.
Traditional indicator-based surveillance prioritizes data validity and standardization at the cost of reporting lag. In contrast, digital epidemiology focuses on real-time quick estimates based on alternate sources, albeit with lower accuracy. While these systems may not be able to substitute traditional public health surveillance, they can act as complementary systems that provide early situational awareness, while relying on conventional systems for confirmation and response coordination. 14
However, implementation of these systems in low and middle income countries may by challenging due to lower digital penetration and unequal access, resulting in underrepresented marginalized populations that most need interventions. 51
Pitfalls of digital health data: walking the fine line
The collection and interpretation of health data are fraught with challenges arising from its unique characteristics, such as variability in case definitions, multi-level event-based reporting, heterogeneity and diagnostic uncertainty. However, health data now extends beyond simple clinical records to integrate digital footprints such as search queries, social media posts, wearable devices, mobile networks and participatory surveillance data. While these digital sources of data can enhance the resolution and timeliness of surveillance, they add an element of complexity, presenting their own unique sets of challenges that affect their accuracy and consistency.
(a) Data Quality and Bias
Syed et al. (2023) identified six dimensions for digital health data quality, namely accuracy, completeness, consistency, contextual validity and currency, and estimated 40–60% misinformation in social media based health data (e.g., exaggerated symptoms). 52 Digital data derived from social media activity, internet searches, etc., lack standardized control for validation and cross-verification, which can often lead to lower accuracy and inconsistent conclusions. User-generated content can be fraught with internal biases of the users and may lead to misinformation, over-exaggeration or misrepresentation of information, thereby leading to false conclusions. Integrating and merging data from heterogeneous digital sources may also lead to inconsistencies in format, context and interpretation, and, therefore, detailed scrutiny of their contextual validity is required to ensure they do not add additional noise.
Several strategies have been suggested for mitigating these data quality issues. For example, careful testing of search filers using retrieval precision and recall metrics can ensure the relevancy and comprehensiveness of data captured.
53
Additionally, greater transparency in methods used for data collection and analysis may help users identify potential biases. Data guidelines such as the FAIR (Findable, Accessible, Interoperable and Reusable) data principles can help provide a standardized framework for digital data sharing.
54
(b) Representativeness and Inclusion
At the same time, these datasets suffer from significant population bias and are not representative of the general population. For example, a vast majority of the users on social networking websites lie within a particular demographic based on their age and their socio-economic status. Factors such as geographic location and internet access can also perpetuate inequalities in health outcomes in such datasets.
55
These challenges maintain sample size as a central issue in digital epidemiology, though the context may differ from traditional epidemiology. The skewed surveillance outcomes require corrective techniques such as post-stratification or sample weighting to adjust for the demographic imbalances and have shown some success in participant surveillance systems such as Flu Near You
9
and InfluenzaNet.
10
While a lot of the skills for a digital epidemiologist coincide with those of a data scientist, such as big data analysis, statistical modelling, data visualization, etc., a digital epidemiologist may need an additional understanding of population health dynamics, surveillance systems and how to deal with specific biases of digital health data.
(c) Ethics and Privacy
Digital datasets often contain sensitive, individual-linked information and can be operated without user consent or transparent governance, raising significant privacy issues. To address these ethical concerns, there is a strong need for safeguards such as anonymization, informed consent and data minimization. Distributed learning approaches have been tested during the COVID-19 pandemic to balance the scales between data utility and privacy by mitigating centralized custodianship.
56
(d) Governance and Regulation
Besides the technical and ethical considerations, effective use of digital health data is also strongly dependent on governance and regulatory structures that determine the accountability, oversight and cross-jurisdictional data use norms. The institutionalization of public health data during the COVID-19 pandemic brought to light the urgent need for robust governance frameworks that balance innovation with privacy, fairness and accountability. Transparency in design and implementation of digital health systems, public participation and oversight, expert risk assessment and standardization of methodologies have been suggested as strategies to overcome these governance issues. 57 However, regulatory fragmentation across national borders provides a significant hurdle, with frameworks such as Health Insurance Portability and Accountability Act (HIPAA) in the United States and the General Data Protection Regulation (GDPR) in the European Union imposing differing requirements for data processing, consent and usage, thereby complicating cross-jurisdictional data integration. 58 To overcome such issues, the Organization for Economic Co-operation and Development (OECD) has recommended 12 guiding principles to harmonize health data governance across countries which include data accessibility and sharing, quality and interoperability, privacy and security as well as transparency and accountability. 59 The World Health Organization's Global Strategy on Digital Health 2020–2025 also emphasizes the need for regulatory harmonization, interoperability standards and ethical governance to ensure that digital health data are used equitably and responsibly for public health purposes. 60
Academic research articles present a new source of digital data that has so far been largely overlooked. The influx of scholarly articles is staggering, with millions being added annually. An estimate suggests that over 43 million academic papers have been published since 2003, showcasing a cumulative growth of over 28% in the last 5 years alone (2018–2022), with a notable surge observed in 2021 (10%). China, the United States, India, the United Kingdom and Germany collectively contributed to approximately 53% of the total published articles in 2022. 61 The proliferation of academic journals has also witnessed a substantial rise. In 2010, there were approximately 24,552 journals worldwide, a number that has more than doubled to over 46,736 by 2020. 62 This exponential growth underscores the vast reservoir of information available, akin to an ever-expanding ocean. It is imperative to harness this information for scientific analysis and clinical decision-making effectively. Compared to other non-conventional sources of data for digital epidemiology (social media, internet searches, etc.), these provide a significantly more reliable and validated form of information.
Public health dashboards: the operational core of digital epidemiology
Dashboards are defined as ‘analytical tools that can collate data from multiple different information systems and present them in a concise, comprehensive, meaningful and intelligent way using visual features, for faster decision-making’. 63 Dashboards have been used since the inception of digital epidemiology. An early example of a public health dashboard was the BioSense programme developed by the CDC in 2003 to integrate hospital reports for syndromic surveillance for early warning of disease outbreaks and bioterrorism. 64 Just a year later, in the fall of 2004, the SmiNet-2 system was introduced in Sweden, combining clinical and laboratory data into a web-based national dashboard with tools for outbreak investigation, contact tracing and case management. 65 Following this, a number of different dashboards were tested over the years either for general public health surveillance34,66,67 or to target specific diseases.68–71 However, despite their utility, they failed to capture the public's interest, and dashboards only gained significant prominence during the COVID-19 pandemic, which significantly accelerated their use in disseminating health information. 63 Dashboards proved instrumental right from the early stages of the COVID-19 pandemic, empowering public health officials to make timely and effective evidence-based decisions. Despite this, a vast majority of these COVID-19 dashboards (66%) failed to transition to platforms for ongoing surveillance and have now become inaccessible. 72 This disappearance of the COVID-19 dashboards demonstrates that while dashboards have the potential to transform data into actionable public health actions, their sustained impact requires long-term investments in digital infrastructure, data interoperability and governance. 73 Within the short period since the pandemic, public health dashboards have witnessed an astronomical surge supported by major initiatives by multi-lateral organizations, for example, the Epidemic Intelligence from Open Sources (EIOS), 74 European Respiratory Virus Surveillance Summary 75 and ClimaHealth initiatives. The new age dashboards have evolved from mere static reporting tools to dynamic risk communication and investigation systems, emphasizing user interactivity, geospatial mapping, temporal trend analysis and advanced modelling capabilities. Furthermore, the integration of genomic epidemiology has added a new dimension, resulting in specialized dashboards (such as Nextstrain and CoV-Spectrum) that enable visualization of phylogenetic trees, mutations and spread of variants.76,77 Several dashboards now also facilitate participatory surveillance, thereby promoting public engagement and situational awareness.
Dashboards bridge the gap between the core methodologies and datasets of digital epidemiology to the traditional public health systems by providing actionable public health insights. By integrating epidemiological and statistical methods into a digital interface, these dashboards can swiftly deliver tailored information to users, be they researchers or medical practitioners unfamiliar with complex methodologies. This approach enables data retrieval in various formats, including time series graphs and charts, geospatial heat maps, real-time metrics as numerical indicators and other interactive visuals. 35 The potential of a dashboard extends far beyond mere data retrieval. It facilitates proactive disease forecasting, enabling timely interventions, early outbreak detection and continuous monitoring of population health trends (Figure 2). However, the governance and maintenance of these dashboards are currently highly fragmented and while major institutions such as the US CDC and WHO provide centralized platforms, a vast archive of decentralized local dashboards are also actively being developed and maintained by independent research groups or private organizations. This further necessitates the development of standardized protocols to ensure validity, reliability and long-term support. Also, the benefits of these dashboards are often distributed unevenly, with limited digital infrastructure, unstable internet connectivity and lack of trained personnel acting as significant barriers for deployment in low- and middle-income countries. Nevertheless, dashboards play a significant role in democratizing health information, thereby advancing health equity and guiding public health action, provided they are designed to engage diverse audiences and sustain meaningful use. 78 Addressing digital infrastructure needs and universal connectivity in the future will be critical for enabling its widespread adoption. 79
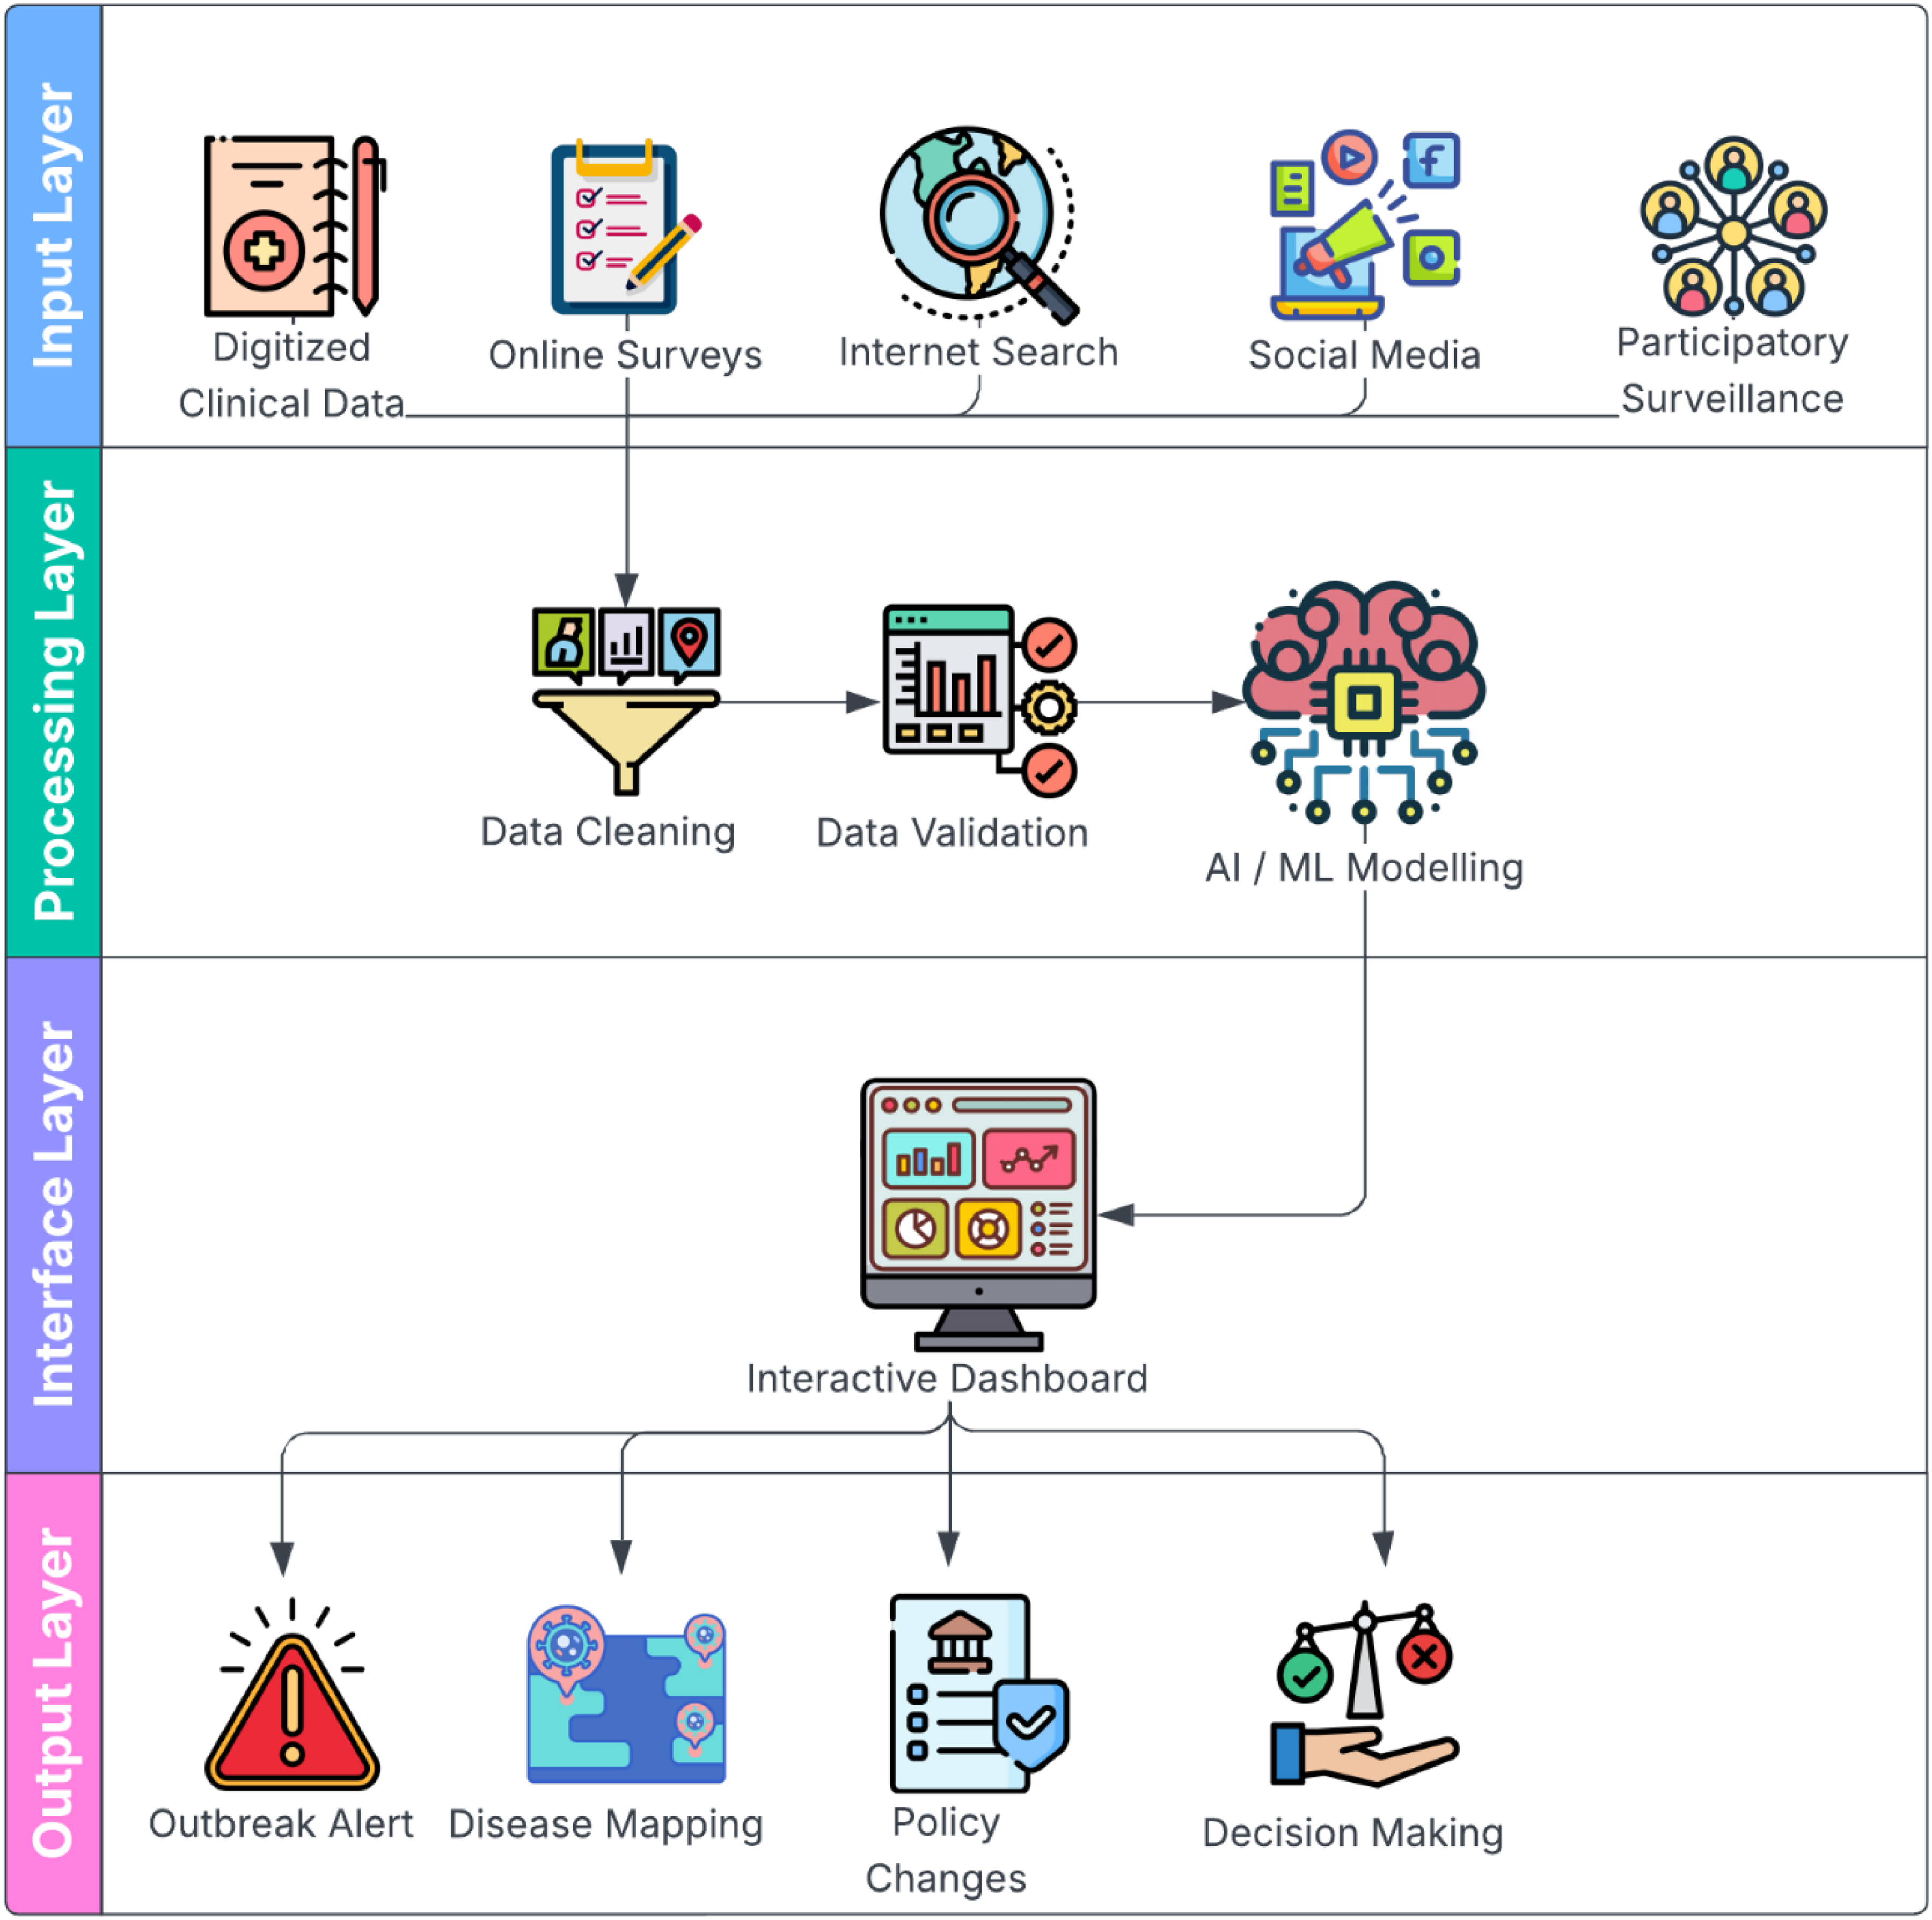
Conceptual model of digital epidemiology that maps how data from multiple different digital sources are integrated, application of advanced analytical techniques to this data, the central role of dashboards within the complete architecture, and how this is operationalized through outbreak alerts, disease mapping, policy changes and decision-making. (Figure designed using resources from Flaticon.com)
The next-generation health research dashboard – capabilities and innovations
The next generation of dashboards can prove pivotal in enhancing our comprehension of disease dynamics as well as support their surveillance and control in a number of ways:
Enhanced data capture and real-time monitoring: Field-based or patient data in medical research is often collected as paper-based Case Report Forms (CRF), which are then digitized manually. This process is highly time-consuming and inefficient, leading to significant delays in data presentation and analysis. Furthermore, in studies that require data collection over several months or years, with multiple follow-ups, conventional methods of data collection can become particularly cumbersome. With increased access to technology, it has become significantly easier to directly capture such data in digital forms using mobile hand-held devices. Such digital forms can be directly linked to health research dashboards to facilitate real-time data entry and monitoring. Real-time data capture not only streamlines the data collection process but also enhances the ability to monitor study progress and make timely adjustments, ultimately leading to more accurate and actionable research outcomes. One-health and multi-disciplinary data integration: Integrating all related data about a particular disease is crucial for gaining a comprehensive understanding of its dynamics. For instance, malaria, a vector-borne disease, is influenced by various factors such as vector distribution (e.g., different species of Anopheles), ecological conditions (e.g., rainfall, humidity, temperature), malaria control activities (e.g., distribution of LLINs, frequency of IRS, mass surveys, treatment policies), drug resistance and comorbidities (e.g., malnutrition). Such data can be extracted from research papers, reports and public health survey data. They may be integrated into a health research dashboard to provide a comprehensive picture of malaria transmission. Such a holistic understanding of the disease and its related factors would be crucial for more effective decision-making and strategic planning for malaria control and prevention efforts.
80
Stratified planning and vector control decision-making in malaria control have been supported by integrated dashboards that combine entomological, meteorological and intervention data. National dashboards that included genetic, mobility and epidemiological data during COVID-19 influenced policy responses and situational awareness in many contexts.
13
Similarly, when integrated into regular public health processes, digital tools that provide vector surveillance have proven useful in tracking spatiotemporal patterns and focusing treatments.
81
Evidence synthesis and knowledge translation for research and policy: Many countries conduct periodic health surveys for various needs such as resource allocation, policy formation, identification of health trends and planning. For example, in India, multiple surveys such as the National Family Health Survey (NFHS), District Level Household and Facility Survey (DLHS), Annual Health Survey (AHS), Global Adult Tobacco Survey (GATS), Clinical, Anthropometric and Biochemical (CAB) Survey and National Mental Health Survey (NMHS) are regularly conducted to meet diverse requirements. These surveys are rich in information and can be utilized in different contexts to enhance medical research. However, a significant barrier is the lack of awareness among researchers, especially medical and biomedical scientists, regarding the complex methodologies of these surveys. This includes understanding sampling weights and identifiers, merging different datasets and identifying variables of interest among hundreds of variables. By utilizing digital dashboards, this vast amount of information can be summarized and presented to end users, enabling them to use the data for better research outcomes effectively. Systematic reviews are rigorous and complex methods for synthesizing or summarizing all research information on specific topics. Systematic reviews are considered the highest level of evidence and can be instrumental in policymaking or clinical decision-making. However, their reach to end users, such as programme personnel and healthcare professionals, is often limited, likely due to complex methodologies, passive or non-interactive presentation of data and fragmented information. A research dashboard can help overcome these barriers by presenting relevant information on prominent research questions within a disease domain from all systematic reviews available in an interactive and user-friendly manner. This can significantly enhance the accessibility and retrieval of data in systematic reviews according to the specific objectives and needs of the user. Public engagement and participatory surveillance: As public health dashboards move beyond the confines of mere data reporting to a comprehensive planning and risk communication tool, user engagement adopts a central role in their design and development. Consequently, new-age public health dashboards incorporate interactive interfaces with features such as clickable maps, real-time editable charts, drill-down capabilities and customizable data filters that enable users to explore metrics by region, time or demographic group.
35
The interactive nature of these dashboards makes data not just accessible but also actionable. Additionally it has been suggested that public health dashboards should also provide a clear narrative context to guide interpretation, tailor audience specific segments and identify the accurate geographical unit that balances local relevance while protecting privacy.
82
A natural progression in user engagement with these dashboards is the use of participatory surveillance methodologies that enable users to report symptoms and risks associated with the disease. This two-way exchange of information fosters real-time data collection and early detection of spikes that lead to outbreaks.
83
Frameworks for ethical integration of citizen science and community based participatory research such as the SMART framework,
84
and the Global digital citizen science policy,
85
have already been established and have made their way into COVID-19 digital epidemiology dashboards, providing ethically grounded and equity focused methodologies to support real-time, evidence-based public health decision making.
86
Advanced platforms for dashboard development and evaluation frameworks: In the past, dashboards were developed using high-level programming languages such as HTML, CSS, JavaScript and C. Today, however, there are many platforms available that streamline the dashboard development process, including Tableau, Power BI, Google Looker Studio (formerly Google Data Studio), R Shiny and Microsoft Excel.87–90 Tableau, Power BI and Google Looker Studio are prominent business intelligence and data visualization tools that enable users to explore and analyse data in depth to draw meaningful conclusions. These platforms support a wide range of data sources, including Excel, CSV, text files, Google Sheets, SQL Server, MySQL, PostgreSQL, Oracle, Google BigQuery, Snowflake, Amazon Redshift and Microsoft Azure. Although primarily designed for business analytics, these tools can also be effectively used for health analytics, leveraging their robust data visualization and analysis features. R Shiny is a specialized framework used to develop customized web applications for study data. Recognized as a leading tool in medical data analysis, R offers an extensive range of techniques and tools ranging from simple tabulations to highly advanced statistical and machine learning methods. Working with R Shiny can be challenging, but it provides unparalleled flexibility and options. Users can leverage numerous libraries to perform countless operations on their data, making these tools invaluable for sophisticated data analysis and visualization. Additionally, the next generation public health dashboards will need to move beyond technical novelty allowing for critical appraisal based on standardized frameworks. For example, the digital health maturity model of the WHO provides a framework for the assessment of digital health capabilities based on dimensions such as governance, sustainable financing, workforce capacity and interoperability.
60
Majority of the dashboards in use today, lack qualitative feedback and a systematic use of implementation frameworks thereby Most current dashboards lack systematic use of implementation frameworks, robust usability testing and qualitative feedback thereby hindering their sustainable adoption.91,92 AI-enabled intelligent decision support dashboards: Recent developments in generative AI and large language models (LLMs) are likely to have a transformative impact on digital epidemiology in the near future and are important to note here. As opposed to traditional rule-based AI models, LLMs can be leveraged to view forecasting as a text reasoning problem and, therefore, generate valuable insights from heterogeneous unstructured datasets. Preliminary new frameworks like the Pandemic LLM have used transformer based architecture trained on multi-modal datasets (such as public health policies, genomic surveillance and spatial and time series datasets) and outperform traditional forecasting models by up to 10%.
93
These developments will naturally extend towards interactive dashboards and enable them to evolve into dynamic decision-support tools. Next-generation dashboards can embed LLMs to provide direct chat interfaces that take natural-language queries and provide LLM-generated summaries, warnings or alerts. Prototypes of these public health chatbots, such as the GenSpectrum, are already in the works, showcasing their strong potential.
94
As digital epidemiology extends beyond the confines of traditional surveillance to monitoring behaviour, compliance and real-time situational awareness, LLMs serve as the connective tissue – integrating semantic, numeric and behavioural signals into an intelligent public health system. At the same time, the next-generation AI-enabled dashboards will become the operational nerve centre. Notwithstanding their potential, increased automation may also introduce new risks such as generation of plausible incorrect information (LLM hallucination), reproduce biases in training data and obscure uncertainty, which must be taken into account particularly in public health outcomes, where the stakes are significantly higher.
Conclusion
The volume of research material has increased exponentially in the last couple of days. However, its translation into decision-making and policy formation is still relatively limited, likely due to difficulty in accessing and interpreting this data. The present commentary explores how digital dashboards may be used to make information accessible and comprehensible for policymakers as well as researchers. Research-based health information dashboards can compile highly reliable and detailed health information for utilization by public health systems that would otherwise require vast amounts of resources and effort to collect.
This analysis highlights a number of practical measures to improve the integration of digital epidemiology into public health initiatives. First, the creation and ongoing maintenance of open-source public health dashboards can advance equity, flexibility and transparency in various contexts. Second, to facilitate interoperability and minimize effort duplication, cross-institutional data-sharing frameworks that are in line with current monitoring infrastructures are crucial. Lastly, coordinated programmes run by national and international public health organizations, like the U.S. Centers for Disease Control and Prevention and the World Health Organization, can offer dashboard ecosystems long-term stewardship, standardization and governance.
This review makes the case for dashboards as the operational foundation of digital epidemiology, converting diverse digital data streams into intelligence that can be put to use. Dashboards allow digital epidemiology to advance from retrospective analysis to real-time, context-aware public health action by connecting research, surveillance and decision-making.
Footnotes
Acknowledgements
We are also thankful to ICMR-NIMR and ICMR-NICPR for providing all the logistical support involved in the study.
Ethical considerations
Not applicable as it is review article.
Consent for publication
All authors have given their consent for publication.
Author contribution
CPY conceived, designed and reviewed the study. CPY, SSAH and PK analysed the data and wrote the manuscript equally. AS critically appraised and edited the manuscript. All authors participated in finalizing the draft.
Funding
The authors received no financial support for the research, authorship and/or publication of this article.
Declaration of conflicting interests
The authors declared no potential conflicts of interest with respect to the research, authorship and/or publication of this article.
Figure Permissions
No image has been taken from other sources. We create all images/illustrations for this study.
Availability of data and material
All data are given in manuscript.