
Abstract
Objective
Metabolic dysfunction-associated steatotic liver disease (MASLD) is one of the most prevalent liver diseases and is associated with pre-hypertension and hypertension. Our research aims to develop interpretable machine learning (ML) models to accurately identify MASLD in hypertensive and pre-hypertensive populations.
Methods
The dataset for 4722 hypertensive and pre-hypertensive patients is from subjects in the NAGALA study. Six ML models, including the decision tree, K-nearest neighbor, gradient boosting, naive Bayes, support vector machine, and random forest (RF) models, were used in this study. The optimal model was constructed according to the performances of models evaluated by K-fold cross-validation (k = 5), the area under the receiver operating characteristic curve (AUC), average precision (AP), accuracy, sensitivity, specificity, and F1. Shapley additive explanation (SHAP) values were employed for both global and local interpretation of the model results.
Results
The prevalence of MASLD in hypertensive and pre-hypertensive patients was 44.3% (362 cases) and 28.3% (1107 cases), respectively. The RF model outperformed the other five models with an AUC of 0.889, AP of 0.800, accuracy of 0.819, sensitivity of 0.816, specificity of 0.821, and F1 of 0.729. According to the SHAP analysis, the top five important features were alanine aminotransferase, body mass index, waist circumference, high-density lipoprotein cholesterol, and total cholesterol. Further analysis of the feature selection in the RF model revealed that incorporating all features leads to optimal model performance.
Conclusions
ML algorithms, especially RF algorithm, improve the accuracy of MASLD identification, and the global and local interpretation of the RF model results enables us to intuitively understand how various features affect the chances of MASLD in patients with hypertension and pre-hypertension.
Keywords
Introduction
Metabolic dysfunction-associated steatotic liver disease (MASLD), formerly known as nonalcoholic fatty liver disease, is defined as the presence of hepatic steatosis along with one cardiometabolic risk factor, and no other secondary causes. 1 It originates from increased lipid storage in more than 5% of primary hepatocytes. 2 MASLD has become one of the most prevalent liver diseases, with a global prevalence of about 30%.3,4 In recent years, due to rapid changes in dietary structure and lifestyle, the incidence of MASLD has been increasing year by year. 5 In addition, if not intervened promptly, MASLD will gradually develop into liver fibrosis or even liver cancer.6,7 These will pose a significant threat to human health and have widespread social and economic impacts. 8
Liver biopsy has always served as the definitive diagnostic method for MASLD. 9 Nevertheless, because of its invasive nature and high risk, it cannot be widely used for clinical diagnosis and general population screening. In addition, inconsistencies in the observation and interpretation of liver biopsy specimens by different clinical-pathological diagnosticians can result in diagnostic discrepancies.9,10 Consequently, there is an urgent need to find an assistant method that can effectively replace liver biopsy while maintaining a high level of accuracy in identifying MASLD.
Recently, due to the development of statistical theory and computer technology, the application of machine learning (ML) in clinical practice has received widespread attention and recognition. 11 ML algorithms enable computers to autonomously acquire knowledge, analyze data, and build predictive models, thereby facilitating the prediction of previously unknown data. 12 The new ML technology has been widely used in diverse disease prediction models, showcasing remarkable performances. 13
MASLD is significantly correlated with blood pressure levels. 14 Research has shown that even without other metabolic risk factors, early hypertension may lead to MASLD, and hypertension is also an independent risk factor for MASLD. 15 In addition, controlling blood pressure may help prevent or limit MASLD in hypertensive patients. 15 Pre-hypertension increases the risk of hypertension and cardiovascular events, 16 while hypertension is associated with cardiovascular and all-cause mortality in MASLD patients. 17
However, there is currently a lack of relevant research on identifying MASLD in pre-hypertensive and hypertensive populations. Considering the advantages of ML, our research aims to develop interpretable ML models using data from pre-hypertensive and hypertensive patients in the NAGALA study to effectively identify MASLD.
Methods
Study populations and data collection
This research is a secondary analysis of data from subjects in the NAGALA study from 2004 to 2015 in a cross-sectional design. The purpose of the NAGALA study was to conduct an epidemiological study of diabetes and fatty liver disease using the examination data of the general population who underwent health checkups at Murakami Memorial Hospital in Japan. The previous study was approved by the Ethics Committee of Murakami Memorial Hospital and authorized with informed consent from the subjects. 18 This longitudinal cohort data has been uploaded to the Dryad database for public sharing by Okamura et al. 19 According to the data sharing policy, all researchers are free to download the original data and use the data for secondary analysis without harming the rights and interests of the authors. Following the policy, we needed to cite data sources when using these data. 19
Based on our research objectives, patients with liver diseases (alcoholic fatty liver disease and viral hepatitis), normal blood pressure [systolic blood pressure (SBP) < 120 mmHg and diastolic blood pressure (DBP) < 80 mmHg], type 2 diabetes or fasting blood glucose over 6.1 mmol/L, drugs use, heavy drinking habits (over 140 g/w for females or 210 g/w for males), and missing data were excluded in our study.
As previously described, 18 age, gender, exercise habits, smoking status, and drinking habits were documented using standardized questionnaires. Exercise habits were defined as engaging in any form of physical activity more than once a week. Drinking status was categorized as no drinking or small (<40 g/w) intake, light (40–139 g/w) intake, and moderate (140–209 g/w) intake based on weekly alcohol consumption. The smoking status was classified as non-smoking, past smoking, and current smoking by querying subjects about their smoking history before the baseline survey. Height, weight, waist circumference (WC), SBP, and DBP were measured using standard methods by trained clinicians. Following an overnight fast, the venous blood samples of the subjects were collected, and the biochemical parameters were analyzed by an automatic analyzer, including alanine aminotransferase (ALT), aspartate transaminase (AST), γ-glutamyltransferase (GGT), high-density lipoprotein cholesterol (HDL-C), total cholesterol (TC), triglyceride (TG), fasting plasma glucose (FPG), and hemoglobin A1c (HbA1c).
Diagnosis, definition, and calculation
Experienced gastroenterologists evaluated and made a diagnosis by abdominal ultrasound without knowing the purpose of the study and the clinical information of the subjects. MASLD is diagnosed if the total score of blurred blood vessels (0–1 points), liver brightness (0–4 points), deep attenuation (0–2 points), and liver and kidney echo contrast (0–4 points) exceeds 2. 20
According to the Japanese Hypertension Society Hypertension Management Guidelines (JSH 2019), hypertension is defined as SBP ≥ 140 and/or DBP ≥ 90 mmHg; elevated blood pressure, SBP 130–139 and/or DBP 80–89 mmHg; and high normal blood pressure, SBP 120–129 mmHg and DBP < 80 mmHg. In this study, elevated blood pressure and high normal blood pressure were defined as pre-hypertension. 21
In the present study, body mass index (BMI) was calculated as weight (kg)/[height (m)]2, and LDL-C was calculated as 0.9 × non-HDL-C (mg/dL) − 0.1 × TG (mg/dL) [non-HDL-C = TC (mg/dL) − HDL-C (mg/dL)]. 22
Preprocessing, supervised ML, and cross-validation
The quantitative variables of the collected dataset were standardized, scaled to the unit variance, and normalized to the unit norm by using standard ML practices. Binary representations were created from categorical variables by using a label encoder. The original dataset was randomly divided into training and test sets at a ratio of 7:3.
After data preprocessing, the chances of MASLD were modeled as outcomes for prediction. Six ML models were used in this study, including the decision tree (DT) model, 23 K-nearest neighbor (KNN) model, extreme gradient boosting (XGB) model, 24 support vector machine (SVM) model, 25 random forest (RF) model, and naive Bayes (NB) model. Notably, there is an inherent sparsity of diseased cases in the dataset and to enhance the classifier's characterization capability of sparse samples, a weighted loss approach was employed during the model training to tackle the issue of data imbalance. K-fold cross-validation (k = 5) was performed before model training, with the study dataset randomly divided into the internal model validation set (75%) to ensure robust performance, and the model evaluation set (25%) for final model evaluation. For the internal validation set, models were trained using each of the 4 folds as train data and subsequently validated using the remaining fold of data. 26 K-fold cross-validation results were used to evaluate the models’ stability and robustness in complex data. The model with the best K-fold cross-validation results was ultimately implemented in the proposed dataset. 27 Model predictive capacities were assessed using the area under the receiver operating characteristic curve (AUC), average precision (AP), accuracy, sensitivity, specificity, and F1. Data preprocessing, supervised ML modeling, and cross-validation were computed using the scikit-learn 1.0.2 package in Python 3.8.
Feature importance, clustering, and interaction effects with Shapley additive explanation (SHAP) values
The SHAP values were calculated to interpret the results of the RF model.28,29 Hierarchical clustering was performed using the SHAP value feature weightings to compare the feature similarities and differences in the population subsets across the study populations. The SHAP interaction values were calculated to quantitatively study the interaction effects between features. All SHAP values were computed using the SHAP 0.41.0 package in Python 3.8.
Results
After applying the inclusion and exclusion criteria, 4722 patients were ultimately selected for analysis (Supplemental Figure S1). A total of 1469 (31.1%) participants were diagnosed with MASLD. The prevalence of MASLD in hypertensive patients and pre-hypertensive patients was 44.3% (362 cases) and 28.3% (1107 cases), respectively. Compared with the non-MASLD controls, MASLD patients had higher BMI, WC, SBP, DBP, ALT, AST, GGT, HDL-C, LDL-C, TC, TG, and FPG levels, as well as a higher proportion of males. Additionally, they had lower levels of HDL-C and engaged in less physical exercise (all P < 0.05) (Table 1). Figure 1(a) intuitively illustrates the patients with and without MASLD in the reduced three-dimensional space. The overall data distribution demonstrates a distinct separation boundary between two categories: MASLD and non-MASLD. The correlation analysis of all variables in the dataset is shown in Figure 1(b).

Visualization of the dataset. (a) The three-dimensional scatter plot of all data in the dataset. (b) Correlation matrix for all features in the dataset. MASLD, metabolic dysfunction-associated steatotic liver disease; BMI, body mass index; WC, waist circumference; SBP, systolic blood pressure; DBP, diastolic blood pressure; ALT, alanine aminotransferase; AST, aspartate aminotransferase; GGT, gamma-glutamyl transferase; HDL-C, high-density lipoprotein cholesterol; LDL-C, low-density lipoprotein cholesterol; TC, total cholesterol; TG, triglyceride; FPG, fasting plasma glucose; HbA1c, hemoglobin A1c.
Baseline characteristics of the study populations.
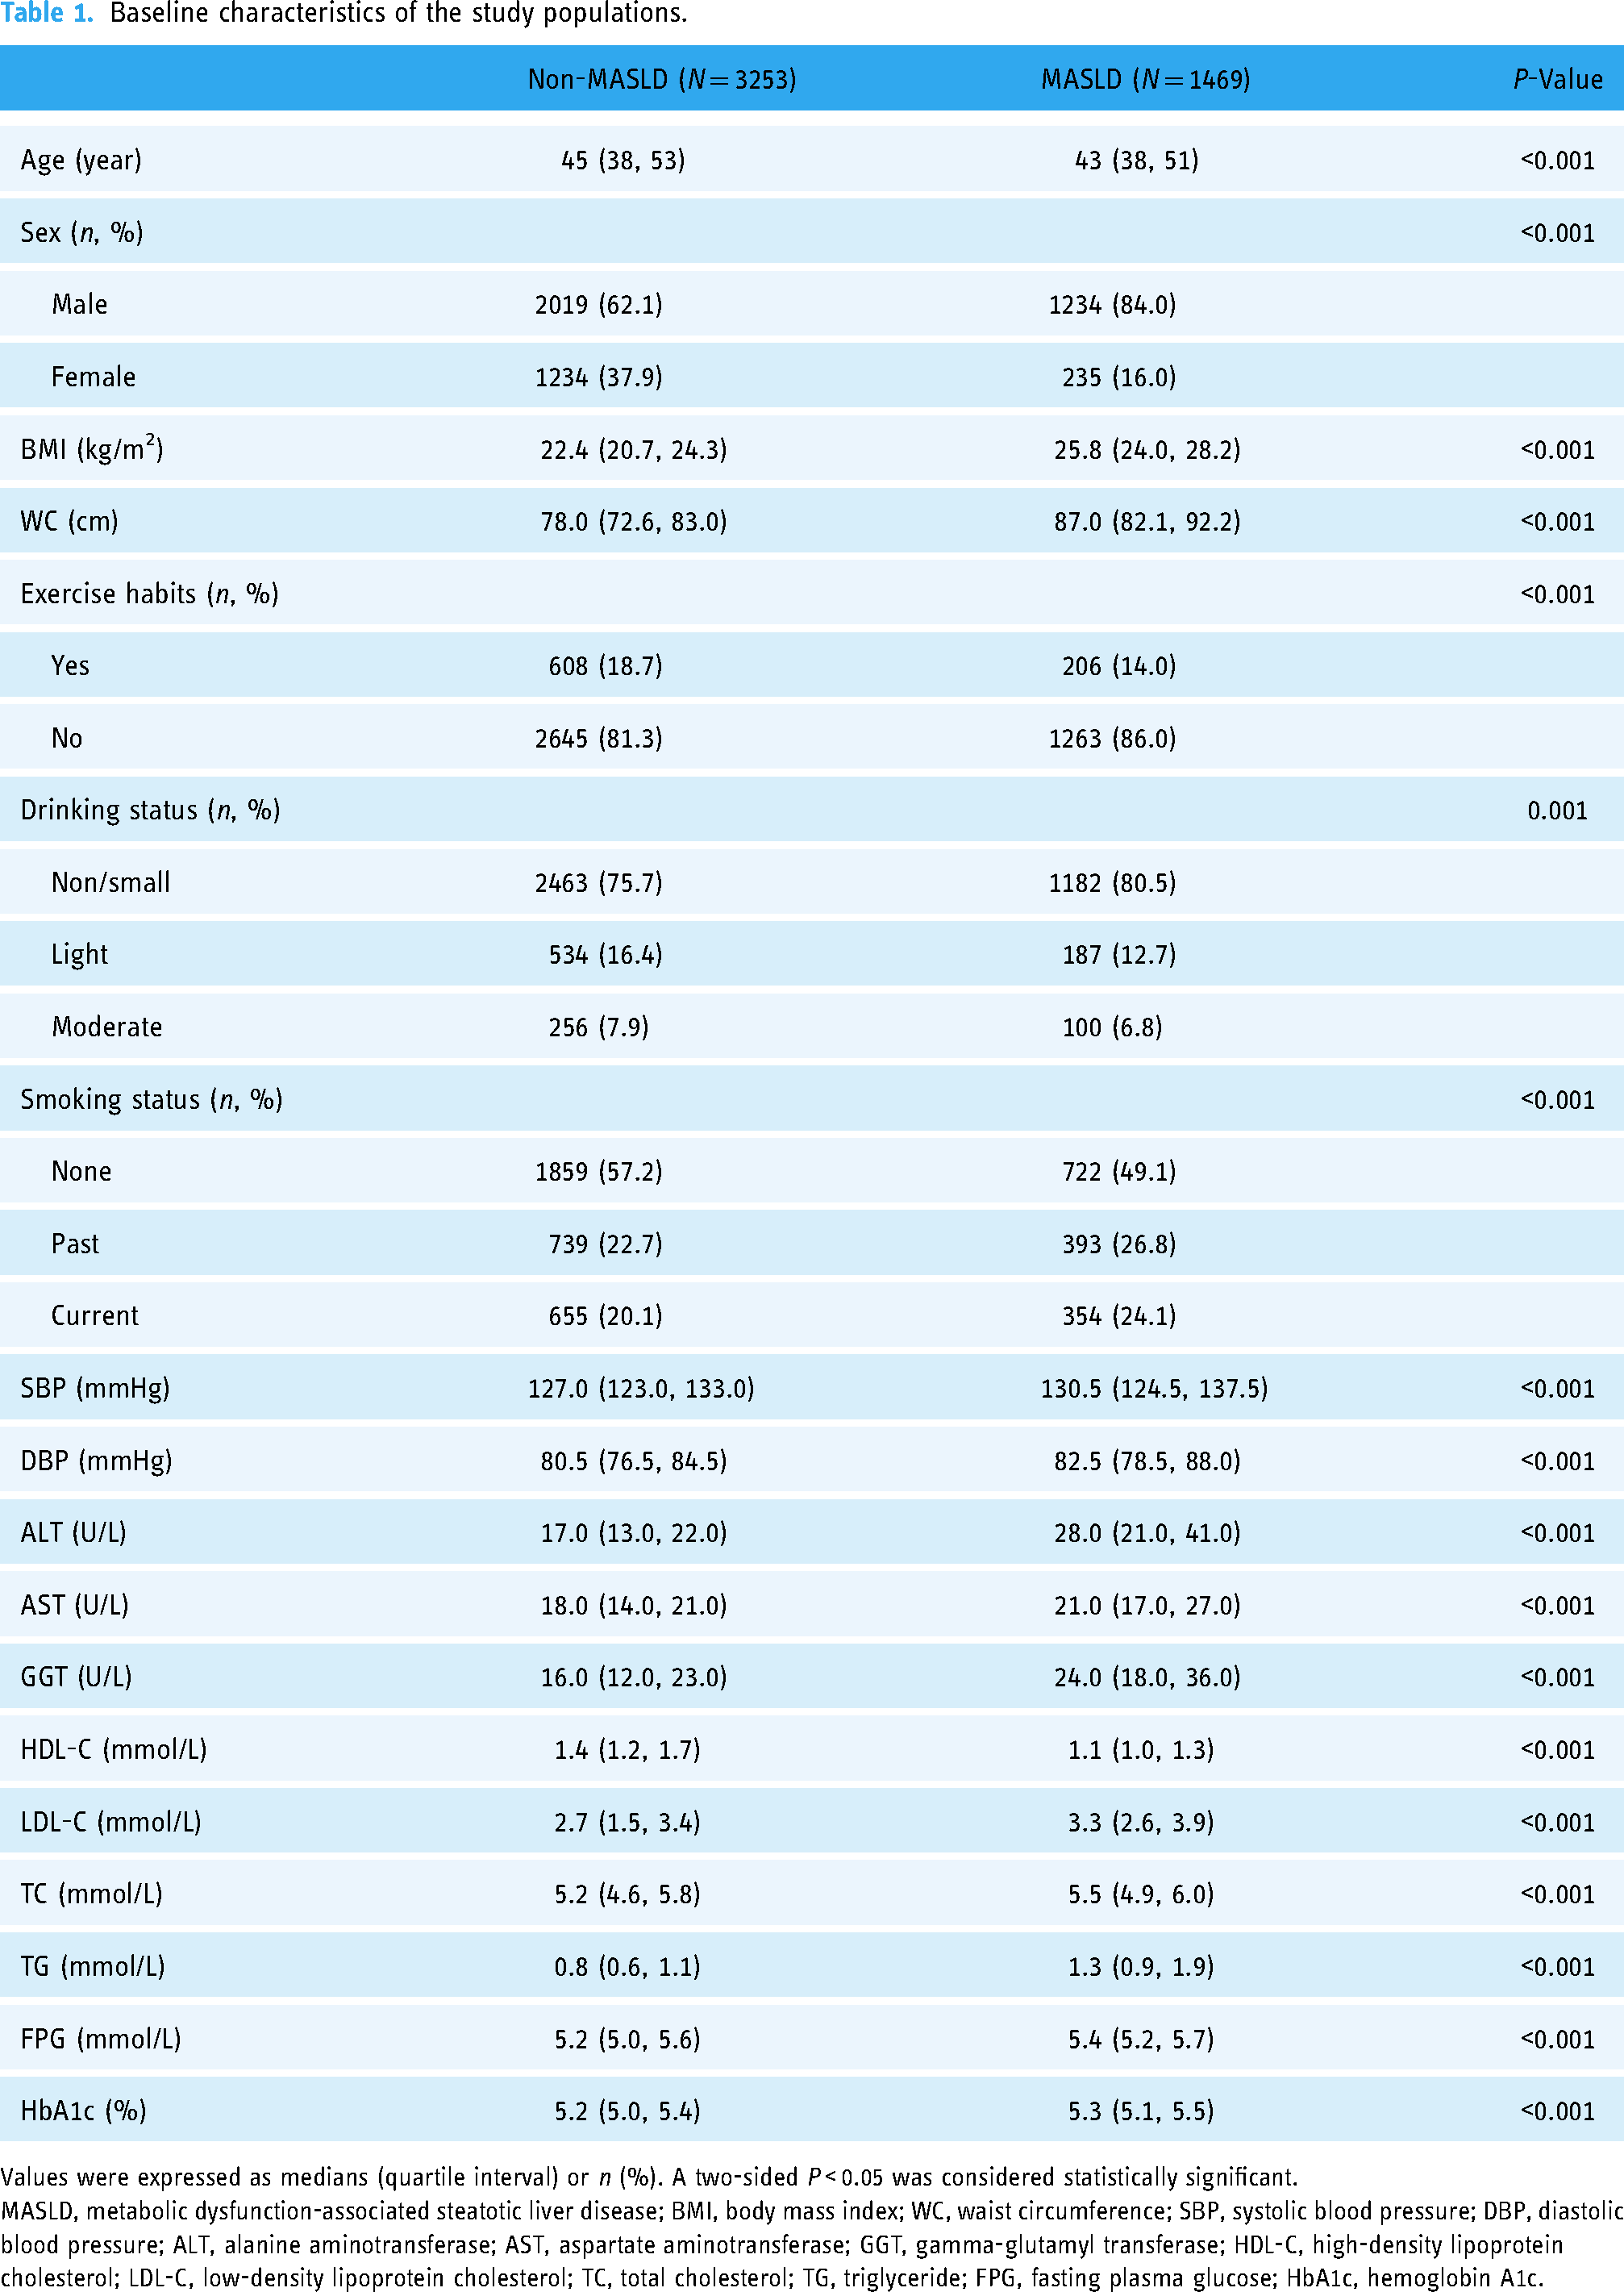
Values were expressed as medians (quartile interval) or n (%). A two-sided P < 0.05 was considered statistically significant.
MASLD, metabolic dysfunction-associated steatotic liver disease; BMI, body mass index; WC, waist circumference; SBP, systolic blood pressure; DBP, diastolic blood pressure; ALT, alanine aminotransferase; AST, aspartate aminotransferase; GGT, gamma-glutamyl transferase; HDL-C, high-density lipoprotein cholesterol; LDL-C, low-density lipoprotein cholesterol; TC, total cholesterol; TG, triglyceride; FPG, fasting plasma glucose; HbA1c, hemoglobin A1c.
ML models in predicting chances of MASLD
K-fold cross-validation on ML models
Figure 2(a)–(f) illustrates the comparison of the performances of various models on the proposed dataset. The RF and the XGB model both had superior performances in the entire dataset, but the RF model had a slightly higher average AUC value of 0.847 compared with the XGB model. Considering the stability and generalization of the RF model against outliers and noise, the RF model was built in the final stage.

The comparison of the performances of various models on the proposed dataset. (a–f) Five-fold cross-validation test for DT, KNN, XGB, NB, SVM, and RF models. (g–l) ROCs, PRCs, and the confusion matrixes of six ML models with all features. (m) Radar graph showing the comprehensive prediction performances of six ML models with all features. DT, decision tree; KNN, K-nearest neighbor; XGB, extreme gradient boosting; NB, naive Bayes; SVM, support vector machine; RF, random forest; MASLD, metabolic dysfunction-associated steatotic liver disease; ROC, receiver operating characteristic; AUC, the area under the ROC curve; AP, average precision.
The comprehensive evaluations for ML models with all features
Figure 2(g)–(l) shows the specific receiver operating characteristic (ROC) curves, precision-recall curves (PRCs), and confusion matrixes in the prediction process. The RF model had the highest AUC of 0.889 (95% CI, 0.865, 0.910), and AP of 0.800 (95% CI, 0.757, 0.839) compared with the other five models.
Figure 2(m) shows the result of radar plot analysis, which is a blanket, clear, intuitive, and easy-to-judge analysis and is suitable for comprehensive evaluation as it can show the AUC, AP, accuracy, sensitivity, specificity, and F1 values of different models in multiple dimensions to more clearly reflect the performances of the models. The results suggested that the RF model with all features performed best. More specific values are shown in Table 2.
The comparison of the performances of various models with all features.

DT, decision tree; KNN, K-nearest neighbor; XGB, extreme gradient boosting; NB, naive Bayes; SVM, support vector machine; RF, random forest; AUC, the area under the receiver operating characteristic curve; AP, average precision.
Interpretable RF model
Hyperparameters of the RF model
The optimal hyperparameters were obtained by the GridSearchCV. Table 3 shows that the parameter combination of criterion = entropy, n_estimators = 500, min_sample leaf = 6, min_sample split = 5, and max_depth = 6 was the optimal setting for the RF model in this research.
The RF model's general hyperparameters configurations and optimal hyperparameters settings of the dataset.

RF, random forest.
criterion: the measure for splitting the decision tree nodes; n_ estimators: the number of decision trees in the forest; min_samples leaf: the minimum number of observations required in the terminal node or leaf; min_ samples split: the minimum number of observations required to split a node; max_depth: the maximum depth of the decision tree.
Establishment and global interpretation of the RF model
Figure 3(a) shows the results of abilities to predict the chances of MASLD in different models when using all variable data. The RF model performed best with the largest AUC of 0.889. Then, the SHAP values of the RF model were calculated to determine the global feature importance rank across the study populations.

Global interpretation of the RF model on the test dataset. (a) The ROC curves of different models predicting the chances of MASLD. (b) SHAP summary histogram plots showing the most important features for predicting good functional outcomes for patients with hypertension and pre-hypertension. (c) The scatter plot of the feature density according to the important ranking. The red dot represents the high feature value of the patient, while the blue dot indicates the low potential feature value. For binary categorical features, a “low” feature value indicates its absence and a “high” value indicates its presence. (d) Visualization of the sixth decision tree in the RF model. MASLD, metabolic dysfunction-associated steatotic liver disease; SVM, Support Vector Machine; ROC, receiver operating characteristic; AUC, the area under the ROC curve; SHAP, Shapley Additive Explanation; BMI, body mass index; WC, waist circumference; SBP, systolic blood pressure; DBP, diastolic blood pressure; ALT, alanine aminotransferase; AST, aspartate aminotransferase; GGT, gamma-glutamyl transferase; HDL-C, high-density lipoprotein cholesterol; LDL-C, low-density lipoprotein cholesterol; TC, total cholesterol; TG, triglyceride; FPG, fasting plasma glucose; HbA1c, hemoglobin A1c; RF, random forest.
Figure 3(b) demonstrates that the most important features notably affected the outcomes of the model were ALT, BMI, WC, HDL-C, and TG. The features were sorted by the mean absolute values of SHAP which represent the importance of SHAP global feature.
Figure 3(c) displays the feature density according to the important ranking. The HDL-C exhibited a strong negative correlation with the final results, whereas ALT had a strong positive correlation with the final results. On the other hand, exercise habits, drinking status, and smoking status were ambiguous in the final results. Therefore, the hypertensive and pre-hypertensive patients with high ALT or low HDL-C levels had a higher incidence of MASLD. In addition, the remaining features were positively correlated with the model outcomes.
Figure 3(d) presents the sixth DT of the RF model, providing an interpretive framework for distinguishing patients with or without MASLD. It elaborates on the whole process of how the DT in the RF model could judge whether the hypertensive and pre-hypertensive patient has MASLD according to the given values of the features. When the node is colored yellow, it indicates that the patient suffers from MASLD, and the darker the color, the higher the incidence of the disease. On the contrary, if the node is blue, it implies that the patient has no MASLD, and the darker the color, the higher the chances of non-MASLD. However, if the nodes of the whole judgment process have no child nodes, it means the process is over. In this decision-making process, the value of FPG was first judged, and LDL-C, BMI, ALT, GGT, and TG were recognized as the dominant features, further confirming the correctness of the features’ important ranking in Figure 3(b) and (c) and explaining the working principle of the RF model from a macro perspective.
Local interpretation of the RF model
The principal component analysis (PCA) was used to reduce all data in the dataset into two-dimensional data, and the corresponding scatter diagram was drawn in Figure 4(a). The “force plot” function in the SHAP package was used to determine the overall SHAP value for each patient. Combining the features that push up (red, contributing to a higher chance of MASLD) and push down (blue, contributing to a lower chance of MASLD) the overall SHAP value, the overall SHAP value of this patient as a functional outcome of being MASLD was obtained. Specifically, four typical sample cases were selected, with functional outcomes of 0.08, 0.22, 0.55, and 0.83. It can be further observed from these four typical patients that ALT, BMI, and WC exerted a strong driving effect on predicting the chances of MASLD, and ALT, BMI, WC, AST, HDL-C, and TG played a dominant role in the final output of the model (Figure 4(b)).

Local interpretation of the RF model. (a) Two-dimensional scatter diagram of the dataset by principal component analysis (PCA) dimensionality reduction. (b and c) Hierarchical study population clustering by using SHAP value feature weightings to quantify the patient similarity. The figure is available in color online only. MASLD, metabolic dysfunction-associated steatotic liver disease; BMI, body mass index; WC, waist circumference; SBP, systolic blood pressure; DBP, diastolic blood pressure; ALT, alanine aminotransferase; AST, aspartate aminotransferase; GGT, gamma-glutamyl transferase; HDL-C, high-density lipoprotein cholesterol; LDL-C, low-density lipoprotein cholesterol; TC, total cholesterol; TG, triglyceride; FPG, fasting plasma glucose; HbA1c, hemoglobin A1c.
Then, the force plot was rotated counterclockwise by 90°, and the process was repeated for a sample of 500 patients in the test dataset, providing a global graph of the probability of being MASLD in the test dataset clustered by similar risk factors combinations (Figure 4(c)). The common features of patient subgroups with high (red) or low (blue) predicted probabilities are shown below the plot. From the figure, it can be seen that the driving factors of the RF model for high-risk patients were mainly ALT, WC, BMI, TG, AST, and HDL-C.
Consistent with the summary plot of importance ranking, hierarchical clustering shows that the abnormal levels of ALT, WC, BMI, TG, AST, and HDL-C tended to constitute a subset with a higher incidence of MASLD. However, when HDL-C, WC, ALT, and BMI were at normal levels, the prediction results were more likely to be disease-free for hypertensive and pre-hypertensive patients.
More importantly, normal or abnormal levels of some important features do not always determine whether a pre-hypertensive or hypertensive patient has MASLD. For example, patients with normal levels of TG, BMI, and HDL-C still had a higher incidence of MASLD, which may be due to higher ALT or AST levels dominating this trend. On the contrary, patients with high levels of TG and GGT had a lower incidence of MASLD, which may be due to features like WC, BMI, and ALT alleviating the effect of the former on induction.
Variable correlation analysis and interaction effects
Figure 5(a) illustrates the correlation analysis among the five important features mentioned in the above analysis, namely ALT, BMI, HDL-C, AST, and TG. HDL-C had a strong negative correlation with TG, with a correlation coefficient of −0.45, and all other features also had a negative correlation with HDL-C. AST and ALT had a strong positive correlation with a correlation coefficient of 0.78. In addition, the correlation coefficients between AST and BMI, AST and TG were 0.26 and 0.19 respectively.

Variable correlation analysis and interaction effects on the RF model. (a) Scatter plot and histogram matrix for the correlation of the top 5 important features. (b) Partial dependence plot (PDP) of top 10 important features according to the SHAP summary histogram plots. (c) Variable interaction effects between sex and HDL-C quantified by SHAP interaction values. (d) Variable interaction effects between sex and ALT quantified by SHAP interaction values. MASLD, metabolic dysfunction-associated steatotic liver disease; BMI, body mass index; WC, waist circumference; SBP, systolic blood pressure; DBP, diastolic blood pressure; ALT, alanine aminotransferase; AST, aspartate aminotransferase; GGT, gamma-glutamyl transferase; HDL-C, high-density lipoprotein cholesterol; LDL-C, low-density lipoprotein cholesterol; TC, total cholesterol; TG, triglyceride; FPG, fasting plasma glucose; HbA1c, hemoglobin A1c; SHAP, Shapley additive explanation; RF, random forest.
Figure 5(b) illustrates the impact of each feature on the disease prediction for individual patients and the overall average influence of the respective feature across the entire sample. Except for HDL-C, the top ten features had strong positive correlations with the result. This can be explained that when the outcome of the model was 0.83, the lower the HDL-C level of patients, the higher the chances of MASLD.
When examining the SHAP interaction values, the strongest and most consistent interactions were related to sex. Figure 5(c) shows the interaction of sex with HDL-C. Particularly, female patients with lower HDL-C levels had a higher incidence of MASLD. Figure 5(d) illustrates the interaction of sex with the pivotal feature ALT. The likelihood of MASLD in males exhibits a swift escalation in tandem with increasing ALT levels. Visualizing the response function and bias analysis of a single feature in the model can enable us to comprehend the relationship between features and response variables, thus enhancing the interpretability and visualization of the RF model.
Numbers of variable selection analysis
To explore the coupling between the features, the influence of the number of important features on the RF model outcomes was further studied. Figure 6(a) shows that when considering only the top five features, the RF model performed with an AUC value of 0.876 (95%CI, 0.851–0.899). When the number of features increased to the top 10, the AUC value increased to 0.887 (95%CI, 0.866–0.907) which implied increasing the number of features to the top 10 indeed improved the effectiveness of identifying MASLD. However, when the number of features increased to the top 15, the AUC value was 0.888 (95%CI, 0.867–0.910), demonstrating that the five new features (gender, SBP, DBP, TC, and drinking status) slightly improve the MASLD identification ability. In general, when the top five or ten features were used, the model exhibited a notably enhanced accuracy, further emphasizing the importance of these specific features in MASLD diagnosis. Although the remaining variables had a small improvement on the results, their contribution was significantly reduced compared to the top ten features. When all indicators were used, the RF model achieved the highest AUC value of 0.889 (95%CI, 0.865–0.910).

The performances of the RF model with different features. (a) ROC curves of the RF models with different features for the test set. (b) Radar graph showing the comprehensive prediction performances of the RF models with different features for the test set. RF, random forest; MASLD, metabolic dysfunction-associated steatotic liver disease; ROC, receiver operating characteristic; AUC, the area under the ROC curve.
Figure 6(b) and Table 4 detailedly describe the AUC, accuracy, sensitivity, specificity, and F1 values of each RF model with different features. The results suggested that the RF model performed best when all features were used, which was the model we used in this research.
The performances of the RF models with different features.

RF, random forest; AUC, the area under the receiver operating characteristic curve.
Discussion
In this study, we developed several ML models for identifying MASLD in hypertensive and pre-hypertensive patients and provided global and local interpretation for the model results using the SHAP values, elaborating how various features affect the chances of MASLD. To the best of our knowledge, this is the first study about the identification of MASLD in pre-hypertensive and hypertensive patients via ML.
Hypertension is closely related to the onset, progression, and prognosis of MASLD. Despite numerous studies suggesting a bidirectional relationship between MASLD and hypertension, a confirmed causal relationship has not been established. 30 The underlying mechanism of the relationship between hypertension and MASLD might be insulin resistance, systemic inflammation, activation of the renin-angiotensin-aldosterone system and sympathetic nervous system, oxidative stress, gut microbiota disbalance, sex hormone, and genetic factors. 31 In hypertensive patients, the prevalence of hepatic steatosis exhibits a direct correlation with the severity of hypertension. 32 Additionally, a history of hypertension increases the risk of developing MASLD. 33 In our study, the incidence of MASLD was higher in hypertensive patients compared to pre-hypertensive patients. Compared to previous studies, the prevalence of MASLD in these two groups significantly exceeded that of the general population in the same region. 34 A meta-analysis revealed that the presence of hypertension at the time of initial liver biopsy was identified as a risk factor for progressive fibrosis in patients with MASLD. 35 Epidemiological studies have indicated that patients with both hypertension and MASLD had poor prognosis. 30 In comparison to patients with MASLD alone, those with concomitant hypertension and MASLD had a higher risk of cardiovascular disease death. 17 Timely control of hypertension to achieve the target value of blood pressure can decrease the likelihood of MASLD by more than 40% and reduce the risk of liver fibrosis progression. 15 In addition, dietary approaches to stop hypertension diet improve hepatic fibrosis, steatosis, liver enzymes, oxidative stress, and body composition in patients with MASLD.36,37
Early identification is crucial for effectively preventing, treating, and delaying the disease progression of MASLD, 38 especially in hypertensive and pre-hypertensive patients. Compared with traditional models, advanced ML technologies provide researchers with enhanced capabilities to develop optimized disease prediction models. 39 Liu et al. evaluated selected clinical and biochemical factors to predict MASLD using various ML algorithms, among which the AUC, accuracy, sensitivity, specificity, and F1 of the optimal model were at relatively high levels akin to our research, showcasing the good performance of the models. 40 However, this study lacked a detailed local and global explanation. Deng et al. used a time series deep learning model with longitudinal health examination records to predict the onset of MASLD in the future and continuously updated the model by incorporating the new examination records for dynamic prediction, but the AUC of the model did not reach a very high level. 41 What is more, despite numerous ML studies on MASLD, there is currently no MASLD identification model targeting the specific high-risk population of hypertensive and prehypertensive patients, and our research just fills this gap. Previous research found that the identification of novel predictors for fibrosis and steatohepatitis and the improvement of the prediction accuracy of fibrosis in MASLD can be facilitated via the RF model.42,43 In addition, the five-gene prediction model seeking MASLD candidate therapeutic targets based on minimum depth RF had good calibration and performance. 44 Our study demonstrated that among the six models used on the proposed dataset, the RF model exhibited the best performance in predicting the chances of MASLD in pre-hypertensive and hypertensive patients.
One of the foremost challenges in MASLD identification and management is understanding which features are associated with satisfactory model outcomes. We endeavored to address this problem by applying predictive ML models to a large-scale patient dataset before using the models and explaining their predictions with game theory-based solution concepts. By using ML, we identified several features strongly associated with MASLD in pre-hypertensive and hypertensive patients. The ALT was the most important feature because it invariably influenced the RF model outcome. The ALT, a standard and widely used indicator of liver function, is closely related to glucose and lipid metabolism disorders, 45 inflammation, and oxidative stress. 46 Elevated ALT concentration increases heart rate, 47 arterial stiffness, 48 and the risk of carotid atherosclerosis, 49 all of which are pathophysiological mechanisms of hypertension. Individuals with elevated ALT levels had a higher prevalence of hypertension compared to those with normal levels. 50 Additionally, there was also a linear and robust correlation between ALT level and SBP or DBP. SBP and DBP increased with the elevation of serum ALT levels in both hypertensive and normotensive people. 50 Furthermore, ALT has also been implicated in liver fat accumulation, the pathogenesis of MASLD. 51 ALT levels are normally low in the serum of healthy individuals, and elevated ALT levels usually indicate hepatocellular injury or apoptosis. 52 Previous studies have also shown that a higher ALT level at baseline was an independent risk factor for the development of MASLD, even in healthy subjects, and the ALT level was proved as a surrogate marker in the diagnosis of MASLD with high sensitivity and specificity,53,54 which confirmed that this ML-based approach seems to produce valid results. In addition, in a general population-based ML study of MASLD prediction, ALT was identified as the second most crucial predictor, affirming that ALT is also an important predictor of MASLD in the general population. 41
Additionally, BMI, WC, TG, and HDL-C are crucial features that warrant particular attention. MASLD is characterized by the massive accumulation of lipids in the liver and the subsequent increase of inflammatory cytokines and adipokines, in which TG and HDL-C play important roles. 55 BMI and WC are important indicators to evaluate obesity, which is considered chronic low-grade inflammation and is closely related to MASLD. 56 With the increasing number of obese people, the disease burden of MASLD in Western countries and Asia is projected to increase two to three times by 2030. 57 Pan et al. identified that high BMI, WC, and TG were risk factors for MASLD, while high HDL-C levels were protective. 58 Similarly, Peng et al. found that the visceral adiposity index, calculated by BMI, WC, TG, and HDL-C, ranked first in testing the best predictive characteristics of risk factors in patients with MASLD. In our study, BMI, WC, TG, and HDL-C were the top five variables, ranking second to ALT. 55 Moreover, patients with pre-hypertension and hypertension tend to have higher BMI and lipid levels compared with normotensive individuals. 59 Given that MASLD is a metabolism-related disease, and BMI, WC, TG, and HDL-C are all metabolism-related indicators, their high importance in our research is aligned with the metabolic nature of MASLD. 60
Under the guidance of ML-based variable selection, this study applied a new propensity score matching analysis to the data of the previous study, providing another data for the literature on this topic. However, formal data with well-defined patient groups and clinical features are needed to shift the current paradigm for MASLD research because it provides an optimal opportunity to understand some of the fundamental features associated with clinicians’ decisions on whether patients suffer from MASLD. Our study improves an intuitive understanding of how the features affect the ML models’ predicted outcomes. The findings may aid in the development of identifying MASLD, enabling clinicians to more accurately diagnose MASLD and optimize clinical variables usage.
There are some limitations of this study that deserve to be mentioned. First, due to its unsatisfactory sensitivity, ultrasonography is not the gold standard for the diagnosis of MASLD. However, in this investigation, the liver biopsy could not be performed on all populations, which might influence the reliability of the outcomes. Second, although high-quality data from large sample sources may increase the power of our analysis, these data were obtained from specific regional populations, which may limit the external validity of our findings. Finally, restricting the analysis to the variables available in the clinical dataset may prevent the detection of other features that affect MASLD.
Conclusion
ML algorithms, especially RF algorithm, improve the accuracy of MASLD identification in patients with hypertension and pre-hypertension, which can help clinicians make early diagnosis and prevention in the clinic. Meanwhile, global and local interpretation of the results of the RF model enables us to intuitively understand how various features affect the chances of MASLD in this kind of patient.
Supplemental Material
sj-docx-1-dhj-10.1177_20552076241233135 - Supplemental material for Identifying metabolic dysfunction-associated steatotic liver disease in patients with hypertension and pre-hypertension: An interpretable machine learning approach
Supplemental material, sj-docx-1-dhj-10.1177_20552076241233135 for Identifying metabolic dysfunction-associated steatotic liver disease in patients with hypertension and pre-hypertension: An interpretable machine learning approach by Chen Chen, Wenkang Zhang, Gaoliang Yan and Chengchun Tang in DIGITAL HEALTH
Footnotes
Acknowledgments
The authors thank the investigators and the participants of the original study for their contributions.
Availability of data and materials
The datasets analyzed during the current study are available in the DRYAD repository, ![]() .
19
.
19
Contributorship
Chen Chen contributed to data collection, analysis, and interpretation. Wenkang Zhang contributed to the conception and design, data analysis, and interpretation. Gaoliang Yan contributed to the conception and design. Chengchun Tang provided administrative support. All authors reviewed and edited the manuscript and approved the final version of the manuscript.
Declaration of conflicting interests
The authors declared no potential conflicts of interest with respect to the research, authorship, and/or publication of this article.
Ethical approval
The ethics committee of Murakami Memorial Hospital approved this study.
Funding
The authors disclosed receipt of the following financial support for the research, authorship, and/or publication of this article: This work was supported by the National Natural Science Foundation of China (82170433).
Guarantor
Chengchun Tang.
Supplemental material
Supplemental material for this article is available online.
References
Supplementary Material
Please find the following supplemental material available below.
For Open Access articles published under a Creative Commons License, all supplemental material carries the same license as the article it is associated with.
For non-Open Access articles published, all supplemental material carries a non-exclusive license, and permission requests for re-use of supplemental material or any part of supplemental material shall be sent directly to the copyright owner as specified in the copyright notice associated with the article.