
Abstract
Background
Accurate preoperative staging of gastric cancer (GC) is essential for guiding treatment strategies. However, reliable noninvasive tools for distinguishing early-stage from advanced-stage GC remain limited.
Methods
This retrospective study enrolled 434 patients with GC. Eleven supervised machine learning algorithms were developed using preoperative laboratory parameters and engineered ratio features capturing inflammatory, metabolic, and tumor-related profiles. CatBoost showed superior performance and was selected for SHapley Additive exPlanations (SHAP)-based interpretation. A forward feature selection strategy identified an optimal nine-feature panel. Model performance was evaluated by area under the receiver operating characteristic curve (AUC), accuracy, precision, recall, and F1-score, with robustness validated through repeated 10-fold cross-validation and 1000 bootstrap iterations.
Results
Among 434 patients, 251 (57.8%) had stage I and 183 (42.2%) had stages II–III disease. Incorporating biologically informed ratio features significantly enhanced model performance; CatBoost's AUC improved from 0.802 to 0.981. SHAP-based selection yielded a compact, interpretable nine-feature model. The final CatBoost model achieved a mean AUC of 0.9499 (95% confidence interval (CI): 0.9421–0.9570), with high consistency across cross-validation folds. SHAP analysis identified uric acid (UA) and APTT as key predictors, and interaction analysis revealed stable multivariate relationships, supporting the model's biological plausibility.
Conclusions
We developed a robust, interpretable machine learning model for GC staging using routine blood tests and derived ratio features. The model demonstrated excellent discrimination, interpretability, and clinical utility, offering a practical tool for personalized risk stratification and treatment planning.
Introduction
Gastric cancer (GC) remains one of the most prevalent and lethal malignancies globally, ranking as the fifth leading cause of cancer-related death worldwide. 1 Prognostic outcomes in GC are heavily stage-dependent, influencing both therapeutic strategies and survival expectations. Patients diagnosed with stage I GC have favorable outcomes, with 5-year survival rates exceeding 90%.2–4 In contrast, survival drops markedly in advanced disease, with 5-year survival rates of approximately 60% to 70% for stage II and 20% to 40% for stage III.5,6
According to current guidelines and clinical trial evidence,7–12 endoscopic submucosal dissection is the preferred treatment for early-stage GC, aiming to preserve postoperative quality of life. For patients with stage I disease who have undergone curative resection, routine surveillance is typically sufficient. However, adjuvant chemotherapy is recommended following curative gastrectomy for stages II–III GC to improve both overall survival (OS) and disease-free survival (DFS).13,14 Additionally, mounting evidence supports the use of neoadjuvant therapy in stages II–III GC, which has been shown to enhance resection rates and improve long-term outcomes.15–19 These findings underscore the critical need for accurate staging at diagnosis to inform individualized treatment strategies and optimize both prognosis and quality of life.
Currently, preoperative staging of GC relies heavily on imaging modalities such as computed tomography (CT), endoscopic ultrasonography, and magnetic resonance imaging. However, these techniques have notable limitations in accuracy, invasiveness, radiation exposure, and cost.20–23 For instance, Wu et al. 24 reported diagnostic accuracies of only 52.6% for stage T1 and 72.7% for stage T2 based on CT alone. Emerging research suggests that peripheral blood indicators may serve as accessible surrogates reflecting the tumor microenvironment. 25 Unlike imaging, conventional blood tests, including hematological, biochemical, coagulation, and tumor marker panels, offer a noninvasive, rapid, safe, and cost-effective alternative that can be routinely implemented in clinical practice.
In parallel, machine learning (ML) has rapidly advanced as a powerful tool in medicine, capable of uncovering complex patterns within multidimensional clinical data to support precise decision making.26–28 Prior studies have demonstrated the utility of ML models based on routine blood indicators in accurately identifying cancers such as lung and colorectal cancer.29–31 Nevertheless, few studies have explored the integration of ML algorithms with preoperative blood indicators for accurate GC staging, particularly in distinguishing early-stage (stage I) from more advanced disease (stages II–III).
Therefore, this study aimed to develop and validate an interpretable, noninvasive, convenient, and cost-efficient ML model that incorporates routine blood indicators, including complete blood counts, liver and kidney function tests, coagulation parameters, tumor markers, and derived ratio features, for preoperative GC staging. Specifically, the model seeks to differentiate stage I from stages II–III disease, thereby facilitating individualized clinical decision making, minimizing overtreatment in early-stage patients, and enabling timely adjuvant therapy in those with advanced-stage GC.
Design and method
Patients enrolled and data collection
Between 1 May 2020 and 31 December 2024, a total of 867 patients who underwent radical gastrectomy for histologically confirmed GC at the Department of General Surgery, Peking Union Medical College Hospital (PUMCH) were retrospectively reviewed. After applying predefined exclusion criteria (Figure 1), 433 patients were excluded for the following reasons: receipt of neoadjuvant therapy (n = 328), history of other malignancies in patients who were under any cancer-directed treatment within the 12 months or not in complete remission (n = 32), autoimmune or chronic inflammatory disorders (n = 25), age <18 or >90 years (n = 10), and incomplete clinical or pathological data (n = 38). The final cohort included 434 eligible patients, classified according to the eighth edition of the American Joint Committee on Cancer (AJCC) tumor node metastasis (TNM) staging system: 251 with stage I, 93 with stage II, and 90 with stage III disease. Preoperative clinical characteristics and laboratory parameters collected within 1 week prior to surgery were extracted from electronic medical records. These included complete blood counts, liver and renal function tests, serum electrolytes, coagulation profiles, and tumor markers. Mismatch match repair (MMR) immunohistochemistry (IHC): MMR status was evaluated on formalin-fixed paraffin-embedded sections using antibodies against MLH1, MSH2, MSH6, and PMS2. Deficient MMR (dMMR) was defined as complete loss of nuclear staining in tumor cells with preserved staining in internal controls (stromal or lymphoid cells), while proficient MMR (pMMR) was defined as intact nuclear expression of all four proteins. Surgical specimens of GC were classified as dMMR if either criterion was met: IHC demonstrated complete loss of nuclear expression of one or more MMR proteins (MLH1, PMS2, MSH2, MSH6) in tumor cells with intact internal controls (typical patterns: paired loss of MLH1/PMS2 or MSH2/MSH6; isolated PMS2 or isolated MSH6 loss was also considered dMMR).32–34 All data were independently verified by two trained investigators. This study was conducted in accordance with the Declaration of Helsinki and approved by the Ethics Committee of PUMCH (approval no. I-23PJ2155). Written informed consent was obtained from all participants prior to inclusion.

Patient selection flowchart. A total of 567 patients who underwent radical gastrectomy for gastric cancer at PUMCH between May 2020 and December 2024 were screened. After applying exclusion criteria, 434 patients were eligible for analysis and stratified by pathological stage. The dataset was subsequently split into training (80%) and test (20%) sets for machine learning model development and validation.
Data preprocessing and feature engineering
All data preprocessing and feature engineering procedures were conducted using Python (version 3.9). Raw clinical and laboratory variables were standardized into numerical format via regular expression parsing (pandas v1.5.3). Features with more than 40% missing values, namely serum magnesium (Mg), cancer antigen 125 (CA125), and corrected calcium (CorrCa), were excluded, resulting in 71 initial variables. Missing values in the remaining dataset were imputed using the K-nearest neighbors algorithm (KNNImputer, k = 5). To improve biological interpretability, 25 clinically meaningful ratio and composite features were constructed (Supplemental Table S4). These included: (a) tumor marker ratios: CEA/CA19-9, CA19-9/CA72-4, CA72-4/CEA, AFP/CEA, AFP/CA19-9, and AFP/CA72-4; (b) composite tumor marker load: calculated as the sum, mean, and standard deviation of CEA, CA19-9, CA72-4, and AFP; (c) inflammatory indices: neutrophil-to-lymphocyte ratio (NLR), monocyte-to-lymphocyte ratio (MLR), RDW-CV/HCT, and PLT/PDW; (d) Coagulation markers: APTT-R/prothrombin time (PT), FIB/APTT, and D-dimer/FIB; (e) biochemical ratios: ApoB/ApoA1, LDL-C/HDL-C, TG/HDL-C, Alb(BCG)/A/G, ALT/AST, and Scr/BUN; (f) electrolyte ratios: Na/K, Cl/Na, and Ca/P. Integration of these engineered features with the original variables yielded a total of 96 candidate predictors. Feature selection was performed using SHapley Additive exPlanations (SHAP, shap v0.44.1) based on an XGBoost model (xgboost v1.7.6). Predictors with a mean absolute SHAP value above the median were retained, resulting in a final feature set of 47 variables. To address class imbalance, the Synthetic Minority Over-sampling Technique combined with Edited Nearest Neighbors (SMOTEEN, imblearn v0.10.1) was applied. All features were standardized using Z-score normalization. The dataset was then stratified into training and testing subsets in an 80:20 ratio for downstream ML model development.
Machine learning model development and evaluation
To develop a robust model for predicting pathological stage (stage I vs. stages II–III) in patients with GC, 11 supervised ML algorithms were systematically evaluated. These included: XGBoost (xgboost v1.7.6), LightGBM (lightgbm v3.3.5), CatBoost (catboost v1.2), support vector machine (SVM), k-nearest neighbors (KNN), decision tree, random forest, logistic regression, multilayer perceptron (MLPClassifier), AdaBoost, and ExtraTrees (all implemented using scikit-learn v1.2.2). Model development was carried out in three sequential stages to ensure clarity and reproducibility. Stage 1: All 96 available predictors, including 71 raw clinical/laboratory features and 25 engineered ratio or composite features, were used to train the full panel of classifiers for baseline performance comparison. Stage 2: Feature importance was assessed using SHAP derived from the XGBoost model. The top 50% of predictors, ranked by mean absolute SHAP value, were retained for model refinement (n = 47). Stage 3: The reduced feature set (n = 47) was used for final model training, hyperparameter tuning, and evaluation. To address class imbalance, the SMOTEEN algorithm (imblearn v0.10.1) was applied. All features were standardized using Z-score normalization. Models were trained on the resampled training set and evaluated on an independent 20% hold-out test set. Evaluation metrics included area under the receiver operating characteristic curve (AUC), accuracy, precision, recall, and F1-score. Receiver operating characteristic (ROC) curves and performance summary plots were generated using matplotlib (v3.7.1) and seaborn (v0.12.2). Among all classifiers, CatBoost consistently demonstrated the highest overall predictive performance following the incorporation of engineered ratio features. It was therefore selected as the optimal model for downstream interpretability analysis using SHAP.
Feature selection, model optimization, and validation
Feature selection was guided by SHAP, which ranked input variables according to their mean absolute contribution to the CatBoost model. A cumulative contribution curve was generated to assess the proportion of total model explanatory power captured by the highest-ranking features. To determine the optimal feature subset, a stepwise evaluation was performed using incrementally increasing numbers of top-ranked features (from 5 to 30) based on SHAP importance. For each subset, data preprocessing involved Z-score normalization and class rebalancing using the SMOTEEN algorithm, followed by an 80:20 stratified train–test split to maintain class distribution and ensure sufficient sample sizes for training and evaluation. Each candidate model was trained using CatBoost with fixed hyperparameters (iterations = 500, learning_rate = 0.05, depth = 6) and evaluated across five performance metrics: AUC, accuracy, precision, recall, and F1-score. The subset yielding the highest AUC was selected as the final model, resulting in a nine-feature classifier that achieved a favorable balance between predictive performance and model simplicity. To comprehensively evaluate model robustness and generalizability, two complementary validation strategies were employed. First, repeated stratified 10-fold cross-validation (10 repetitions; 100 folds in total) was used to estimate performance variability across random splits. The mean ROC curve and its 95% confidence band were plotted to visualize model stability. Second, nonparametric bootstrap resampling (1000 iterations) was applied to derive the empirical distribution of AUC and compute its 95% confidence interval. All analyses were performed in Python 3.9 using pandas, catboost, shap, scikit-learn, and imblearn, with a fixed random seed (random_state = 42) to ensure reproducibility.
Model explainability via SHAP analysis
To enable transparent interpretation of the final CatBoost model, SHAP was applied using the model-specific TreeExplainer. SHAP values were computed on the independent test set to quantify each feature's marginal contribution to the predicted probability of advanced-stage disease (stages II–III vs. stage I). Global importance was assessed through summary bar plots and distribution visualizations based on mean absolute SHAP values, revealing both the relative influence and directional impact of key predictors. For individualized interpretation, SHAP force plots were generated to attribute case-level risk to specific features, enabling clinically interpretable stratification. In addition, SHAP interaction values were used to capture nonlinear dependencies among features, and a pairwise interaction heatmap was constructed across the top nine predictors to visualize synergistic or antagonistic effects. This multilevel SHAP framework provided both global and local model interpretability, facilitating biological plausibility assessments and enhancing the transparency of ML-assisted gastric cancer staging. All analyses were implemented using the shap Python package (v0.44.1).
Statistical analysis
Statistical analyses were performed using SPSS (version 26.0; IBM Corp., Armonk, NY, USA) and Python (version 3.9). The distributional normality of continuous variables was assessed using the Kolmogorov–Smirnov test. Variables conforming to normal distribution were expressed as mean ± standard deviation and compared using independent samples t-tests; non-normally distributed variables were presented as median with interquartile range (IQR) and compared using the Mann–Whitney U test. Categorical variables were summarized as counts and proportions and evaluated using the chi-square test or Fisher's exact test, as appropriate. To identify statistically significant differences between stage I and stages II–III GC, group-wise comparisons were performed for both clinical and laboratory variables. Subgroup analyses across all three TNM stages (I, II, III) were also conducted for exploratory purposes, with detailed results provided in the Supplemental Tables. A two-sided p-value < 0.05 was considered statistically significant. All data preprocessing, visualization, and ML analyses were conducted in Python using the following libraries: pandas (v1.5.3), numpy (v1.23.5), matplotlib (v3.7.1), seaborn (v0.12.2), and scikit-learn (v1.2.2).
Results
Baseline characteristics of the study population
A total of 434 patients with histologically confirmed GC were included in the final analysis, comprising 251 (57.8%) with pathological stage I and 183 (42.2%) with stages II–III disease. Detailed demographic, clinical, and pathological characteristics are summarized in Table 1, and baseline laboratory parameters are presented in Table 2. Significant differences in clinical and pathological features were observed between stage I and stages II–III groups. Patients with advanced-stage disease were more likely to have a family history of cancer, undergo open surgery, and present with poorly differentiated tumors. Diffuse or mixed Lauren classification, presence of vascular tumor emboli, and perineural invasion were also more prevalent in stages II–III patients. Moreover, MMR status (deficiency vs. proficiency), evaluated by immunohistochemistry for MLH1, MSH2, MSH6, and PMS2, and negative EBER-ISH status were significantly different between groups. Overall, dMMR was identified in 25 of 434 tumors (5.8%). There was no difference (p = 0.52) in dMMR rate between stage I (16/251, 6.4%) and stages II–III (9/183, 4.9%). The absolute number of dMMR tumors was small (n = 25) and the study might be underpowered to detect stage-wise small differences in dMMR prevalence. However, this trend is consistent with prior literature showing that MSI-H/dMMR GCs tend to present at earlier pathological stages.35–37 We will expand the sample size in future studies to further explore the relationship between dMMR rate and GC staging. As expected, T and N staging categories differed significantly between groups, confirming progressive pathological burden. In terms of preoperative laboratory indicators, several markers showed statistically significant stage-related differences. Compared with stage I, patients with stages II–III GC exhibited significantly lower levels of prealbumin, albumin, UA, hemoglobin, HCT, MCH, and MCHC. In contrast, fibrinogen, APTT, APTT ratio, thrombin time, and RDW-CV were significantly elevated in advanced-stage disease. Additionally, ChE levels differed markedly between groups, potentially reflecting nutritional and metabolic alterations associated with tumor progression. Further subgroup analyses (Supplemental Tables S1–S3) revealed that differences in laboratory parameters were most pronounced between stage I and stage III, including lower UA, prealbumin, and ChE, alongside higher fibrinogen and APTT in stage III. Thus, stage I gastric cancers displayed distinct hematologic, metabolic, and nutritional profiles compared with stage II disease, whereas stages II and III were largely comparable, differing only in fibrinogen levels. These patterns suggest marked biological separation between early- and advanced-stage disease, but relative homogeneity across advanced stages.
Comparison of basic clinical characteristics in stages I to III GC groups.

Data are presented as mean ± SD or median (interquartile range) for continuous variables, and n (%) for categorical variables. p-Values were calculated using χ² test or Fisher's exact test for categorical variables and Student's t test or Mann–Whitney U test for continuous variables, as appropriate. *p < 0.05, *p < 0.01, ***p < 0.001.
dMMR: deficient mismatch repair proteins; EBER-ISH: Epstein-Barr Virus-encoded RNA in situ hybridization; GC: gastric cancer; pMMR: proficient MMR.
Comparison of baseline of blood indicators of stages I to III GC groups.
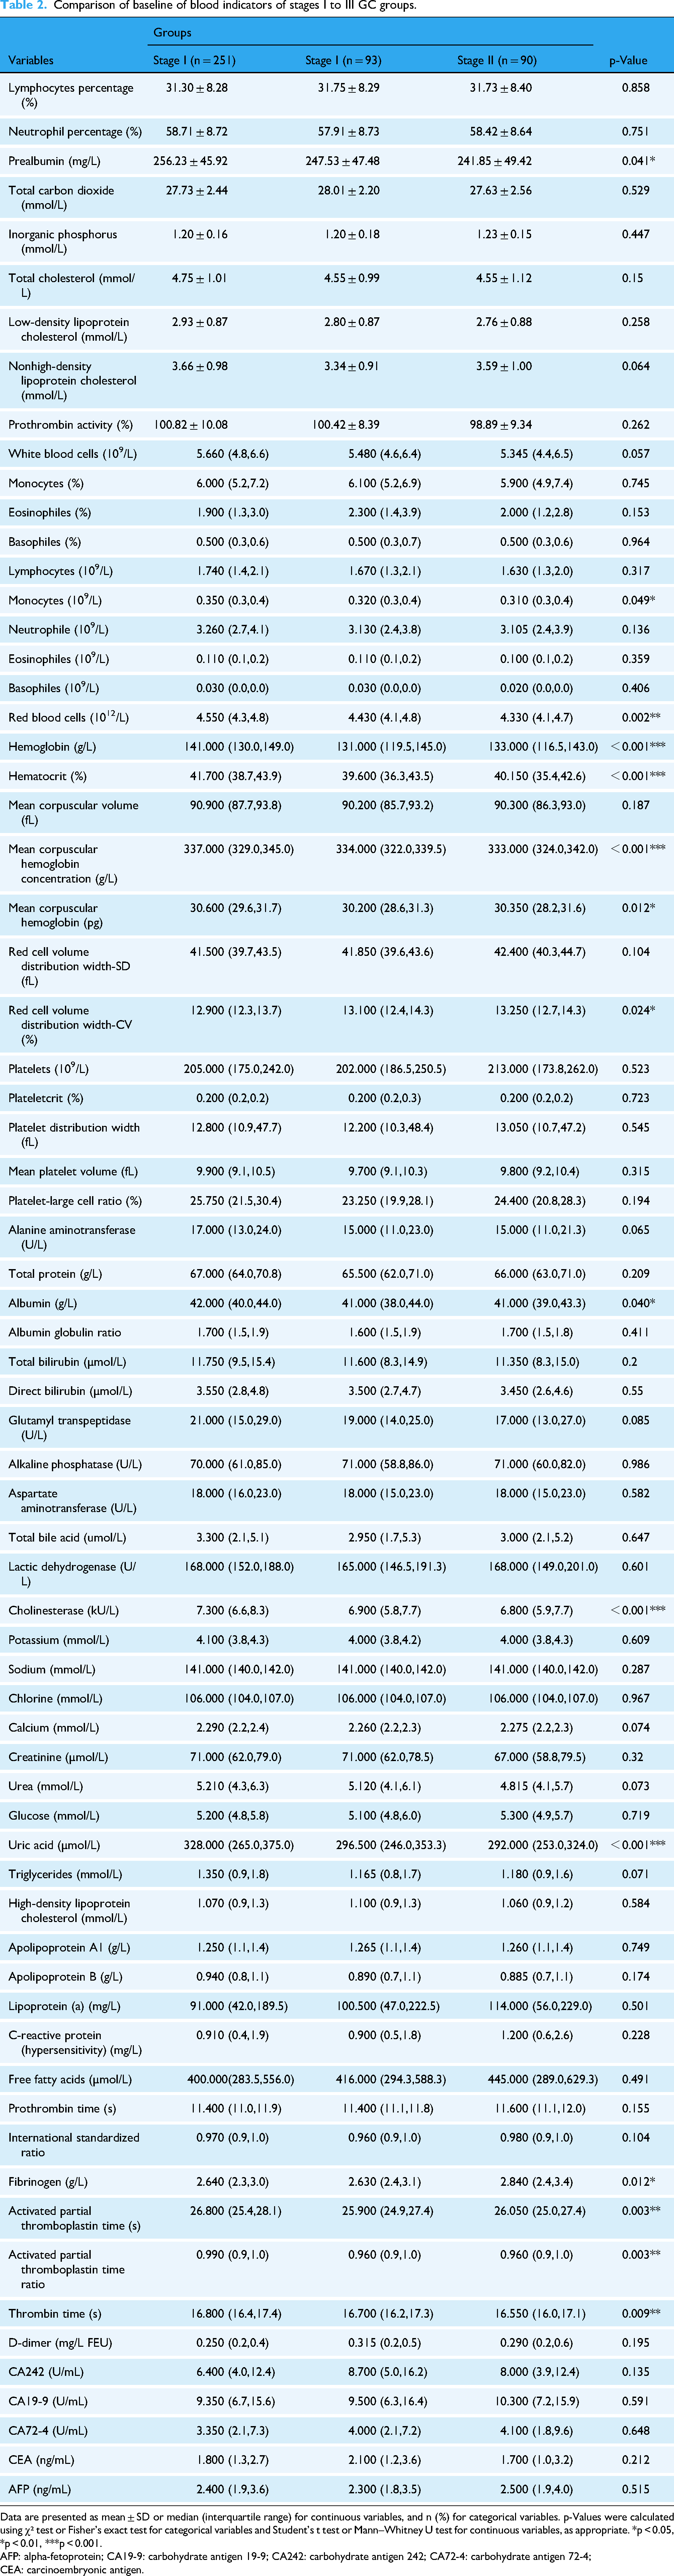
Data are presented as mean ± SD or median (interquartile range) for continuous variables, and n (%) for categorical variables. p-Values were calculated using χ² test or Fisher's exact test for categorical variables and Student's t test or Mann–Whitney U test for continuous variables, as appropriate. *p < 0.05, *p < 0.01, ***p < 0.001.
AFP: alpha-fetoprotein; CA19-9: carbohydrate antigen 19-9; CA242: carbohydrate antigen 242; CA72-4: carbohydrate antigen 72-4; CEA: carcinoembryonic antigen.
Performance of machine learning models without and with ratio features
Baseline benchmarking using the original preoperative biomarkers revealed that ensemble-based classifiers outperformed simpler algorithms in distinguishing early- from advanced-stage GC. ExtraTrees (AUC = 0.812), CatBoost (AUC = 0.802), and MLPClassifier (AUC = 0.802) achieved the highest discriminative capacity, whereas models such as KNN (AUC = 0.686), Decision Tree (AUC = 0.676), and AdaBoost (AUC = 0.663) showed limited predictive value (Figure 2(A) and (B)). These findings emphasize the advantage of advanced algorithms in capturing complex, nonlinear patterns embedded within raw clinical variables. To enhance predictive informativeness and capture interaction effects overlooked by single-variable inputs, a set of biologically relevant ratio features, such as RDW/HCT, AFP/CEA, TG/HDL, and APTT/PT, was engineered and integrated alongside the original biomarkers. This augmentation led to marked and consistent gains in classification performance across all tested algorithms (Figure 2(D) and (E)). The improvement was most pronounced for CatBoost, whose AUC rose from 0.802 to 0.981, accuracy from 0.657 to 0.885, and F1-score from 0.657 to 0.876 (Table 3). Similar yet slightly smaller gains were observed for XGBoost (AUC = 0.767 → 0.925) and LightGBM (AUC = 0.742 → 0.931), while even relatively low-performing models such as SVM (AUC = 0.735 → 0.856) and KNN (AUC = 0.686 → 0.850) benefited substantially, illustrating the broad applicability of these engineered ratios. Model interpretability analyses further clarified the impact of feature enhancement. In the raw-feature setting, top contributors included UA, APTT, CEA, and CA242, consistent with established roles for metabolic, coagulative, and tumor-associated pathways in GC progression (Figure 2(C)). Following ratio feature integration, composite indices such as RDW/HCT and AFP/CEA surpassed many traditional markers in predictive importance, although UA and CA242 retained their high rankings (Figure 2(F)), underscoring their persistent relevance for stage differentiation. Robustness was assessed through sensitivity analyses across multiple training–test partitions (80:20, 70:30, 60:40) and resampling strategies (SMOTE-ENN vs. no resampling). As shown in Supplemental Figure S1, SMOTE-ENN application yielded consistent performance gains in all configurations, with CatBoost achieving the highest AUCs, up to 0.981 in the 80:20 split. In contrast, omitting oversampling resulted in notable performance declines, illustrating the necessity of addressing class imbalance during model development.
Performance of machine learning classifiers with raw features alone versus combined raw and engineered ratio features.
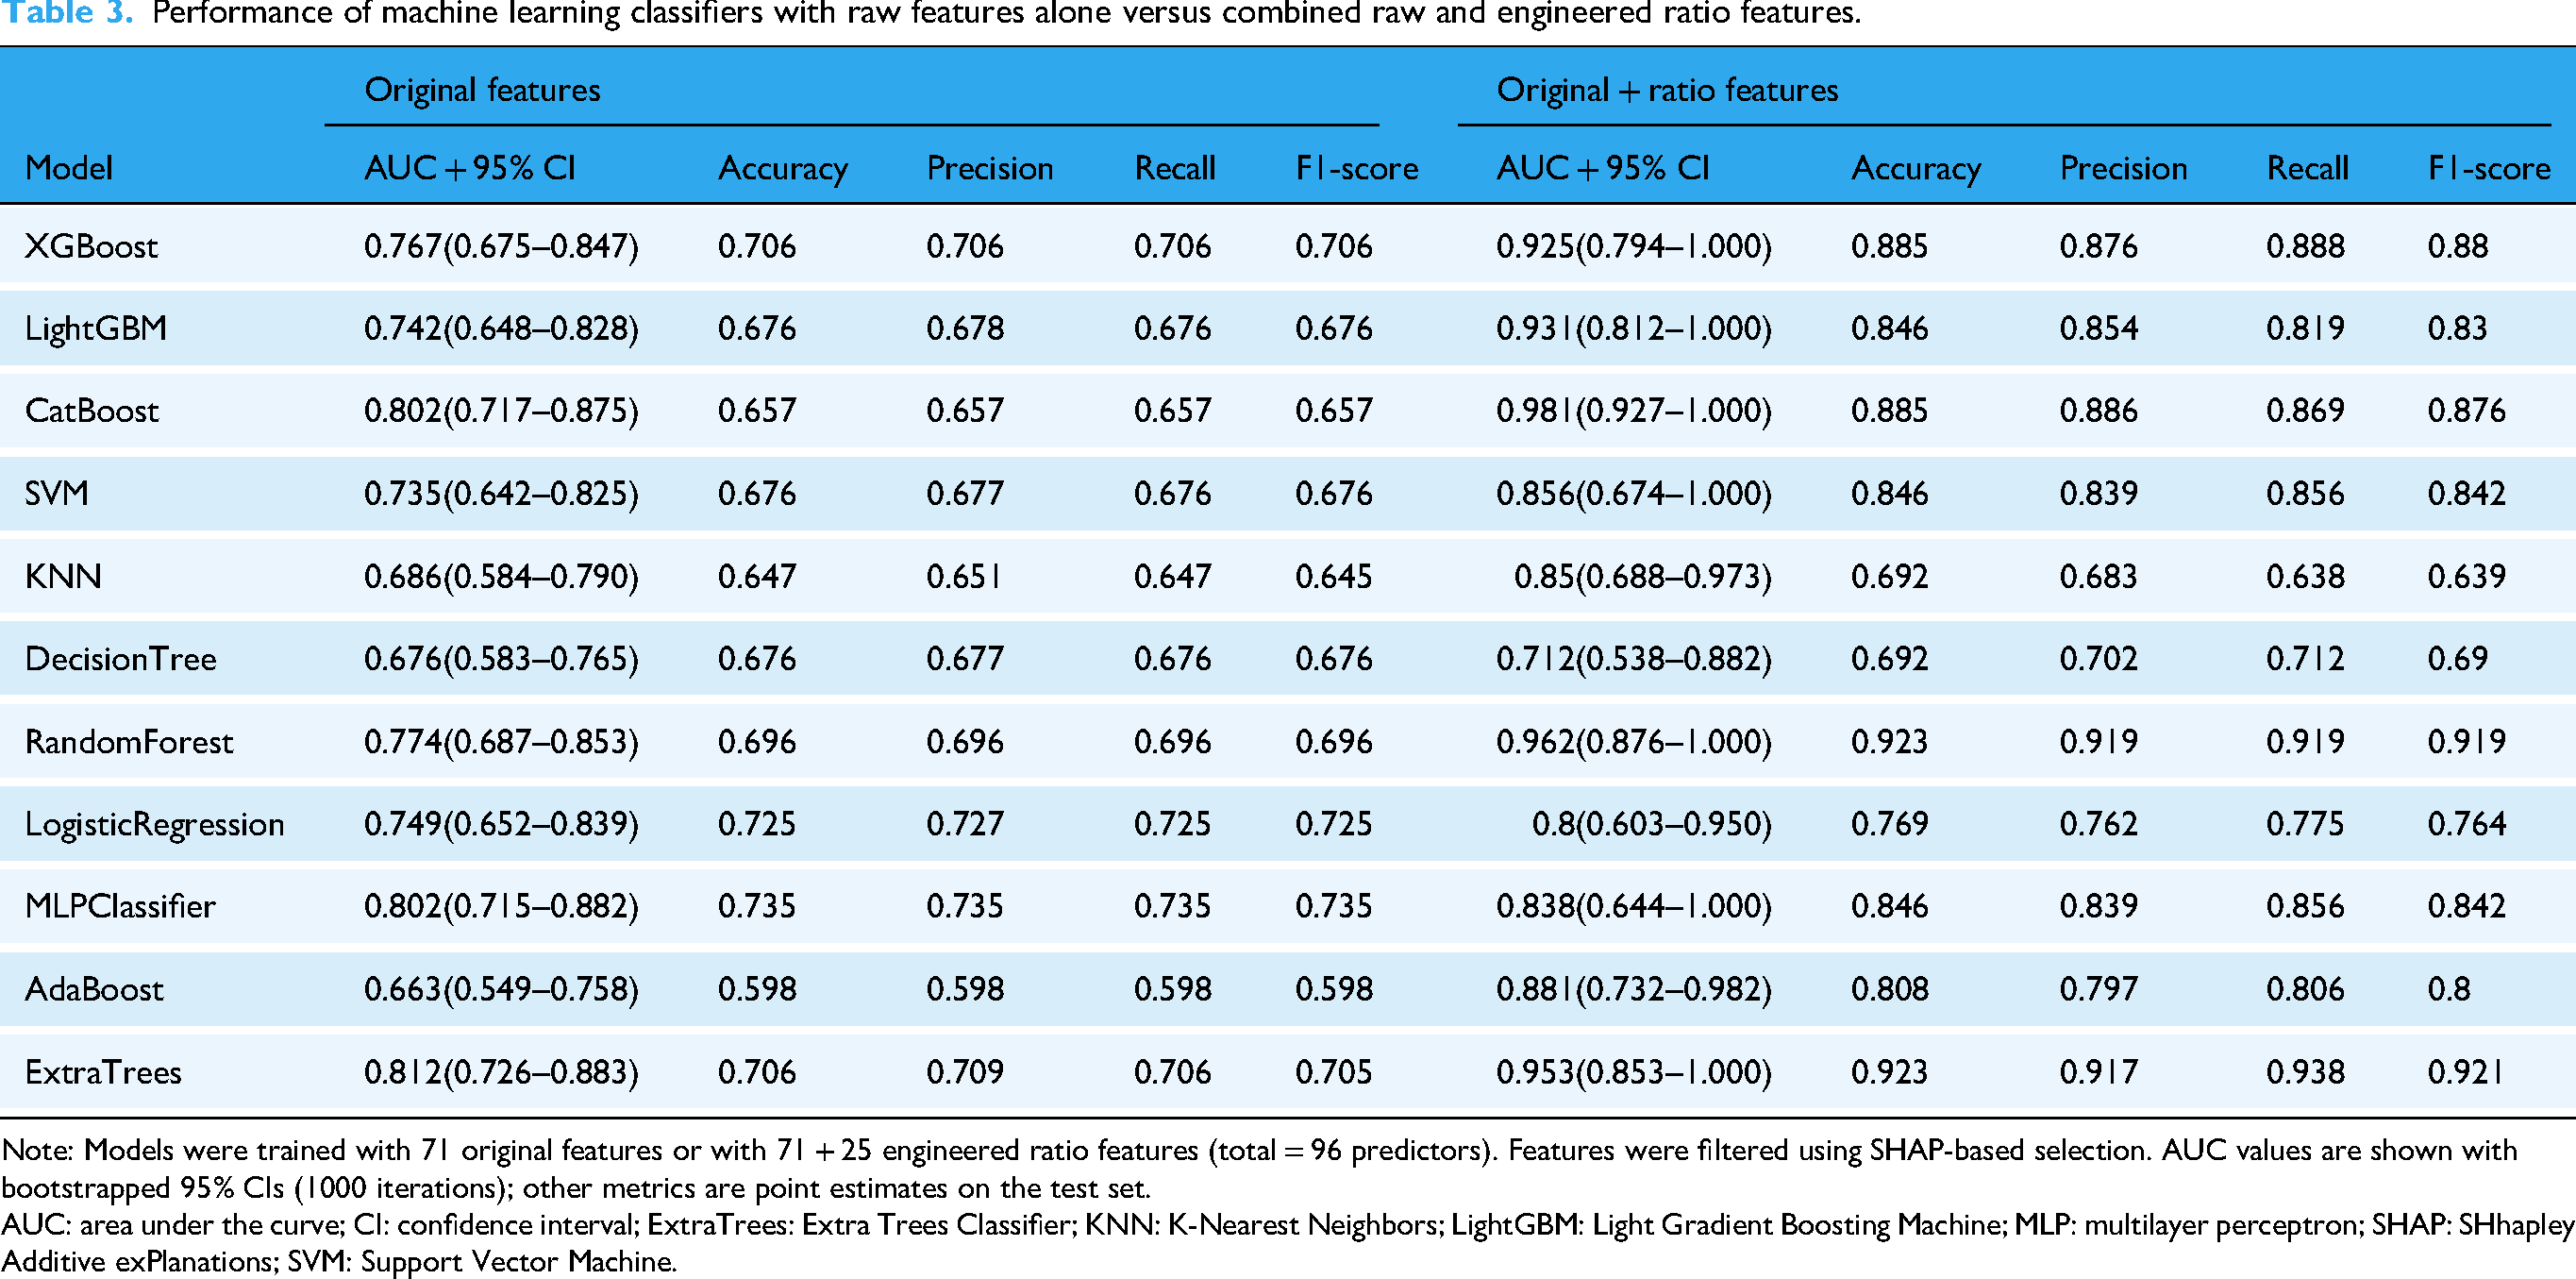
Note: Models were trained with 71 original features or with 71 + 25 engineered ratio features (total = 96 predictors). Features were filtered using SHAP-based selection. AUC values are shown with bootstrapped 95% CIs (1000 iterations); other metrics are point estimates on the test set.
AUC: area under the curve; CI: confidence interval; ExtraTrees: Extra Trees Classifier; KNN: K-Nearest Neighbors; LightGBM: Light Gradient Boosting Machine; MLP: multilayer perceptron; SHAP: SHhapley Additive exPlanations; SVM: Support Vector Machine.
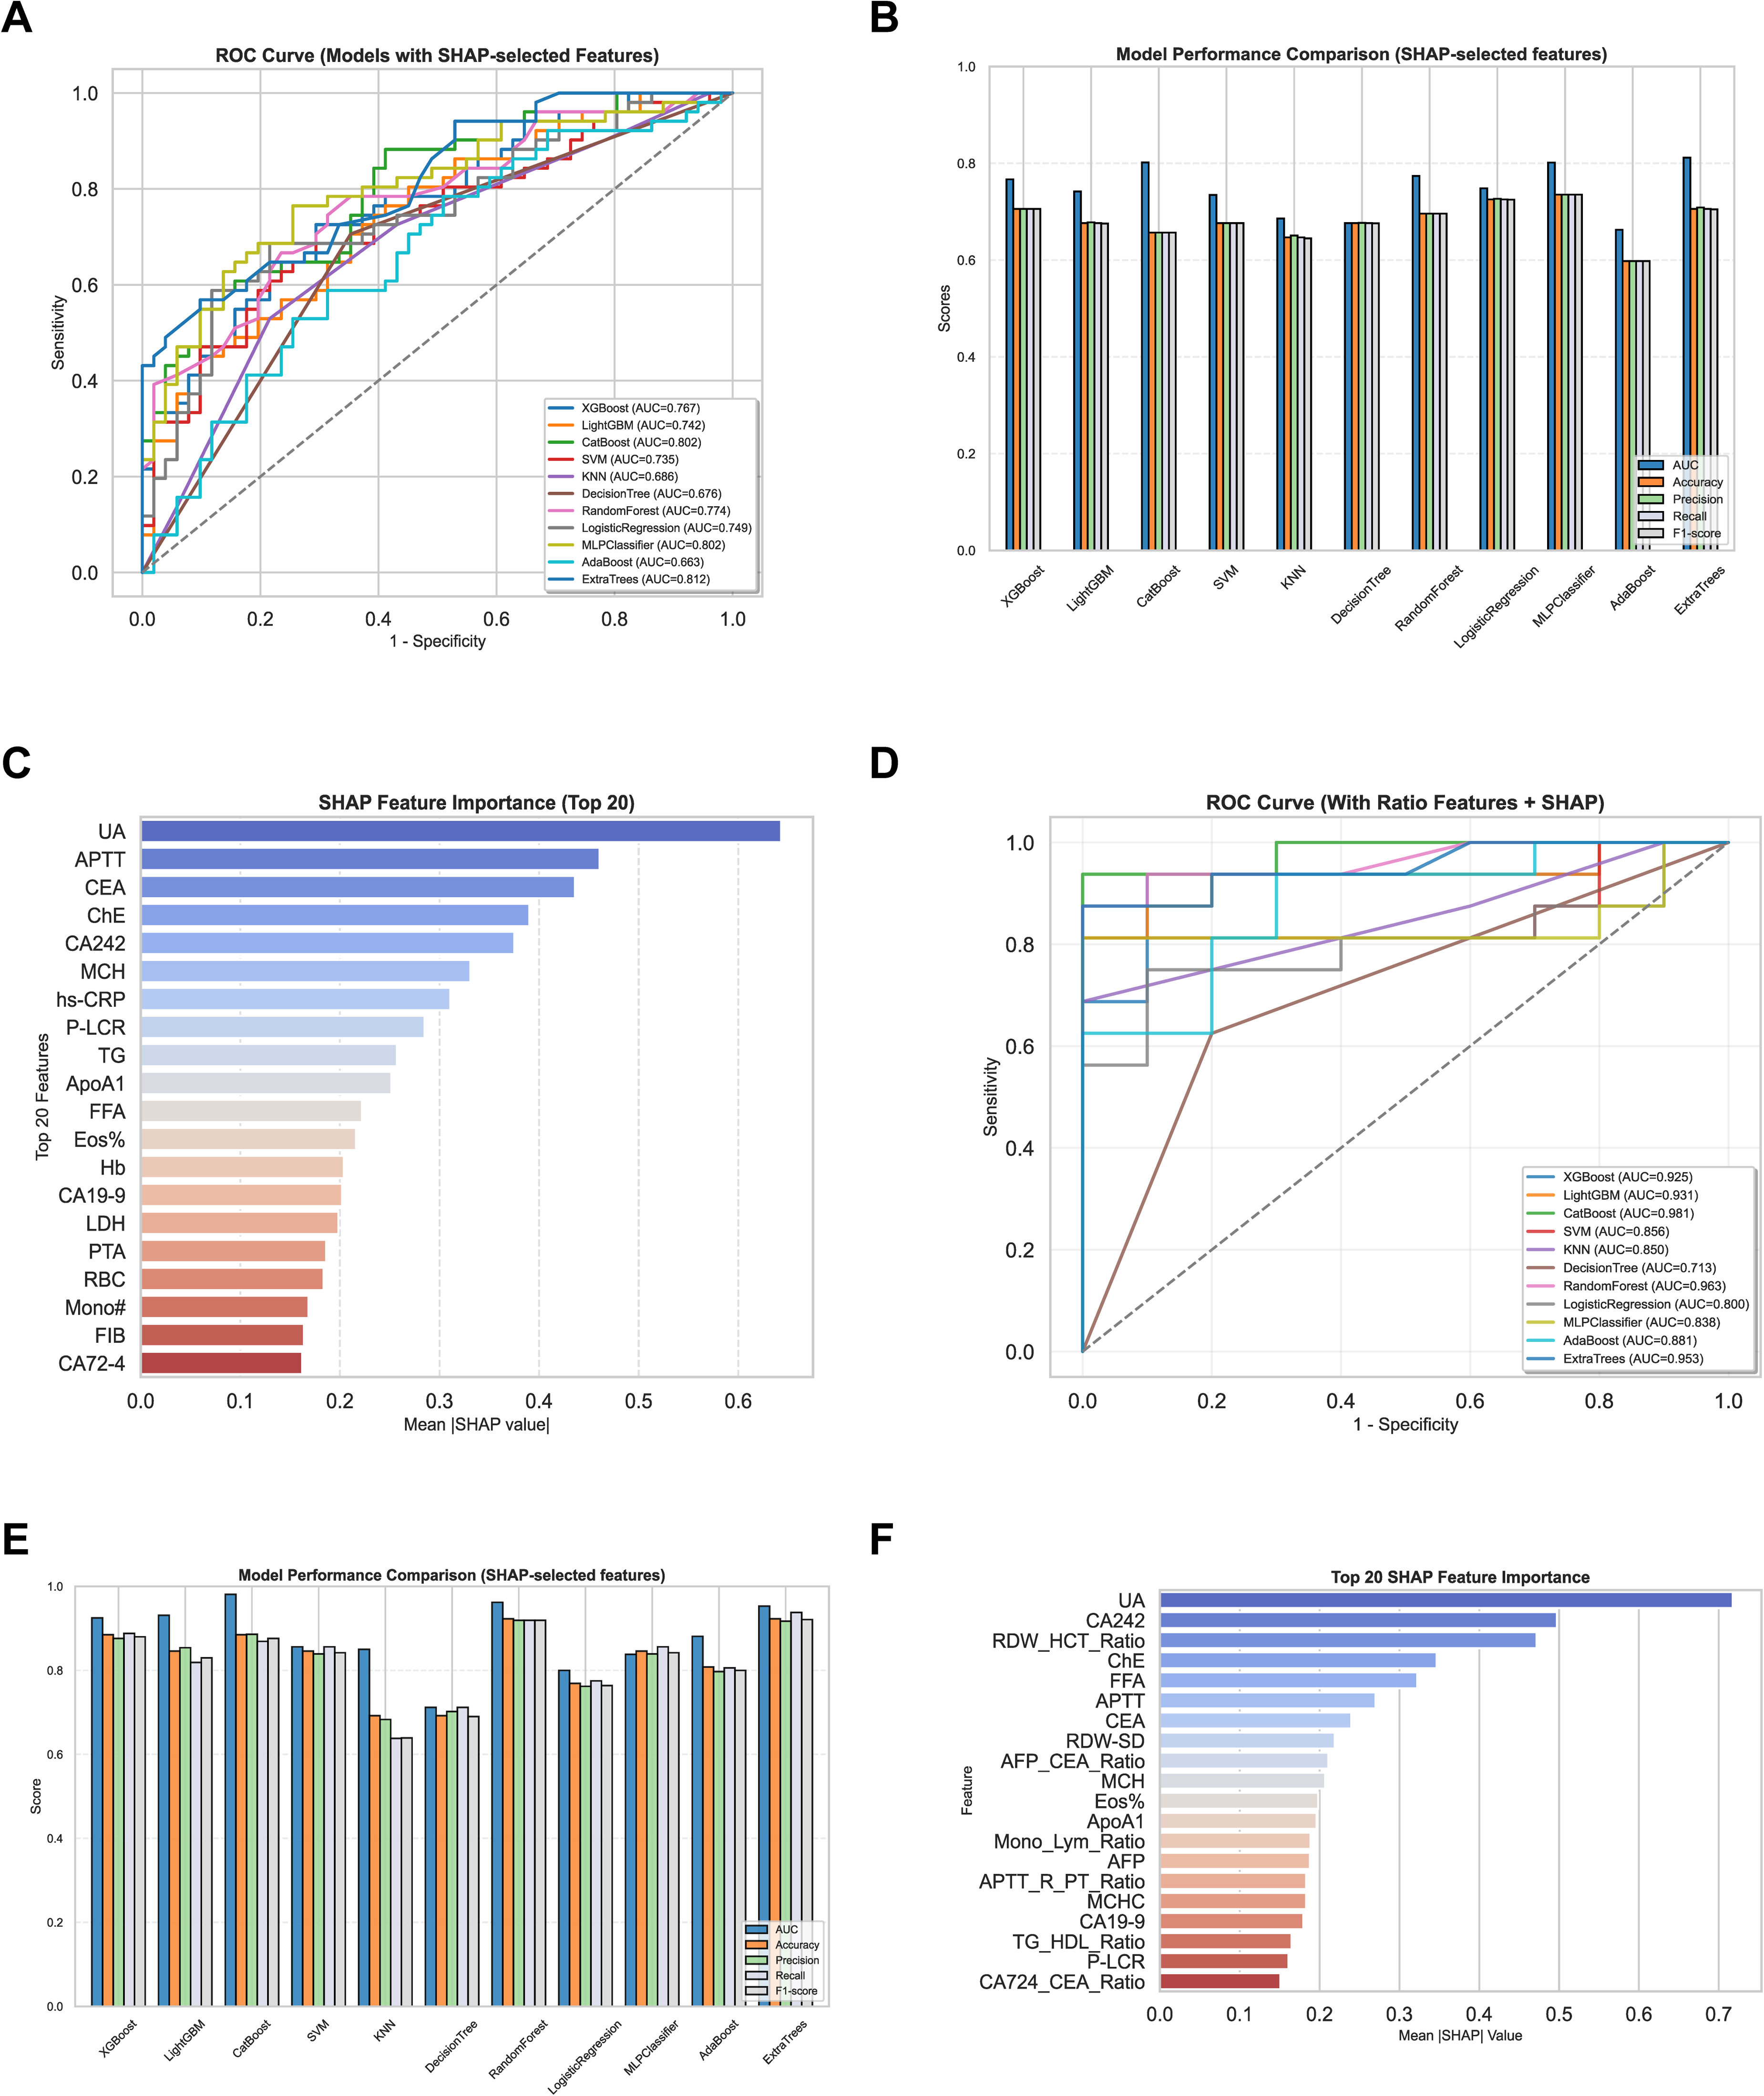
Comparative performance of machine learning models and SHAP-based feature selection. (A) ROC curves of eleven ML models using SHAP-selected features; (B) comparisons of AUC, accuracy, precision, recall, and F1-score in all models; (C) SHAP feature importance (top 20) derived from original indicators; (D) ROC curves after incorporating ratio features; (E) performance metrics of models with ratio features added; (F) SHAP importance (top 20) based on the final input set combining original and ratio features. AUC: area under the curve; ML: machine learning; ROC: receiver operating characteristic; SHAP: SHhapley Additive exPlanations.
SHAP-based feature optimization and model validation
To identify the optimal subset of predictive features, SHAP values from the full CatBoost model were ranked by mean absolute contribution. Cumulative SHAP analysis demonstrated that the top 30 features explained 61.3% of total model contribution, with a plateauing trend beyond this point, suggesting diminishing returns from lower-ranked variables (Figure 3(A)). To assess how feature inclusion impacted model performance, CatBoost models were retrained using incremental subsets of the top 30 features. As shown in Figure 3(B), model performance, measured by AUC, accuracy, precision, recall, and F1-score, improved rapidly with the first few features and peaked when using the top nine. Beyond this point, performance oscillated, and further inclusion of features did not yield consistent gains. The 9-feature model achieved the best tradeoff, with an AUC of 0.981, accuracy of 0.885, precision of 0.886, recall of 0.869, and F1-score of 0.876. Robustness and generalizability of this 9-feature model were rigorously assessed through two complementary strategies. First, repeated stratified 10-fold cross-validation (30 iterations; 300 total folds) showed consistently high performance, with a mean AUC of 0.9499 ± 0.0645 and narrow standard deviation across folds (Figure 3(C)). Second, nonparametric bootstrap resampling (n = 2000) yielded an approximately normal AUC distribution with a mean of 0.9499 and a 95% confidence interval of 0.9421 to 0.9571, further confirming model stability (Figure 3(D)). Collectively, these findings demonstrate that SHAP-informed feature optimization enabled the construction of a parsimonious yet high-performing CatBoost model. Its reproducible performance across cross-validation and bootstrap testing supports its reliability for preoperative stage prediction in GC.
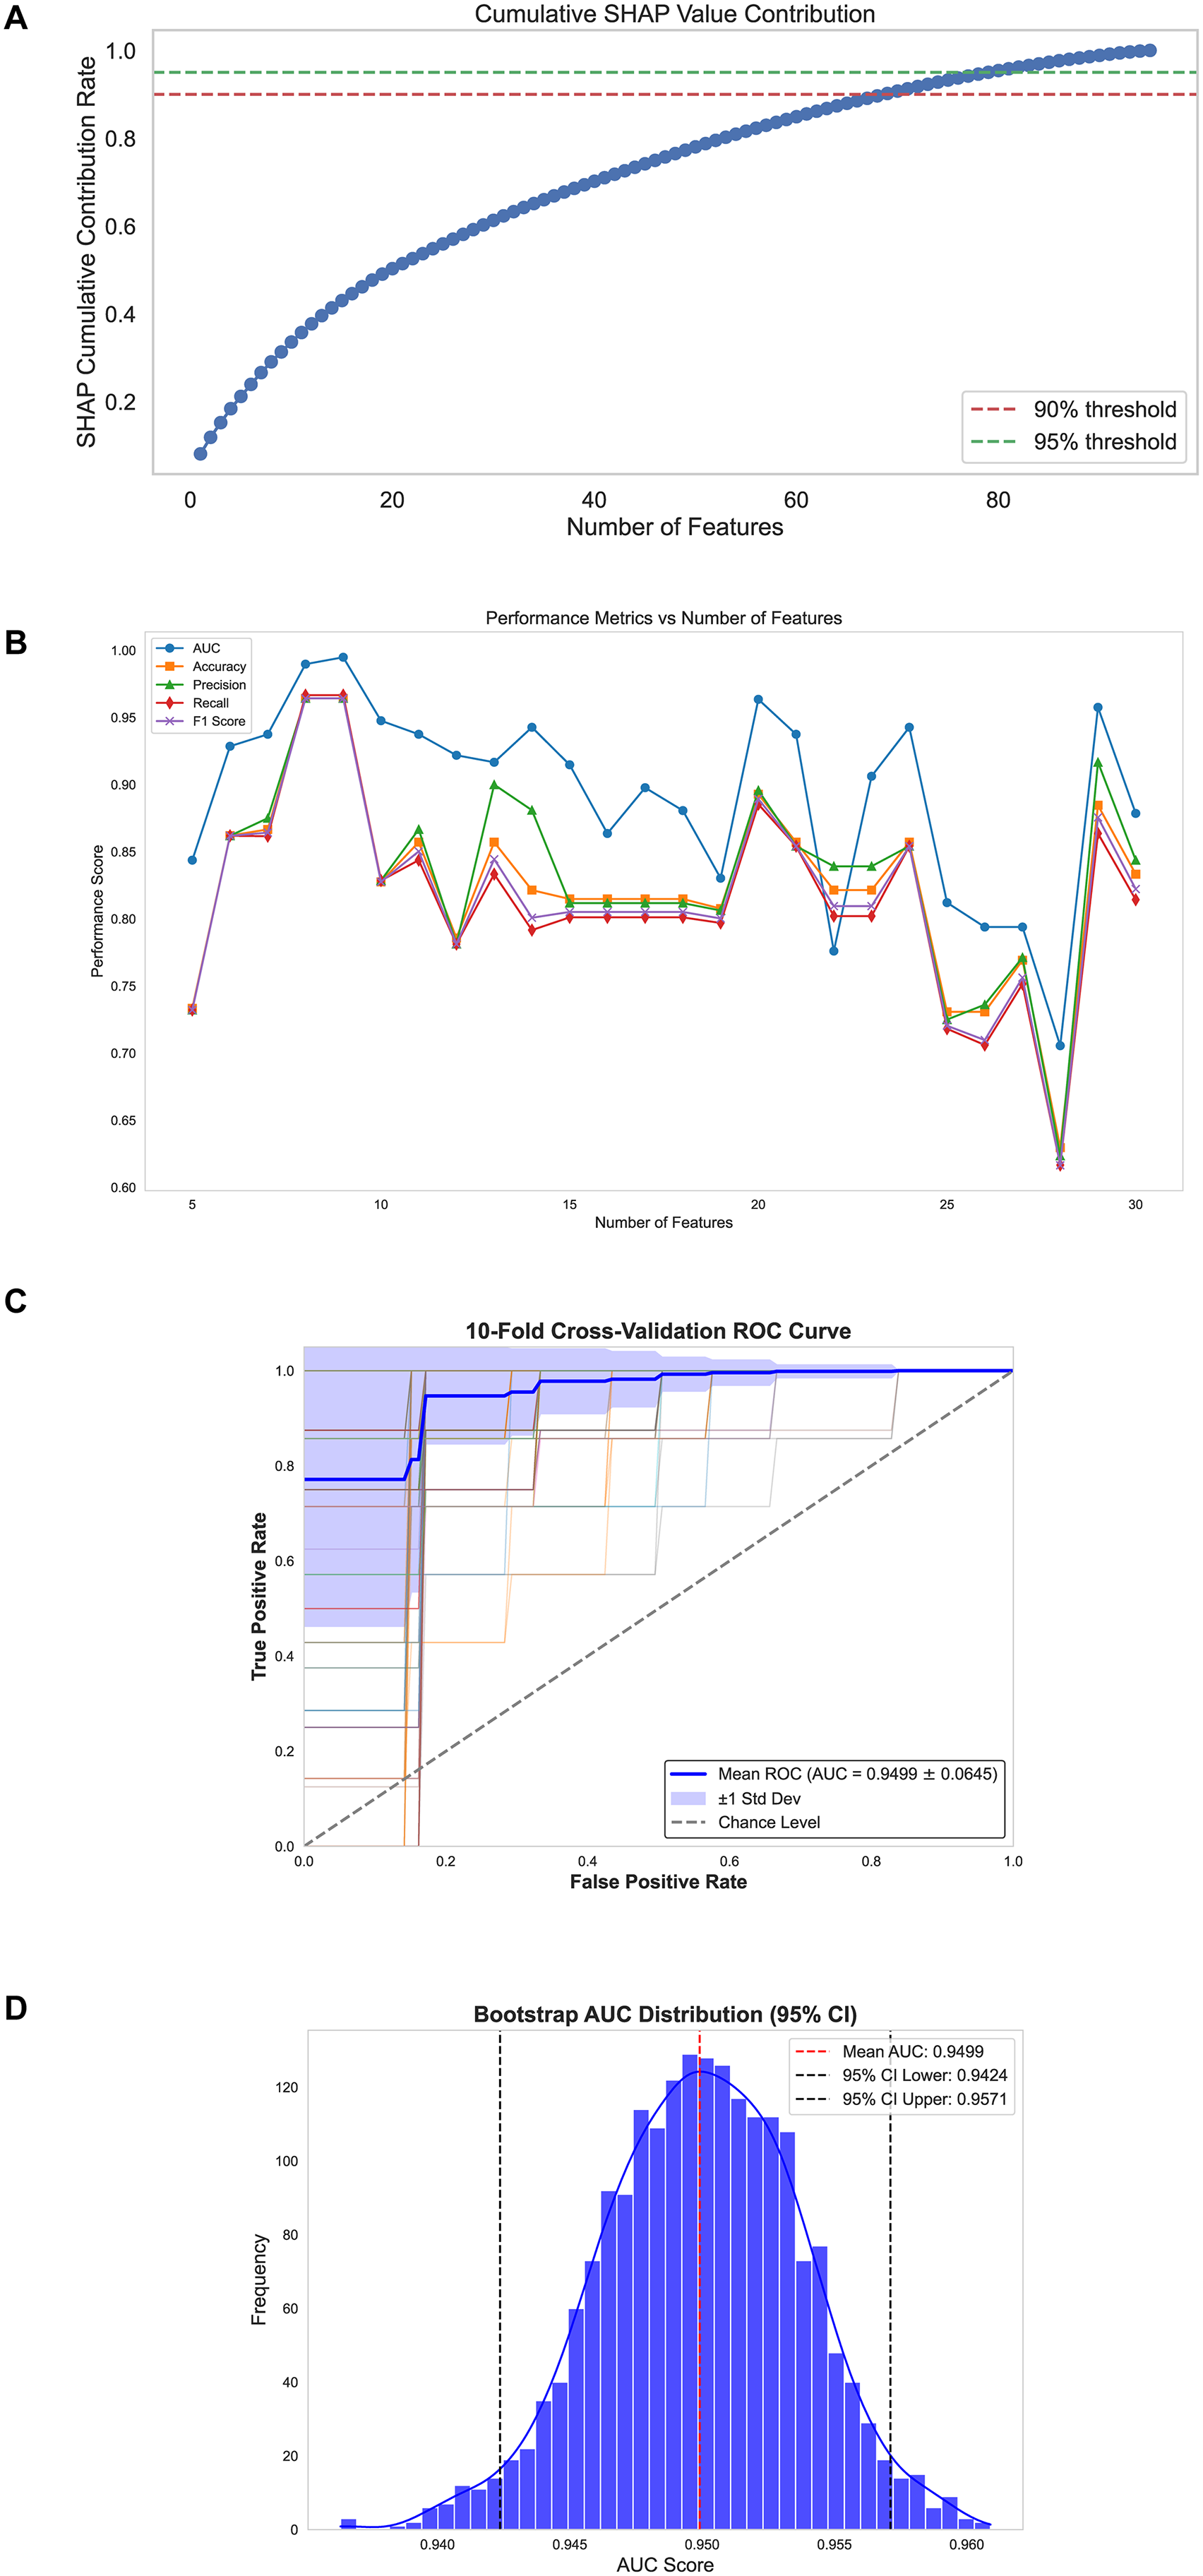
SHAP-based feature selection and validation performance of the final CatBoost model. (A) Cumulative SHAP value contribution curve demonstrating feature-wise additive importance. (B) Performance metrics of the CatBoost model (AUC, accuracy, precision, recall, and F1-score) plotted against increasing number of SHAP-ranked features. (C) ROC curve derived from repeated 10-fold cross-validation (30 repeats), showing robust predictive stability; error bars denote ±1 SD across repeats (mean AUC = 0.9499 ± 0.0645). (D) Bootstrap-derived distribution of AUC values from 2000 iterations, confirming high reproducibility; shaded area indicates the 95% CI (mean AUC = 0.9499; 95% CI: 0.9424–0.9571). . AUC: area under the curve; CI: confidence interval; ROC: receiver operating characteristic; SHAP: SHhapley Additive exPlanations.
Model interpretability based on SHAP analysis
To elucidate the decision-making process of the final CatBoost model and enhance clinical interpretability, SHAP analysis was performed. Ranking features by mean absolute SHAP value identified APTT, UA, RDW/HCT, and Eos% as the most influential predictors (Figure 4(A)). The SHAP summary plot (Figure 4(B)) demonstrated consistent contribution patterns: reduced APTT and UA increased the predicted probability of stages II–III disease, whereas elevated RDW/HCT and Eos% similarly favored advanced-stage classification. These trends align with established associations linking coagulation activation, metabolic depletion, erythropoietic dysregulation, and systemic inflammation to tumor progression. At the patient level, SHAP waterfall plots (Figure 4(C)) illustrated how individual predictions arise from the interplay of additive and counteracting feature effects. In one representative case predicted as stages II to III, an elevated AFP/CEA ratio, prolonged APTT, and increased ChE acted as primary risk enhancers, while higher UA and Eos% exerted protective effects. This combination reflects the interaction between tumor burden, hepatic function, coagulation status, and immune activity, the core domains within the host–tumor interface. Further exploration of SHAP decision plots and interaction maps revealed that top-ranked features did not operate in a purely additive manner. Instead, nonlinear, context-dependent interactions were evident. For instance, the predictive impact of APTT was amplified in patients with low UA, suggesting a compounded risk from concurrent coagulopathy and metabolic insufficiency. Likewise, the influence of RDW/HCT was greater when Eos% was elevated, implicating inflammation-driven hematologic remodeling. These relationships were corroborated by SHAP interaction heatmaps (Figure 4(D)), which showed strong self-interactions for APTT and UA, as well as moderate cross-interactions such as APTT–UA and RDW/HCT–Eos%. Validation across the broader cohort confirmed these patterns. As shown in Supplementary Figure S2, extreme values of APTT, RDW/HCT, and Eos% consistently corresponded to advanced-stage predictions, whereas elevated UA, ChE, and MCH were more frequently associated with early-stage classification. Collectively, the SHAP interpretability framework demonstrates that the model integrates coagulation imbalance, oxidative metabolism, erythropoiesis, and tumor marker burden into a cohesive and mechanistically grounded approach for stage stratification in gastric cancer.

SHAP-based interpretability analysis of the final CatBoost model. (A) Mean SHAP values for the top 9 features ranked by global importance; (B) SHAP summary plot illustrating feature effect directions and value distributions; (C) SHAP waterfall plot for a representative stages II–III patient showing individualized feature contributions to the final prediction (random sample); (D) SHAP interaction heatmap quantifying mean pairwise feature interaction strengths among the top 9 predictors. SHAP: SHhapley Additive exPlanations.
Discussion
In this retrospective cohort study, an interpretable ML model was developed and validated to differentiate early-stage (stage I) from advanced-stage (stages II–III) GC using routinely collected preoperative blood biomarkers. Among 11 algorithms evaluated, CatBoost demonstrated the most robust discriminative performance, with the AUC increasing from 0.802 (raw features) to 0.981 following the incorporation of biologically informed ratio features. SHAP analysis identified a parsimonious panel of nine top-ranking features, enabling accurate predictions while maintaining clinical interpretability. These results highlight the potential of integrating engineered biomarkers that reflect underlying physiological interactions to achieve high predictive accuracy without compromising feasibility.
While ML has been increasingly applied to cancer staging using accessible clinical data, most prior GC models remain constrained by either suboptimal accuracy or limited clinical scalability.38–43 Logistic regression and random forest approaches, though achieving moderate performance, are restricted by linear assumptions, reliance on isolated predictors, and minimal feature abstraction. More sophisticated frameworks integrating deep learning or multi-omics data have reported higher AUCs, sometimes exceeding 0.92, but these approaches often require transcriptomic profiling, specialized assays, or high-throughput platforms, limiting adoption in routine practice, especially in resource-limited settings. In contrast, the present model leverages only standard preoperative laboratory tests available across healthcare systems. The inclusion of biologically informed ratio features, such as RDW/HCT, AFP/CEA, and ChE/LDH, enables the capture of nonlinear interactions among hematological, inflammatory, and tumor-associated processes, aligning data-driven predictions with known pathophysiological mechanisms.
Several of the most influential features identified by SHAP analysis have biologically plausible links to GC progression. Reduced UA and prolonged APTT, alongside elevated RDW/HCT and eosinophil percentage, were consistently associated with advanced-stage disease. UA emerged as a top predictor across both raw and ratio-enhanced models. While hyperuricemia has been implicated in tumor initiation through pro-oxidant and mitogenic pathways, accumulating evidence, including our findings, suggests that low UA levels are linked to advanced GC, potentially reflecting cancer-associated cachexia, antioxidant depletion, or impaired purine metabolism.44–47 APTT, a measure of intrinsic coagulation activity, showed a positive association with advanced disease, consistent with prior studies linking its prolongation to tumor-associated coagulopathy, endothelial dysfunction, and hepatic impairment.48,49 The RDW/HCT ratio, by integrating red cell size variability with erythrocyte volume, provides a normalized index of erythropoietic efficiency and mitigates confounding from hydration status, transfusion, or oxidative stress.50,51 Its predictive value has been demonstrated across sepsis, hemorrhagic stroke, and various malignancies,52–54 and in GC, both RDW and HCT have ranked among top predictors in ML models. 55 Collectively, these biomarkers delineate a coherent axis of coagulative, metabolic, and hematopoietic imbalance, hallmarks of tumor progression. Furthermore, Liveraro et al. combined clinical variables with automated deep-learning segmentation of skeletal-muscle and adiposity on CT to predict postoperative prognosis in resectable GC, with muscle radiodensity features among the top contributors. 56 These orthogonal data domains (laboratory and body composition imaging) could be integrated in future work to further enhance risk stratification.
Accurate preoperative differentiation between stage I and stages II–III GC is pivotal for optimizing therapeutic strategies, avoiding overtreatment in early-stage patients while ensuring timely neoadjuvant therapy for advanced disease. The proposed framework integrates conventional blood biomarkers with biologically meaningful ratio features, substantially improving discrimination over traditional variables. Comprehensive benchmarking across 11 mainstream algorithms identified CatBoost as the most performant classifier. Its interpretability, enhanced through SHAP-based global and patient-level explanations, provides mechanistically plausible reasoning for each prediction, facilitating clinician trust, and adoption. The simplicity, accessibility, and transparency of this model support its potential use as a pre-endoscopic triage tool, an adjunct to imaging-based assessment, or a scalable solution for resource-limited settings.
Several limitations should be acknowledged. This was a retrospective, single-center study with a moderate sample size, which may limit generalizability and underscores the need for prospective validation. Patients receiving neoadjuvant therapy were excluded, reducing confounding but restricting applicability to such populations. As a national referral center, our cohort included more early-stage patients than typically seen in routine practice, which may introduce case-mix bias. The absence of long-term follow-up and external validation also limits assessment of prognostic value. Furthermore, MMR status was determined solely by postoperative IHC for MLH1, MSH2, MSH6, and PMS2, without germline or MLH1 promoter methylation testing; hence Lynch syndrome could not be distinguished from sporadic dMMR.57,58 Importantly, this limitation does not affect our main findings, as MMR status was reported only as a baseline characteristic and was not used as a feature in model construction. Finally, reliance on blood-based biomarkers alone may overlook complementary information from imaging modalities, which could further enhance staging models in future studies.
Conclusion
In summary, our interpretable CatBoost model demonstrated excellent predictive capability in differentiating stage I from stages II–III GC patients. SHAP analysis provided valuable explanations at both global and individual levels, enhancing clinical transparency, and personalized treatment planning. This study underscores the potential of ML models integrated with accessible blood biomarkers as noninvasive, cost-effective, and practical tools for early-stage GC screening and individualized patient management.
Supplemental Material
sj-docx-1-dhj-10.1177_20552076251388394 - Supplemental material for Biomarker-based and interpretable machine learning framework for predicting pathological stage in gastric cancer: A retrospective analysis
Supplemental material, sj-docx-1-dhj-10.1177_20552076251388394 for Biomarker-based and interpretable machine learning framework for predicting pathological stage in gastric cancer: A retrospective analysis by Guanmo Liu, Sen Yang, Jie Li, Zicheng Zheng, Chenggang Zhang, Yixuan He, Yihua Wang, Weiming Kang and Xin Ye in DIGITAL HEALTH
Supplemental Material
sj-docx-2-dhj-10.1177_20552076251388394 - Supplemental material for Biomarker-based and interpretable machine learning framework for predicting pathological stage in gastric cancer: A retrospective analysis
Supplemental material, sj-docx-2-dhj-10.1177_20552076251388394 for Biomarker-based and interpretable machine learning framework for predicting pathological stage in gastric cancer: A retrospective analysis by Guanmo Liu, Sen Yang, Jie Li, Zicheng Zheng, Chenggang Zhang, Yixuan He, Yihua Wang, Weiming Kang and Xin Ye in DIGITAL HEALTH
Supplemental Material
sj-docx-3-dhj-10.1177_20552076251388394 - Supplemental material for Biomarker-based and interpretable machine learning framework for predicting pathological stage in gastric cancer: A retrospective analysis
Supplemental material, sj-docx-3-dhj-10.1177_20552076251388394 for Biomarker-based and interpretable machine learning framework for predicting pathological stage in gastric cancer: A retrospective analysis by Guanmo Liu, Sen Yang, Jie Li, Zicheng Zheng, Chenggang Zhang, Yixuan He, Yihua Wang, Weiming Kang and Xin Ye in DIGITAL HEALTH
Footnotes
Abbreviations
Ethical approval
This study was conducted in accordance with the Declaration of Helsinki and approved by the Ethics Committee of PUMCH (approval no. I-23PJ2155).
Contributorship
GL and SY conceptualized the idea for this study. JL, ZZ, and CZ performed the data analysis. YH and YW drafted and critically revised the work. WK and XY supervised and revised the manuscript.
Funding
The authors disclosed receipt of the following financial support for the research, authorship, and/or publication of this article: This study was funded by the CAMS Innovation Fund for Medical Sciences (2023-I2M-C&T-B-016), Beijing Natural Science Foundation (7232117) and Fundamental Research Funds for the Central Universities, Peking Union Medical College (3332025013 and 3332025120).
Declaration of conflicting interests
The authors declared no potential conflicts of interest with respect to the research, authorship, and/or publication of this article.
Availability of data and materials
Data supporting the findings of this study are available from the corresponding author upon reasonable request.
Informed consent
Written informed consent was obtained from all participants prior to inclusion.
Gurantor
Weiming Kang is the guarantor of this study and accepts full responsibility for its integrity and accuracy. He ensures that all aspects of the research have been conducted in accordance with ethical guidelines and journal requirements. He has overseen the research process, confirms that all authors meet the authorship criteria, and will address any inquiries regarding the study.
Peer review
None.
Supplemental material
Supplemental material for this article is available online.
References
Supplementary Material
Please find the following supplemental material available below.
For Open Access articles published under a Creative Commons License, all supplemental material carries the same license as the article it is associated with.
For non-Open Access articles published, all supplemental material carries a non-exclusive license, and permission requests for re-use of supplemental material or any part of supplemental material shall be sent directly to the copyright owner as specified in the copyright notice associated with the article.