
Abstract
Objective
Synchronous metastatic nasopharyngeal carcinoma (smNPC) demonstrates marked prognostic heterogeneity, which cannot be captured by conventional Cox proportional hazards (CoxPH) models owing to their limitations in managing complex, nonlinear relationships. We employed various machine learning (ML) techniques to enhance predicting overall survival (OS) in patients with smNPC.
Methods
In this multicenter retrospective study, we conducted an analysis of 404 patients diagnosed with smNPC. We developed and assessed prognostic models utilizing a traditional Cox proportional hazards model alongside six ML algorithms. The predictive performances of these models were compared using the concordance index (C-index) and time-dependent area under the curve (tAUC). Risk stratification was conducted to guide personalized treatment strategies, and Kaplan–Meier survival curve analyses were performed to evaluate the efficacy of different treatment regimens across subgroups.
Results
The random survival forest (RSF) model yielded the highest C-index of 0.746 and an average tAUC of 0.801 for OS, identifying RSF as the optimal predictor. Shapley additive explanations analysis revealed that five features were most influential: number of metastatic lesions, involved organs, first-line regimen, presence of liver metastasis, and using immunotherapy. Risk stratification, based on Kaplan–Meier survival curve analyses, demonstrated that local treatment of metastatic lesions significantly extended OS in low- and high-risk patient cohorts. Primary site radiotherapy conferred a survival advantage exclusively to low-risk patients, whereas immunotherapy yielded improved outcomes in high-risk patients (all p < 0.05).
Conclusions
The RSF model excelled at predicting OS for patients with smNPC, providing reliable prognostic insights to guide risk-based treatment decisions in clinical practice.
Keywords
Introduction
Nasopharyngeal carcinoma (NPC) is common in China and Southeast Asia but rare in Western countries owing to genetic factors and environmental influences. NPC exhibits a greater tendency for distant metastasis compared to other head and neck cancers. 1 Studies indicate that 4–10% of patients are diagnosed with synchronous metastatic NPC (smNPC), a condition characterized by the presence of metastases at the time of initial diagnosis. The most common sites for these metastases include the bone, lungs, and liver. 2 The presence of distant metastases significantly compromises prognosis, with median survival ranging from 12 to 30 months, even with comprehensive multidisciplinary treatments.3,4
Despite therapeutic advances, the management of smNPC remains challenging because of its considerable heterogeneity, primarily attributed to variations in metastatic sites and the number of metastatic lesions. This variability significantly influences treatment responses and survival outcomes. 5 Consequently, the heterogeneity complicates prognosis and treatment selection, highlighting the need for improved predictive methods and individualized patient assessments in smNPC.
The tumor-node-metastasis staging system is the most common prognostic tool for NPC. However, the eighth edition (2017) uniformly classifies metastatic NPC as stage IVb, disregarding the diversity of metastatic presentations. 6 This lack of stratification limits personalized risk assessment and the development of tailored treatment recommendations for metastatic NPC.
Evaluating prognostic factors is essential for clinical decision making. Accurate prognosis assessment underpins risk stratification and the implementation of individualized therapy. Therefore, nonparametric and semiparametric regression models, particularly the Cox proportional hazards (CoxPH) model, are commonly used to identify clinical parameters associated with smNPC. Evidence strongly suggests that first-line immunochemotherapy, 7 metastatic lesion radiotherapy, 8 antiprogrammed death-1 therapy, 9 and primary-site radiotherapy 10 are linked to overall survival (OS). The Cox regression model assumes proportional hazards, indicating that the hazard ratio between two individuals remains constant over time. However, this assumption may not always hold, limiting the applicability of the model, particularly for nonlinear relationships, complex interactions, and time-dependent covariates. 11 These limitations reduce the predictive accuracy of the model, making it less suitable in certain cases.
Rapid advancements in machine learning (ML) have garnered significant research interest because of its potential for predicting tumor prognosis. Various ML models, including least absolute shrinkage and selection operator (LASSO), random survival forest (RSF), gradient boosting with component-wise linear models (GBM), survival support vector machine (SSVM), survival tree (sTree), and extreme gradient boosting (XGBoost), strengthen the relationship between covariates, and survival time while relaxing the time independence assumption of Cox regression. Furthermore, ML-based models have demonstrated superior performance compared with that of conventional CoxPH model in handling nonlinear relationships, 12 making them the optimal tools for predicting tumor survival and progression.13,14 Despite these advantages, the inherent black-box nature of ML algorithms has undermined confidence among patients and clinicians, 15 hindering their clinical application.16,17
The Shapley additive explanations (SHAP) method has emerged as a valuable tool for addressing these concerns by leveraging Shapley values from game theory to elucidate individual predictions. This approach enhances the interpretability of ML algorithms, effectively mitigates the challenges of black-box models, and provides interpretable, visualized clinical predictions. Significant advancements have been made in applying these methods to survival analyses.18,19
In this study, we aimed to use ML models to predict the prognosis of patients with smNPC. In this multicenter retrospective study, we analyzed the data of 404 patients diagnosed with smNPC. Using clinical parameters, we constructed and compared various survival prediction models. To improve interpretability, we used the SHAP method to elucidate features within these models. This was followed by risk stratification aimed at optimizing clinical diagnosis and guiding treatment strategy selection.
Methods
Acquisition of patient information
In this multicenter retrospective study, we analyzed data from 404 patients with smNPC treated at three tertiary hospitals in Central South China's endemic region: Guangxi Medical University Cancer Hospital, Wuzhou Red Cross Hospital, and Xiangtan Central Hospital, between January 2010 and January 2022. Center selection was based on four considerations: (1) geographical representation across different areas within the high-incidence zone; (2) clinical expertise as specialized NPC treatment centers with large patient volumes; (3) data quality from comprehensive electronic medical record systems meeting rigorous inclusion criteria; and (4) existing research collaborations enabling efficient multicenter data harmonization.8,10,13,20 To ensure cross-site consistency, medical records, laboratory findings, and pathological data were retrospectively reviewed.
The inclusion criteria were (1) a confirmed NPC diagnosis via biopsy; (2) distant metastasis at initial diagnosis, confirmed through the biopsy of metastatic lesions or imaging studies such as computed tomography, chest radiography, ultrasound, magnetic resonance imaging of the abdomen, whole-body bone scan, or positron emission tomography/computed tomography; and (3) a Karnofsky Performance Status score of ≥70.
The exclusion criteria were (1) excessive missing clinical data (>20%); (2) follow up of <3 months; (3) other malignancies; (4) uncontrolled cardiac, pulmonary, renal, or liver diseases; (5) refusal of antitumor treatment; and (6) less than four cycles of chemotherapy.
Ethics
The study received approvals from the institutional review boards of Guangxi Medical University Cancer Hospital (KY2025068), Wuzhou Red Cross Hospital (S2021-145), and Xiangtan Central Hospital (KY202385). The procedures complied with the ethical standards of these boards and with the principles of the Declaration of Helsinki. Because this is a retrospective study, written informed consent was waived by the relevant IRBs.
Treatment and follow up
Regarding treatment strategies, we collected detailed information on five major therapeutic categories as follows: (1) first-line regimen primarily consisted of platinum-based combination chemotherapy, including GP (gemcitabine + cisplatin), TP/TPF (taxane + platinum ± 5-fluorouracil), and PF (cisplatin + 5-fluorouracil) regimens; (2) targeted therapy mainly involved anti-EGFR monoclonal antibodies (cetuximab or nimotuzumab); (3) immunotherapy included anti-PD-1 inhibitors (pembrolizumab, nivolumab, or camrelizumab); (4) primary site radiotherapy employed intensity-modulated radiation therapy with prescription doses ranging from 70 to 72 Gy; and (5) metastatic lesion treatment (MLT) encompassed stereotactic body radiotherapy, surgical resection, and ablation procedures. Comprehensive details regarding specific treatment protocols and their distributions have been provided in our previous studies.8,10,20
The primary endpoint was OS, measured from the date of smNPC diagnosis to the most recent recorded date of survival or death from any cause.
Variable collection
Various clinical parameters were obtained, including demographics such as age (in years), sex, height (cm), weight (kg), and body mass index (kg/m2). We collected cancer-specific data, including T classification, N classification, pathology type, number of metastatic lesions, and metastatic organs. We recorded metastases to the liver, lungs, bone, and other organs. The primary T and N classifications for all patients were restaged according to the eighth edition of the tumor-node-metastasis staging system.
Additionally, we gathered laboratory data, including white blood cell count (109/L), neutrophil count (109/L), monocyte count (109/L), lymphocyte count (109/L), hemoglobin (g/L), platelet count (109/L), albumin level (ALB, g/L), alkaline phosphatase level (U/L), and EBV-DNA (copies/mL). Furthermore, we systematically recorded the previously mentioned treatment strategies.
Rationale for ML selection
A conventional CoxPH model and six ML algorithms—LASSO, RSF, GBM, SSVM, sTree, and XGBoost—were developed for predicting OS in patients with smNPC. The following summarizes the key rationale for selecting each algorithm.
LASSO: Chosen for its feature-selection capability and its ability to handle high-dimensional data by shrinking less informative coefficients toward zero, yielding a parsimonious model and mitigating overfitting—an important consideration in clinical datasets with many potential predictors. GBM and XGBoost: Chosen for their high predictive accuracy achieved through boosting, which sequentially corrects errors from prior models. They effectively capture complex nonlinear relationships and interactions among variables, which are often present in survival outcomes. sTree: Provides an interpretable, nonparametric approach that partitions data based on features most influencing survival. Although a single tree can be unstable, it serves as a base learner for ensemble methods like RSF and offers intuitive insights into risk stratification. SSVM: Used for its ability to find an optimal margin that separates patients into different risk groups in a high-dimensional feature space. It is robust to outliers and is effective when the number of features is large, making it suitable for our prognostic task.
Together, these algorithms offer complementary strengths: LASSO for feature selection; RSF for robust, nonparametric modeling; GBM/XGBoost for nonlinear, high-performance modeling; sTree for interpretability; and SSVM for high-dimensional discrimination, enabling a comprehensive evaluation of prognostic signals.13–17
ML development and assessment
Prognostic ML models were constructed based on 29 clinical parameters. These parameters encompassed demographic details, cancer-specific information, laboratory test results, and treatment strategies. To mitigate the risk of overfitting during the model selection process, a rigorous approach was adopted. In particular, the training set was used for model training. In addition the validation set was employed exclusively for parameter optimization and model performance evaluation. This approach further guided the selection of the final optimal ML model. The hyperparameters of the model were determined through five-fold cross-validation (Supplemental material 1). By averaging the performance across different data subsets, we aimed to obtain a more robust and generalizable model. To provide a clear and comprehensive understanding of the entire process, a flowchart depicting patient enrollment and the ML workflow is presented in Figure 1.

Flowchart illustrating the patient enrollment process and the machine learning workflow.
To comprehensively evaluate model performance, we employed multiple metrics to assess different aspects of predictive accuracy. Model calibration was quantified using the integrated Brier score, with values <0.25 indicating good calibration and practical applicability. Discriminative ability was evaluated using the concordance index (C-index) — where values >0.7 represent robust predictive accuracy13,21—along with time-dependent receiver operating characteristic curves (tROCs) and corresponding area under the curves (tAUCs).22–24 The model achieving the highest C-index and optimal tAUC values was selected as the final optimal predictive model. Furthermore, to facilitate direct comparison between ML and conventional CoxPH models, we also computed a comprehensive set of performance metrics, including accuracy, sensitivity, specificity, positive predictive value (PPV), negative predictive value (NPV), F1 score, and Matthew's correlation coefficient (MCC), ensuring a multifaceted assessment of predictive performance.
Feature selection and model explanation
To enable the intuitive interpretation of black-box ML models and to validate their practical significance in identifying factors influencing outcome risk, we provided a comprehensive explanation of the established model. The global explanation includes time-dependent feature importance, partial dependence survival profiles (PDPs), and a summary of aggregated SurvSHAP(t) values. 25
Risk stratification
For the identified ML survival prediction model, a risk score was derived using the predicted probabilities as predictors, facilitating the categorization of patients into high- and low-risk groups. The cutoffs for the risk score were determined using the “surv_cutpoint” algorithm from the R “survminer” package. Subsequently, Kaplan–Meier analysis was conducted to compare survival probabilities between these groups. Further stratified analyses were performed based on various treatment modalities, including targeted therapy, immunotherapy, primary-site radiotherapy, local treatment of metastatic lesions, and treatment patterns.
Statistical analysis
Statistical analyses were conducted using the R software (version 4.3.0) with multiple packages, including “survex,” “survivalmodels,” “pseudo,” “mlr3proba,” “mlr3extralearners,” “mlr3,” and “survival.”
In comparing the training and validation sets, continuous variables with a normal distribution were analyzed using a t-test, whereas those without were assessed using Mann–Whitney U test. For categorical variables, a chi-square test was employed. Statistical significance was defined as p < 0.05.
Results
Basic characteristics of patients with smNPC
Based on the inclusion and exclusion criteria, 404 patients were enrolled in the derivation cohort, with follow-up completed in January 2022. For the entire derivation cohort, the median OS was 27 months, the overall OS rate was 40.3%, and the 1-, 3-, and 5-year OS rates were 85.19%, 34.81%, and 17.50%, respectively.
To develop and validate the prognostic models, the derivation cohort was further divided into a training set and a validation set at a 7:3 ratio, comprising 283 and 121 patients, respectively. Specific survival outcomes of the two subsets were as follows: the training set had a median OS of 29 months, an overall OS rate of 41.7%, and 1-, 3-, and 5-year OS rates of 86.9%, 36.6%, and 19.1%, respectively; the validation set had a median OS of 25 months, an overall OS rate of 37.2%, and 1-, 3-, and 5-year OS rates of 81.3%, 30.7%, and 13.1%, respectively.
A comparative analysis of the clinical parameters between the training and validation sets is provided in Table 1. No statistically significant differences were observed between the two subsets (p > 0.05), confirming the balanced distribution of baseline characteristics and supporting the reliability of subsequent model development and validation.
Comparison of clinical parameters between the training and validation sets.

ALB: albumin; ALP: alkaline phosphatase; BMI: body mass index; EBV: Epstein–Barr virus; GP: gemcitabine + cisplatin; HGB: hemoglobin; MLT: metastatic lesion treatment; MONO: monocyte count; NEUT: neutrophil count; PF: cisplatin + 5-fluorouracil; PLT: platelet count; TP/TPF: taxane + platinum ± 5-fluorouracil; WBC: white blood cell count.
Comparative analysis of ML survival prediction model and CoxPH model
The RSF model demonstrated superior prognostic performance for patients with smNPC, achieving the highest C-index of 0.746 among all models evaluated. In a hierarchical ranking of model discrimination, RSF was followed by LASSO (0.722), CoxPH (0.715), GBM (0.707), sTree (0.701), XGBoost (0.692), and SSVM (0.540).
tROC analysis across 1-, 3-, and 5-year horizons confirmed RSF's predictive dominance, with an average tAUC of 0.801 (Supplemental Figure 1). The remaining models ranked as follows: sTree 0.752, LASSO 0.737, CoxPH 0.722, GBM 0.711, XGBoost 0.701, and SSVM 0.526. Table 2 demonstrates the 1-, 3-, and 5-year tAUCs and the corresponding performance metrics, including time-dependent AUCs as well as accuracy, sensitivity, specificity, PPV, NPV, F1 score, and MCC.
Comparison of AUCs at 1-, 3-, and 5-year time points and corresponding diagnostic parameters.

AUC: area under curve; CoxPH: Cox proportional hazards; GBM: gradient boosting with component-wise linear models; MCC: Matthew's correlation coefficient; NPV: negative predictive value; PPV: positive predictive value; RSF: random survival forest; SSVM: survival support vector machine; sTree: survival tree; XGBoost: extreme gradient boosting.
To facilitate a direct comparison between the RSF model and the conventional CoxPH model, we presented the integrated Brier scores and tAUCs in Figure 2. The RSF model demonstrated superior calibration relative to the CoxPH model. In addition, in Figure 3, we compared the 1-, 3-, and 5-year tROC for the 2 models. The tAUC values for RSF were 0.780, 0.846, and 0.776 at 1, 3, and 5 years, respectively, all higher than those for CoxPH (0.767, 0.777, and 0.621).

Visual representation of integrated Brier score and time-dependent area under the curve comparing the RSF model with the conventional CoxPH model. CoxPH: Cox proportional hazards; RSF: random survival forest.

One-, 3-, and 5-year tROC for the RSF model and the conventional CoxPH model. CoxPH: Cox proportional hazards; RSF: random survival forest; time-dependent receiver operating characteristic curve.
Model global explanation
To comprehensively assess the performance of the optimal RSF model, we conducted local analyses. The global explanation encompasses the importance of time-dependent features, PDP, and a summary of the aggregated SurvSHAP values.
We examined the significance of the time-dependent features to understand how each variable affected the predictive ability of the model on a global scale. To evaluate and rank variable importance within the RSF model, we used a loss function based on the Brier score, recognizing that these variables have varying effects over time (Figure 4). Our results indicated that the importance of variables shifted over time, with a notable increase in the loss function associated with the primary factor influencing OS. When the survival time was <70 months, the number of metastatic lesions emerged as the most critical independent risk factor for OS.

Time-dependent feature importance illustrated through Brier score loss after permutation. The y-axis represents the variation in the loss function following the permutation of each covariate.
The PDP provides a global explanation for the RSF model (Figure 5). The PDP graphically illustrates the variation in OS over time for the entire study population when a single factor is altered, with all other factors held constant. Narrow and nearly overlapping bands indicate that predictive outcomes remained stable across varying levels of certain variables, including lung metastasis, bone metastasis, and targeted therapies. In contrast, the wide bands for other variables, such as the number of metastatic lesions, number of metastatic organs, first-line regimen, liver metastasis, and immunotherapy, suggest that even slight changes in their values cause significant prediction disparities.
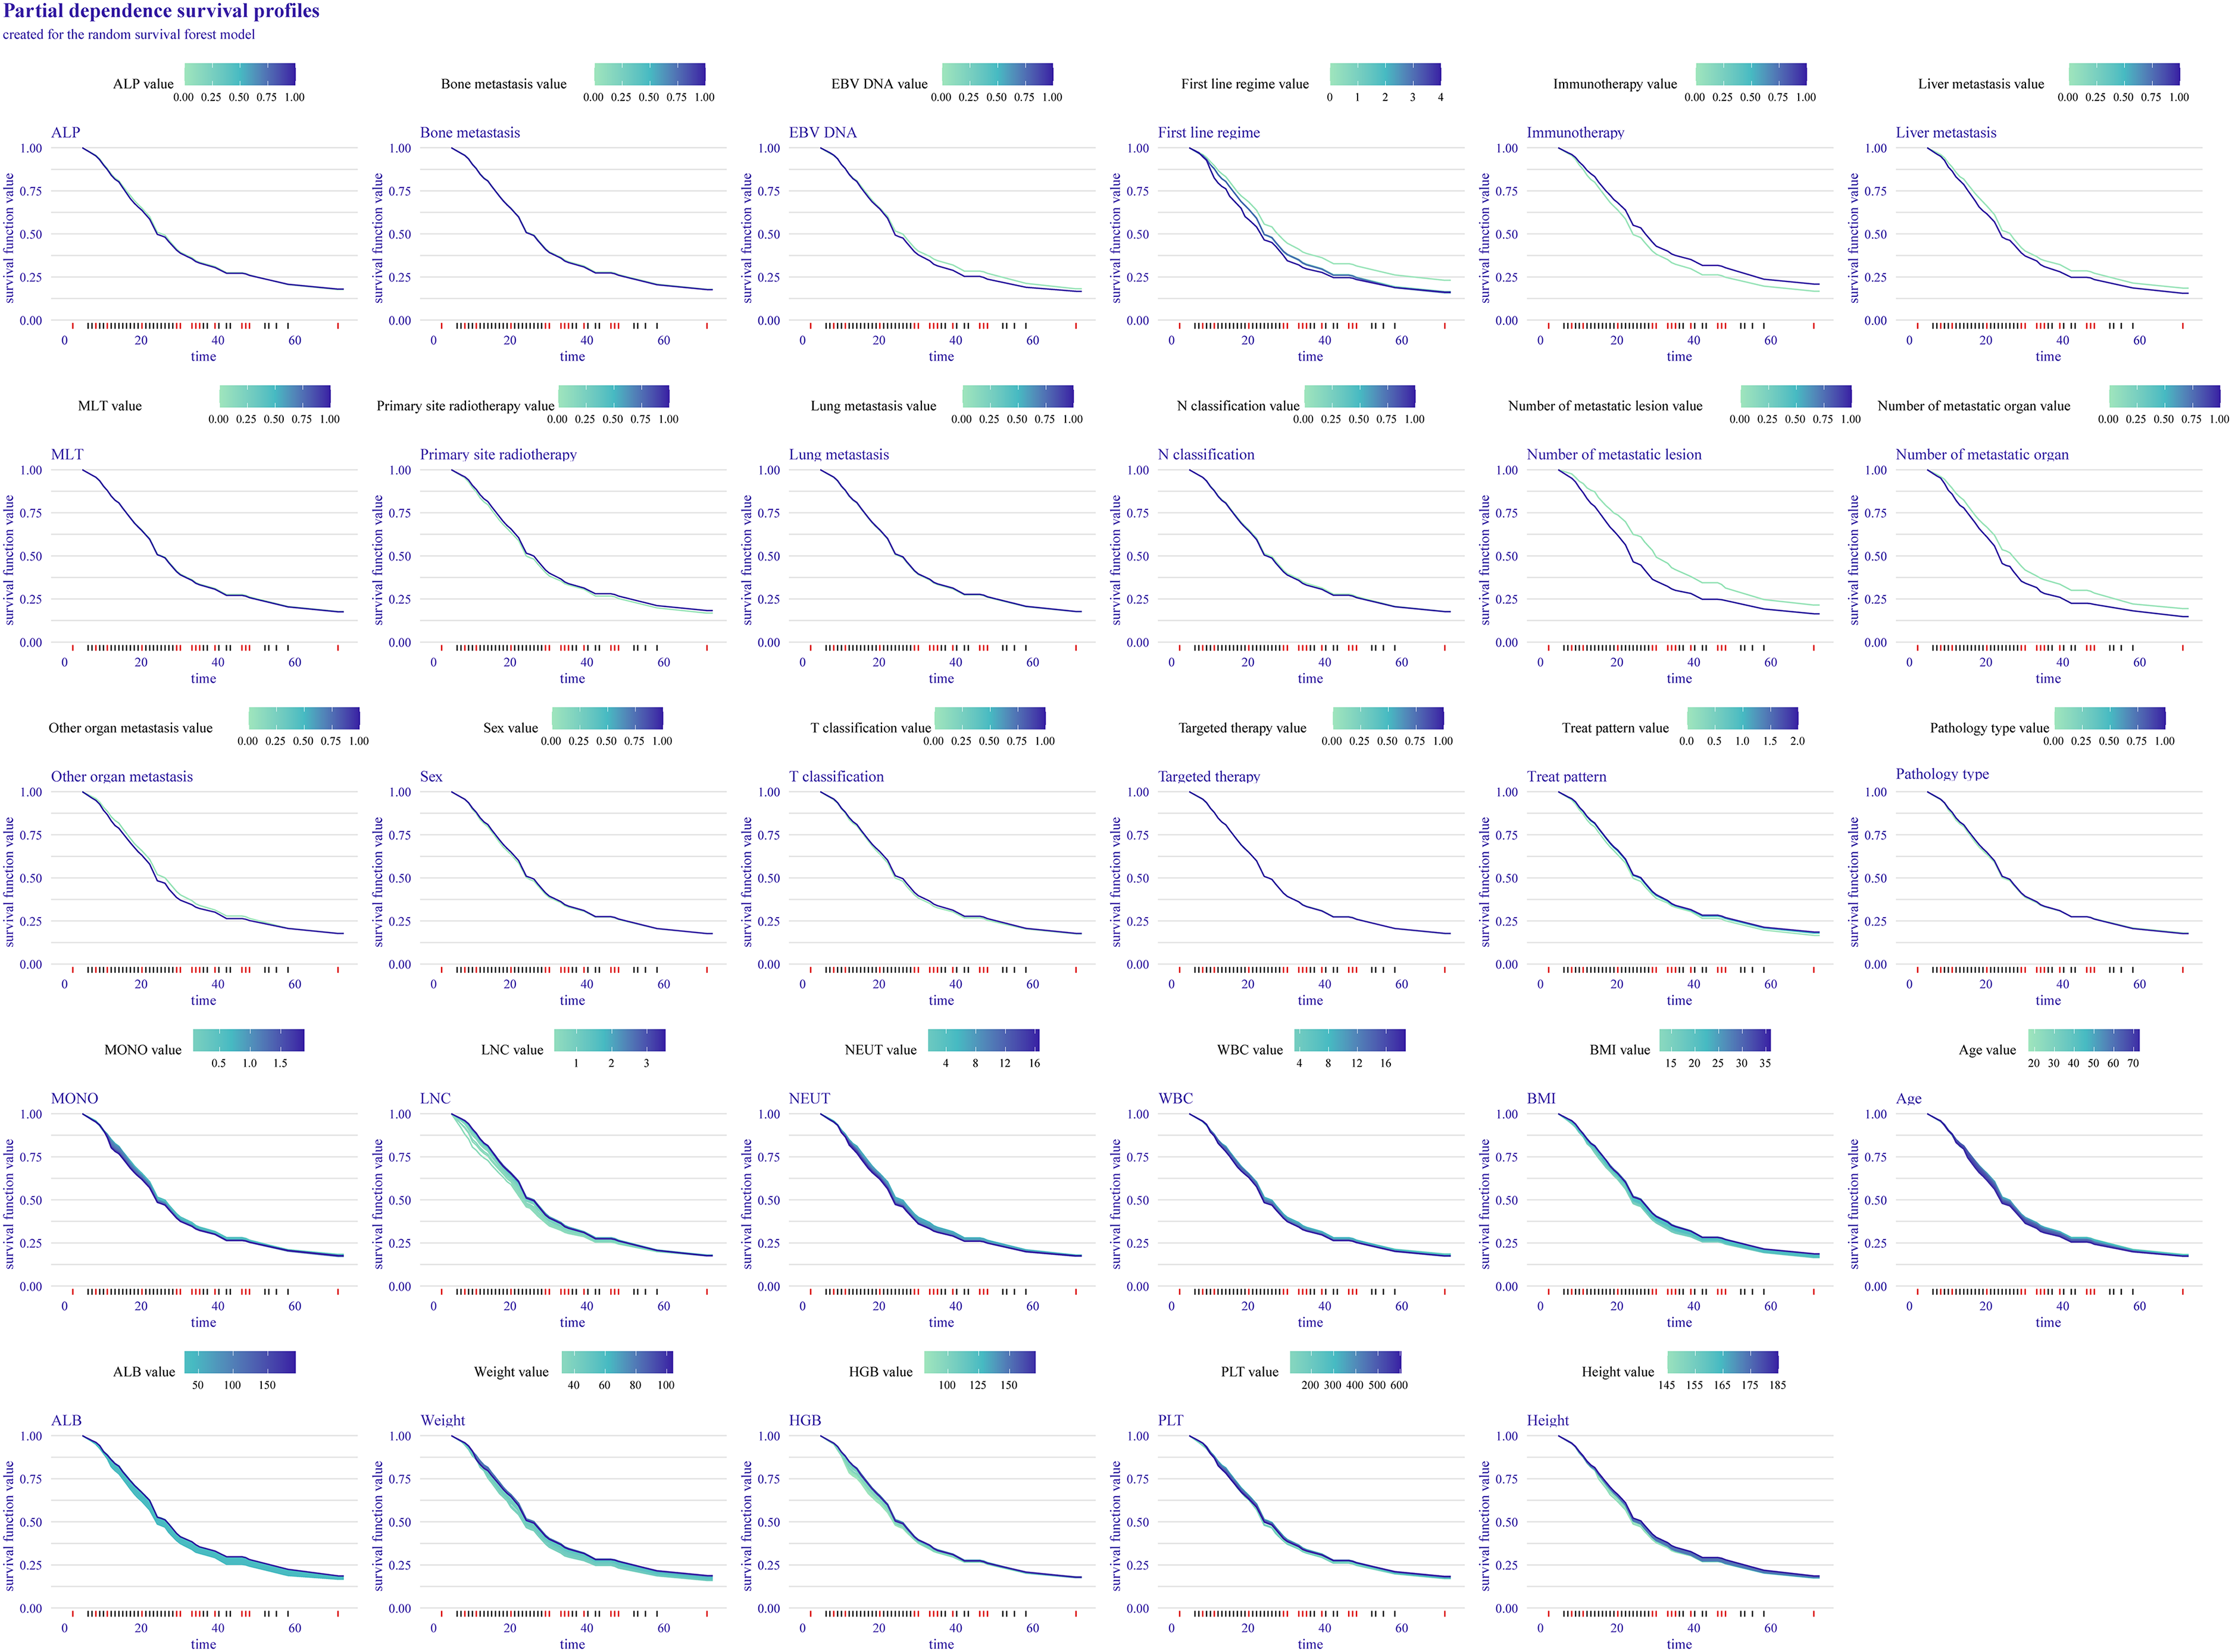
Partial dependence plots provide a global explanation for the ranger model. The survival function values for the covariates are depicted on the y-axis. Large differences between levels of a factor indicate a great effect of that factor on overall survival (OS). A low numerical value signifies a poor probability of survival.
Finally, we generated a SurvSHAP summary plot for the RSF model to explain its global effect, highlighting seven features based on their influence on OS: number of metastatic lesions, number of metastatic organs, liver metastasis, first-line regimen, immunotherapy, EBV DNA, and ALB. The left panel of Figure 6A illustrates the overall significance of the variables, and the right panel depicts their temporal variability in importance, measured using the average absolute SHAP value. In the bee swarm plot (Figure 6B), variables were ranked by significance, with higher SHAP values reflecting a greater effect on OS. Purple, blue, and green represent high, average, and low feature values, respectively.

SurvSHAP summary plot offers an overall interpretation of the global effect of variables. (A) The length of the bar chart represents the overall significance of each variable, whereas the curve graph displays cumulative importance. (B) Each point on the bee swarm plot represents a specific feature of an individual patient. The y-coordinate of each point corresponds to the feature it represents, and the x-coordinate indicates its effect on the model output. The color of the point reflects its value, ranging from high to low, as shown by the color bar below. The features on the y-axis are sorted according to their significance.
Risk stratification for guiding treatment
The cutoffs for the risk score were determined using the surv_cutpoint function from the R package survminer (Supplemental Figure 2). Kaplan–Meier survival analysis (Supplemental Figure 3) revealed that OS was significantly worse in the high-risk group than in the low-risk group (p < 0.001).
Furthermore, the subgroup analysis based on risk stratification (Figure 7) revealed that MLT significantly extended OS in both the low- and high-risk cohorts. Conversely, primary site radiotherapy provided a survival benefit exclusively to the low-risk cohort, whereas immunotherapy was advantageous solely to the high-risk cohort, with all comparisons yielding statistically significant results.

Risk stratification analysis for overall survival (OS) of different treatment decisions.
Discussion
ML models significantly benefit medicine, particularly aiding in prognostic prediction and clinical decision making. These models reveal complex patterns and associations when used to analyze extensive clinical data, including patient history, imaging, and laboratory results. This facilitates the accurate predictions of patient outcomes and helps healthcare professionals provide individualized medical management.25–28 In this study, several ML algorithms were applied to develop prognostic models, with the optimal model selected based on the C-index. The RSF model demonstrated the best performance, achieving a C-index of 0.746. Subsequently, we compared the RSF and traditional Cox models in terms of discrimination and calibration, with RSF demonstrating superiority.
Although traditional “black-box” models usually exhibit strong performance, they are limited by a lack of transparency, difficulty in interpretation, challenges in identifying and correcting biases, low trust, and limited debuggability.16,17 To address these limitations and interpret our RSF model, we identified the top predictors of OS in the smNPC population using global explanations. The SHAP results revealed that key predictors, such as number of metastatic lesions, number of metastatic organs, presence of liver metastasis, first-line regimen, use of immunotherapy, EBV DNA status, and ALB levels, were crucial for predicting smNPC outcomes and are readily available in clinical practices.
We found that the number of metastatic lesions, number of metastatic organs, and presence of liver metastases were significantly associated with the prognosis of smNPC, whereas the initial T and N stages were not. Additionally, previous studies have linked the prognosis of patients to the tumor burden of metastatic lesions.2,529–31 The number of metastatic lesions, the number of metastatic organs, and the presence of liver metastasis directly reflect the metastatic disease status, making them key prognostic predictors. Conversely, the T and N stages primarily describe the status of the primary tumor in NPC. For patients with distant metastases, the burden of the primary tumor does not directly correspond to the condition of metastatic lesions, limiting its value in predicting smNPC outcomes.
EBV DNA is crucial in screening, diagnosis, treatment monitoring, and prediction of recurrence and metastasis in NPC. Previous studies have consistently demonstrated its importance in evaluating the prognosis of patients with NPC.31–34 Our findings confirmed the significance of EBV DNA in predicting survival outcomes in patients with smNPC. Additionally, the nutritional status of patients before treatment is closely associated with NPC. 35 In our study, ALB, a key indicator of nutritional status, had a significant prognostic relevance.
Chemotherapy remains the primary treatment for metastatic NPC. 3 In our cohort, patients received various regimens, including GP, TP/TPF, and PF regimens, and single-agent chemotherapy. The choice of first-line chemotherapy regimen significantly influences patient outcomes. Current evidence supports the superiority of the GP regimen over the PF regimen for treating recurrent metastatic NPC. 36 However, the data for comparing the efficacies of the GP and TP/TPF regimens are lacking. Further research is required to determine the optimal first-line treatment regimens.
Advancements in medical treatment have expanded the management of metastatic NPC beyond systemic chemotherapy. The advent of immunotherapy has revolutionized treatment approaches.37,38 Growing evidence suggests that primary-site radiotherapy4,39 and local treatment of metastatic lesions 8 40–42 significantly improve patient prognosis. However, owing to the heterogeneity of smNPC, selecting the optimal treatment strategy remains challenging for clinicians. In this study, we used the RSF model to risk-stratify patients in the validation set and identify the groups that would benefit most from immunotherapy, primary-site radiotherapy, and the local treatment of metastatic lesions. These results provide valuable guidance for treatment decisions in smNPCs.
In the current study, subgroup analysis based on risk stratification revealed that immunotherapy did not improve survival in the low-risk cohort, whereas primary-site radiotherapy and MLT significantly prolonged survival. In the high-risk group, immunotherapy and MLT markedly improved prognosis, whereas primary-site radiotherapy did not provide a clear survival benefit. Therefore, we recommend that low-risk patients should receive aggressive primary-site radiotherapy, whereas high-risk patients should prioritize immunotherapy, with careful consideration of primary-site radiotherapy. In both cohorts, MLT should be actively implemented owing to its positive prognostic impact and its efficacy in managing local symptoms, which is consistent with previous studies.8,10,20
This study has some limitations that should be acknowledged. First, as a single-center retrospective analysis conducted across three hospitals in NPC-endemic regions of China, our findings may be influenced by selection biases and institution-specific treatment protocols. Second, although our multicenter design within endemic areas included a sufficient number of cases for model development, its generalizability to nonendemic populations—where the etiology and clinical course of NPC may differ substantially—may be limited. To address these limitations, future work should include large-scale, prospective multicenter validation studies across more geographically diverse regions, and it should validate the model in nonendemic cohorts to assess broader applicability and optimize its performance for global clinical implementation.
Conclusions
The RSF model demonstrated excellent performance in predicting the OS of patients with smNPC. This advanced analytical approach provides reliable prognostic insights at the patient level and shows potential for effectively guiding risk-stratified treatment decisions in clinical practice.
Supplemental Material
sj-docx-1-dhj-10.1177_20552076251404515 - Supplemental material for Machine learning approaches for survival prediction and risk-stratified treatment guidance in synchronous metastatic nasopharyngeal carcinoma: A multicenter study
Supplemental material, sj-docx-1-dhj-10.1177_20552076251404515 for Machine learning approaches for survival prediction and risk-stratified treatment guidance in synchronous metastatic nasopharyngeal carcinoma: A multicenter study by Dan Long, Ziqing Yang, Zhichao Zuo, Xiaoyi Zeng, Jie Ma and Yang Liu in DIGITAL HEALTH
Supplemental Material
sj-docx-2-dhj-10.1177_20552076251404515 - Supplemental material for Machine learning approaches for survival prediction and risk-stratified treatment guidance in synchronous metastatic nasopharyngeal carcinoma: A multicenter study
Supplemental material, sj-docx-2-dhj-10.1177_20552076251404515 for Machine learning approaches for survival prediction and risk-stratified treatment guidance in synchronous metastatic nasopharyngeal carcinoma: A multicenter study by Dan Long, Ziqing Yang, Zhichao Zuo, Xiaoyi Zeng, Jie Ma and Yang Liu in DIGITAL HEALTH
Footnotes
Abbreviations
Ethics approval
The study received approvals from the institutional review boards of Guangxi Medical University Cancer Hospital (KY2025068), Wuzhou Red Cross Hospital (S2021-145), and Xiangtan Central Hospital (KY202385). The procedures complied with the ethical standards of these boards and with the principles of the Declaration of Helsinki. Because this is a retrospective study, written informed consent was waived by the relevant IRBs.
Consent to participate
Not applicable.
Consent for publication
Not applicable.
Contributorship
DL, ZY, and ZZ were involved in writing – original draft; ZZ in methodology, data curation, investigation, software, and visualization; XZ and JM in data curation and investigation. YL in conceptualization, writing – review and editing, visualization, and project administration.
Funding
The authors disclosed receipt of the following financial support for the research, authorship, and/or publication of this article: This work was supported by the Scientific Research Startup Fund for the First Batch of Young Medical Reserve Talents in the Guangxi Zhuang Autonomous Region (grant no. Young Medical Reserve Talents 2025-5) and the National Natural Science Foundation of China (grant no. 82403308).
Declaration of conflicting interests
The authors declared no potential conflicts of interest with respect to the research, authorship, and/or publication of this article.
Data availability
The datasets used and/or analyzed during the current study are available from the corresponding author on reasonable request.
Guarantor
YL.
Supplemental material
Supplemental material for this article is available online.
References
Supplementary Material
Please find the following supplemental material available below.
For Open Access articles published under a Creative Commons License, all supplemental material carries the same license as the article it is associated with.
For non-Open Access articles published, all supplemental material carries a non-exclusive license, and permission requests for re-use of supplemental material or any part of supplemental material shall be sent directly to the copyright owner as specified in the copyright notice associated with the article.