
Abstract
Objective
Sleep apnea is a common sleep disorder affecting a significant portion of the population, but many apnea patients remain undiagnosed because existing clinical tests are invasive and expensive. This study aimed to develop a method for easy sleep apnea screening.
Methods
Three supervised machine learning algorithms, including logistic regression, support vector machine, and light gradient boosting machine, were applied to develop apnea screening models at two apnea–hypopnea index cutoff thresholds:
Results
For cutoff
Conclusions
Our models achieved better performance than existing methods and have the potential to be integrated with home-use pulse oximeters.
Keywords
Introduction
Sleep apnea is a common sleep disorder characterized by frequent episodes of partial or full blockage of the respiratory tract during sleep. Sleep apnea is clinically diagnosed using the apnea–hypopnea index (AHI), which is defined as the number of apnea or hypopnea events per hour during a night’s sleep. A person is considered as having sleep apnea if the AHI is larger than or equal to 5. Continuous positive airway pressure (CPAP) treatment is often recommended for people with an AHI larger than 30 in Japan. 1 The symptoms of sleep apnea include loud snoring and excessive daytime sleepiness. In the long-term, sleep apnea is associated with increased risk of diabetes, hypertension, depression, and memory loss.2,3 It is, therefore, important for sleep apnea patients to seek timely diagnosis and treatment.
Clinical diagnosis of sleep apnea requires a patient to undergo an overnight polysomnography (PSG) test in a hospital or sleep clinic. A PSG test monitors many physiological signals during sleep to gain a holistic view of a patient’s physical states during sleep. The set of signals is then manually scored by a registered sleep technician. PSG test is expensive and time-consuming, which limits its accessibility and affordability as a method for sleep apnea screening. To address the problem, many studies have attempted to develop more affordable sleep apnea screening systems. These systems aim to achieve reasonable accuracy in detecting sleep apnea episodes using only a subset of the signals measured in a PSG test such as electroencephalogram (EEG) 4 and electrocardiogram (ECG). 5 In a related vein, some studies developed sleep apnea screening methods that rely on the information stored in electronic health records (EHRs) such as demographic characteristics, laboratory blood test results, comorbidities, medication, questionnaire scores, etc.6–10,12,11,13 Although EHR-based methods are promising, they are not applicable to at-home sleep apnea screens because not all the required data are readily available to individuals.
As consumer sleep tracking technologies burgeon, research interest has started to shift towards developing new sleep analysis models that are compatible with the sensing modalities available in those devices.14–16 Most of the consumer sleep trackers nowadays have embedded photoplethysmography sensors that continuously measure users’ peripheral oxygen saturation (SpO2), making it an ideal sensing modality for sleep apnea detection in free-living environments. Many studies in this line of research formulated sleep apnea detection into an epoch-wise classification problem.17–21 A whole night’s SpO2 recording was segmented into small intervals called epochs. The size of an epoch was often set to 1 minute. The constructed classification model was supposed to map each epoch to either a positive or negative apnea event. This scheme for apnea event classification suffers two major drawbacks. First, the signal segmentation process introduces dependency among training samples, violating the assumption of independent and identical distribution that is central to many machine learning techniques. Despite the seemingly large number of segments, the degree of freedom is limited by the cohort size, which is often too small in prior studies. 26 For example, the widely used Apnea-ECG dataset only contains eight recordings of SpO2 signals, while the St. Vincent’s University Hospital/University College Dublin Sleep Apnea Database contains SpO2 recordings of only 25 subjects. The models thus may suffer from over-fitting and may not generalize well to new data. Second, the performance evaluation of the existing model often centers on the detection of individual apnea events rather than an overall evaluation of whether a user is likely to have sleep apnea. While one may argue that the accurate detection of respiratory events allows for the calculation of AHI (and thus sleep apnea screening), the evaluation of the latter is mostly missing in prior studies and thus leaving it unknown in terms of the models’ performance in apnea screening. A few recent studies developed SpO2-based apnea screening models and validated them on larger datasets. Trained with 18 features and validated on the São Paulo Epidemiologic Sleep Study dataset (N = 887), the OxyDOSA model achieved an area under the receiver operating characteristic curve (AUC) of 0.94 and an accuracy of 86%. 22 In another study, a least-squares boosting (LSBoost) model was trained on 32 features and validated on the Sleep Heart Health Study (SHHS) dataset as well as the Rio Hortega University Hospital (RHUH) dataset. 23 The LSBoost model achieved an accuracy between 87.23% and 96.58% for a binary classification. In a recent study, a convolutional neural network-based deep learning model was developed by Sharma et al. 24 to achieve segment-wise classification of sleep apnea events. This model was validated on the SHHS dataset and achieved an AUC of 90.4 and an accuracy 82.2%. Another deep learning model OxiNet was recently developed by Levy et al. 25 to predict subject-wise AHI values. This model was validated on six large datasets (N = 369–5778) and yielded an average F1-score between 0.75 and 0.84.
In this article, we developed a new method for sleep apnea screening based on analyzing overnight SpO2 recordings. Our method combines multiscale entropy (MSE) analysis and machine learning. The problem of interest was formulated into a binary classification problem. We were interested in distinguishing the positive class and the negative class at two AHI cutoffs:
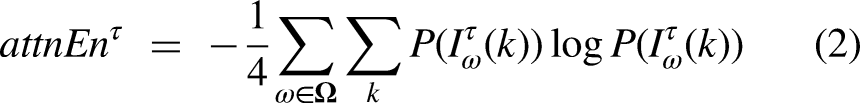
The key innovation of our method is the multiscale attention entropy (MSAE)—a novel way to construct features that characterize the complexity of the SpO2 signals for various temporal scales. MSE analysis generates insights into the temporal fluctuation of the information encoded in the SpO2 signals. We used a new entropy measure—attention entropy—as the base entropy in the MSE analysis. Attention entropy has advantages over other conventional entropy measures such as sample entropy and approximate entropy because it is robust to the length of the signal and is parameter-free. The attention entropy of the SpO2 signals computed for various scale factors formed the raw feature set, which was scaled and then processed using the independent component analysis (ICA) to generate independent features for model construction. We considered both short, medium, and long-term time scales of up to 30 minutes in the MSAE analysis.
The contribution of this article is as follows. First, we proposed a new method that combines the MSAE and ICA to derive independent features that characterize the complexity of the overnight SpO2 signals at short-, medium-, and long-term temporal scales. Second, we examined the discriminating power of the attention entropy for a wide range of time scale from 1 second to 30 minutes. To the best of our knowledge, this is the first study that investigates the multiscale entropy for time scales longer than 1 minute. Our analysis found that the attention entropy of the overnight SpO2 signals at time scale longer than 1 minute could be useful features for distinguishing apnea positive and negative. This is a new finding that no prior study had discovered. Third, we developed and validated classification models for sleep apnea screening that will have greater compatibility with home use sleep tracking technologies, because the models only rely on one input signal—overnight SpO2—that is nowadays readily measurable with off-the-shelf digital sleep health gadgets.
The rest of the article is organized as follows. The “Method” section explains the database, feature construction and transformation, model training and test, and performance evaluation measures. The “Result” section shows the visualization of the MSAE for the positive and negative groups for various scale factors and the performance of the apnea screening models. In the “Discussion” section, we provide interpretations of the principal findings, compare our work with prior work, and highlight the limitations of the current work. The article is concluded in the last section.
Method
Database
In this study, we used the SHHS database. The SHHS is a multi-center cohort study that aims to investigate the associations between sleep apnea and other diseases including stroke, hypertension, coronary heart disease, and all-cause mortality. Subjects who met the inclusion criteria were those 40 years or older with no history of treatment of sleep apnea and tracheostomy, and were not under home oxygen therapy at the time of the experiment. Subjects underwent two PSG tests with the second test conducted at least 3 years after the first one. PSG tests were performed at subjects’ homes for better ecological validity. The SpO2 signals were recorded using a Nonin XPOD 3011 with an 8000J sensor attached to a finger. Recordings shorter than 4 hours were removed. The sampling rate was 1 Hz. All subjects provided written informed consent before experiments started. Access to the SHHS database was granted by the National Sleep Research Resource (NSRR), and the handling of the data in this study was compliant with the Data Access and Use Agreement (DAUA).
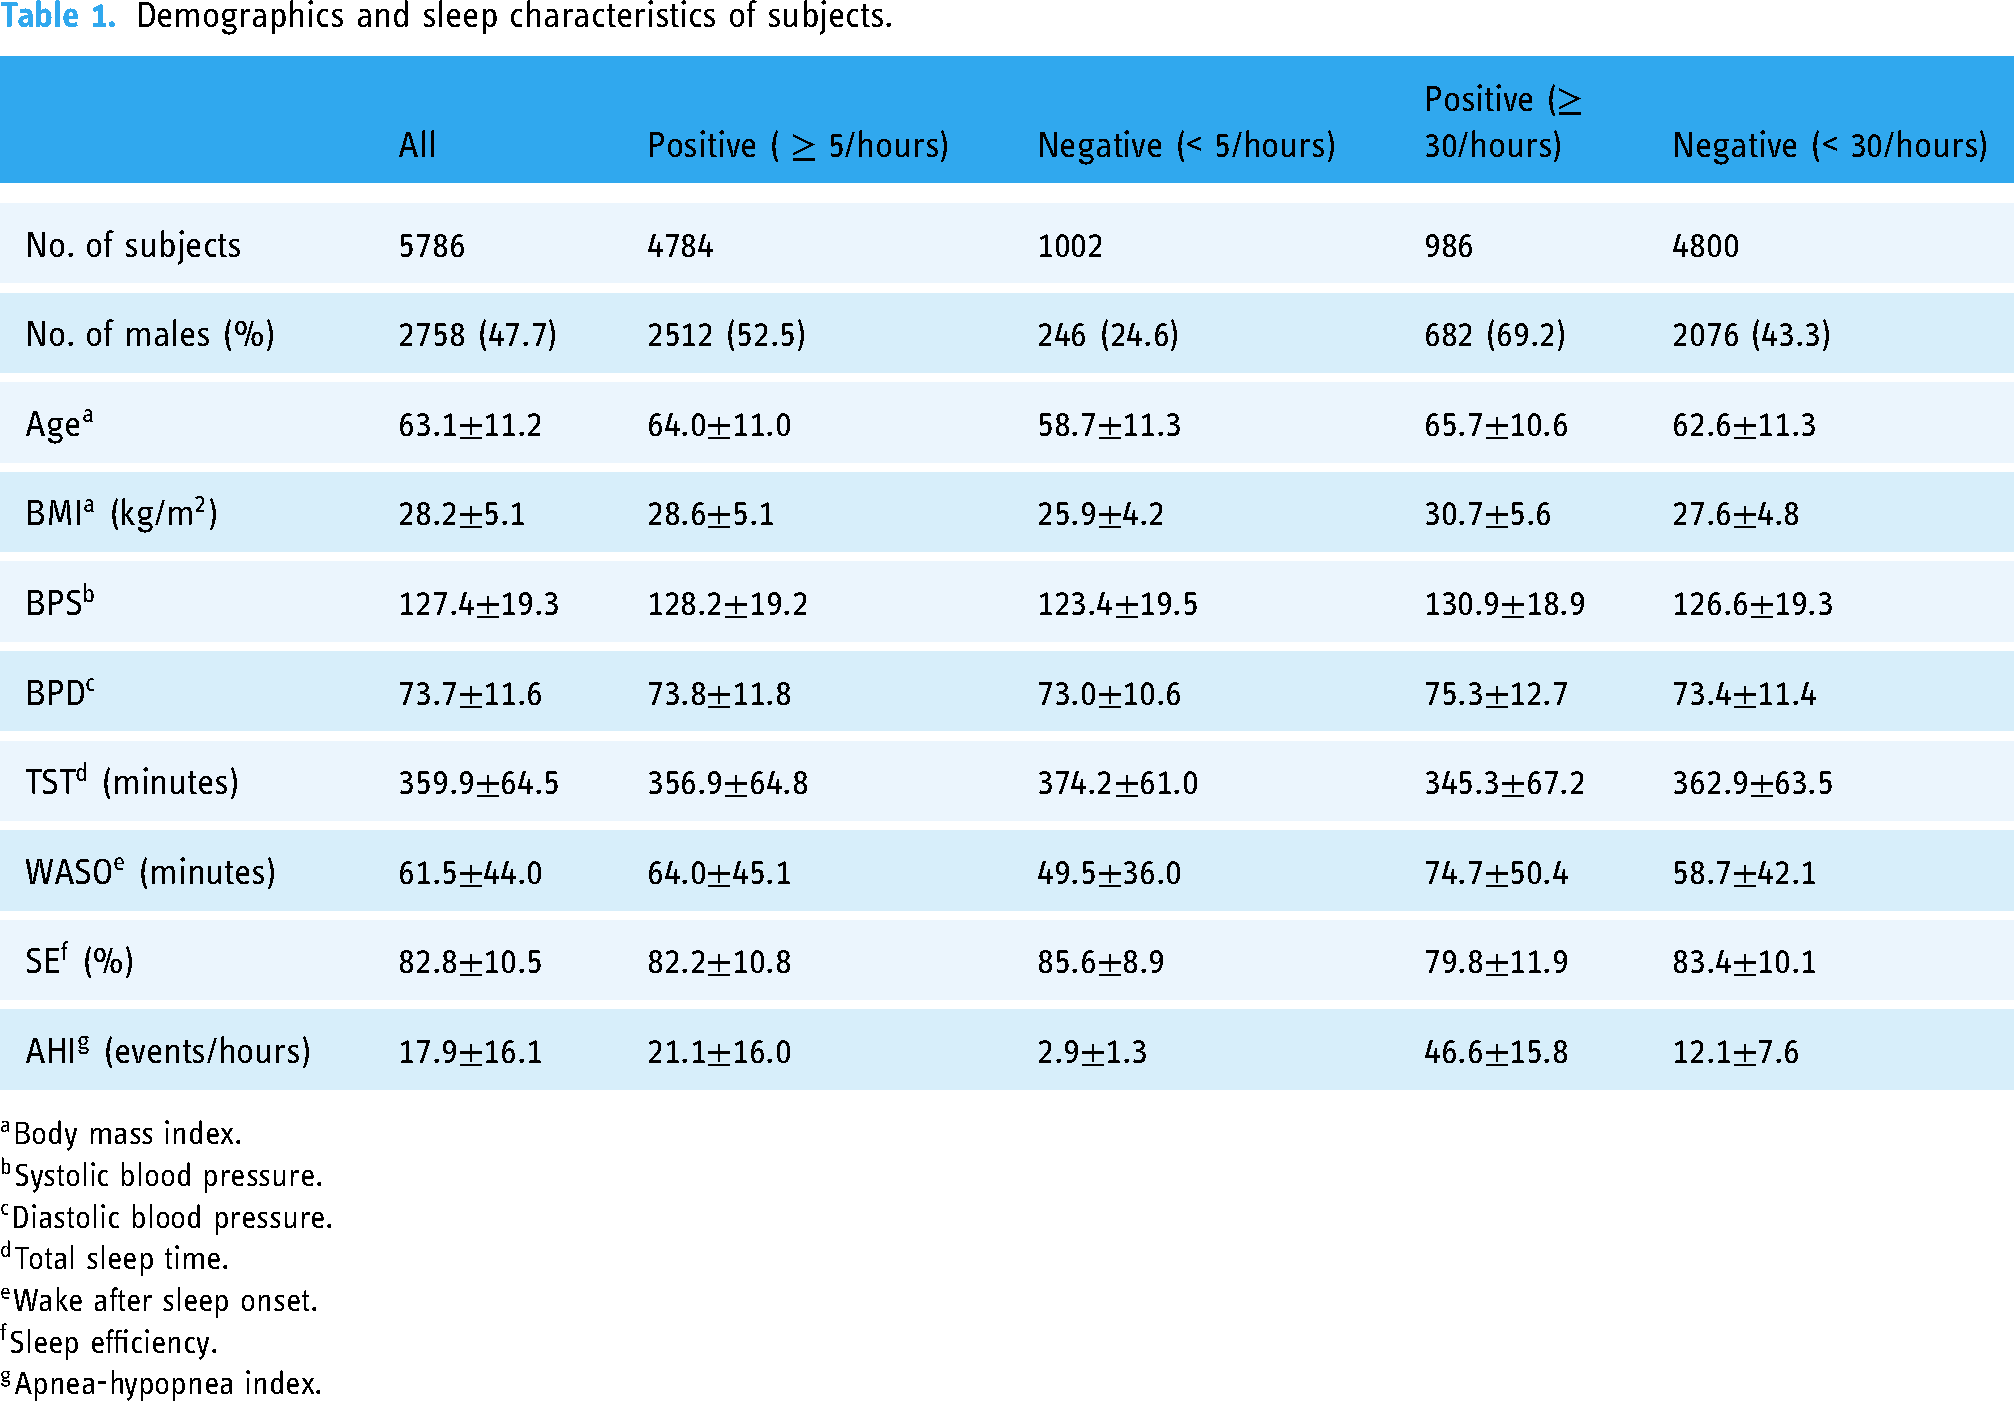
We used 5786 SpO2 recordings of subjects’ first visits to build the sleep apnea screening models in this study. The recordings of the second visits were discarded to avoid introducing within-subject dependency. The demographics and sleep-related characteristics of the subjects are shown in Table 1. The mean age was 63.1 years and 47.7% were men. The apnea prevalence was high (82.6%) due to the intentional oversampling of snorers in SHHS. The prevalence of severe apnea as defined by AHI
Demographics and sleep characteristics of subjects.
Data were retrieved from the NSRR repositories upon approval. 28 The PSG recordings were downloaded as European Data Format (EDF) files from which the SpO2 signals were extracted to derive MSAE features. In line with prior studies,17,29,30,23 we considered the followings as artifacts and removed them from the SpO2 signals: (1) readings of zeros, (2) readings below 50% or above 100%, and (3) sudden changes of more than 4% between consecutive readings. In addition to extracting the SpO2 signals from the PSG recordings in the SHHS database, we also used several demographic variables that individuals can easily obtain at home. Those variables include age, sex, body mass index (BMI), systolic blood pressure (BPS), and diastolic blood pressure (BPD).
It is worth noting that the database contains several harmonized AHI variables. This is because several major revisions were made to the guideline of sleep scoring rules along the years, leading to slight changes in the calculation of AHI. Based on the latest version of the guideline,
31
some of the AHI variables are considered as “recommended,” while others are considered as “alternative” or “acceptable.” We used the nsrr_ahi_ph3r_aasm15 variable as the ground truth because the annotation rules are consistent with the recommended rules in the latest guideline.
31
In detail, the AHI was calculated as the number of apnea and hypopnea events with more than 30% nasal airflow reduction and more than 3% oxygen desaturation with or without arousal per hour of sleep. The calculation of AHI took into account both obstructive sleep apnea and central sleep apnea events. For apnea and non-apnea classification, nsrr_ahi_ph3r_aasm15

Examples of SpO2 signals of (upper) a subject without sleep apnea, (middle) a subject with mild to moderate apnea, and (lower) a subject with severe apnea.
Feature construction based on multiscale attention entropy analysis
In our proposed method, features were derived based on the MSE analysis of the overnight SpO2 recordings. The MSE analysis is a technique to evaluate the complexity and regularity of a signal at multiple time scales.
32
It generates insights into the dynamic temporal fluctuations of the information encoded in a signal and provides additional useful information that conventional single-value entropy measure fails to capture. The MSE analysis iterates over two steps for each specified scale factor

Process for multiscale attention entropy (MSAE) calculation.
The first step of the MSAE analysis is to segment a cleaned SpO2 signal into non-overlapping coarse-grained sequences for different temporal scales. Given a digital SpO2 signal 
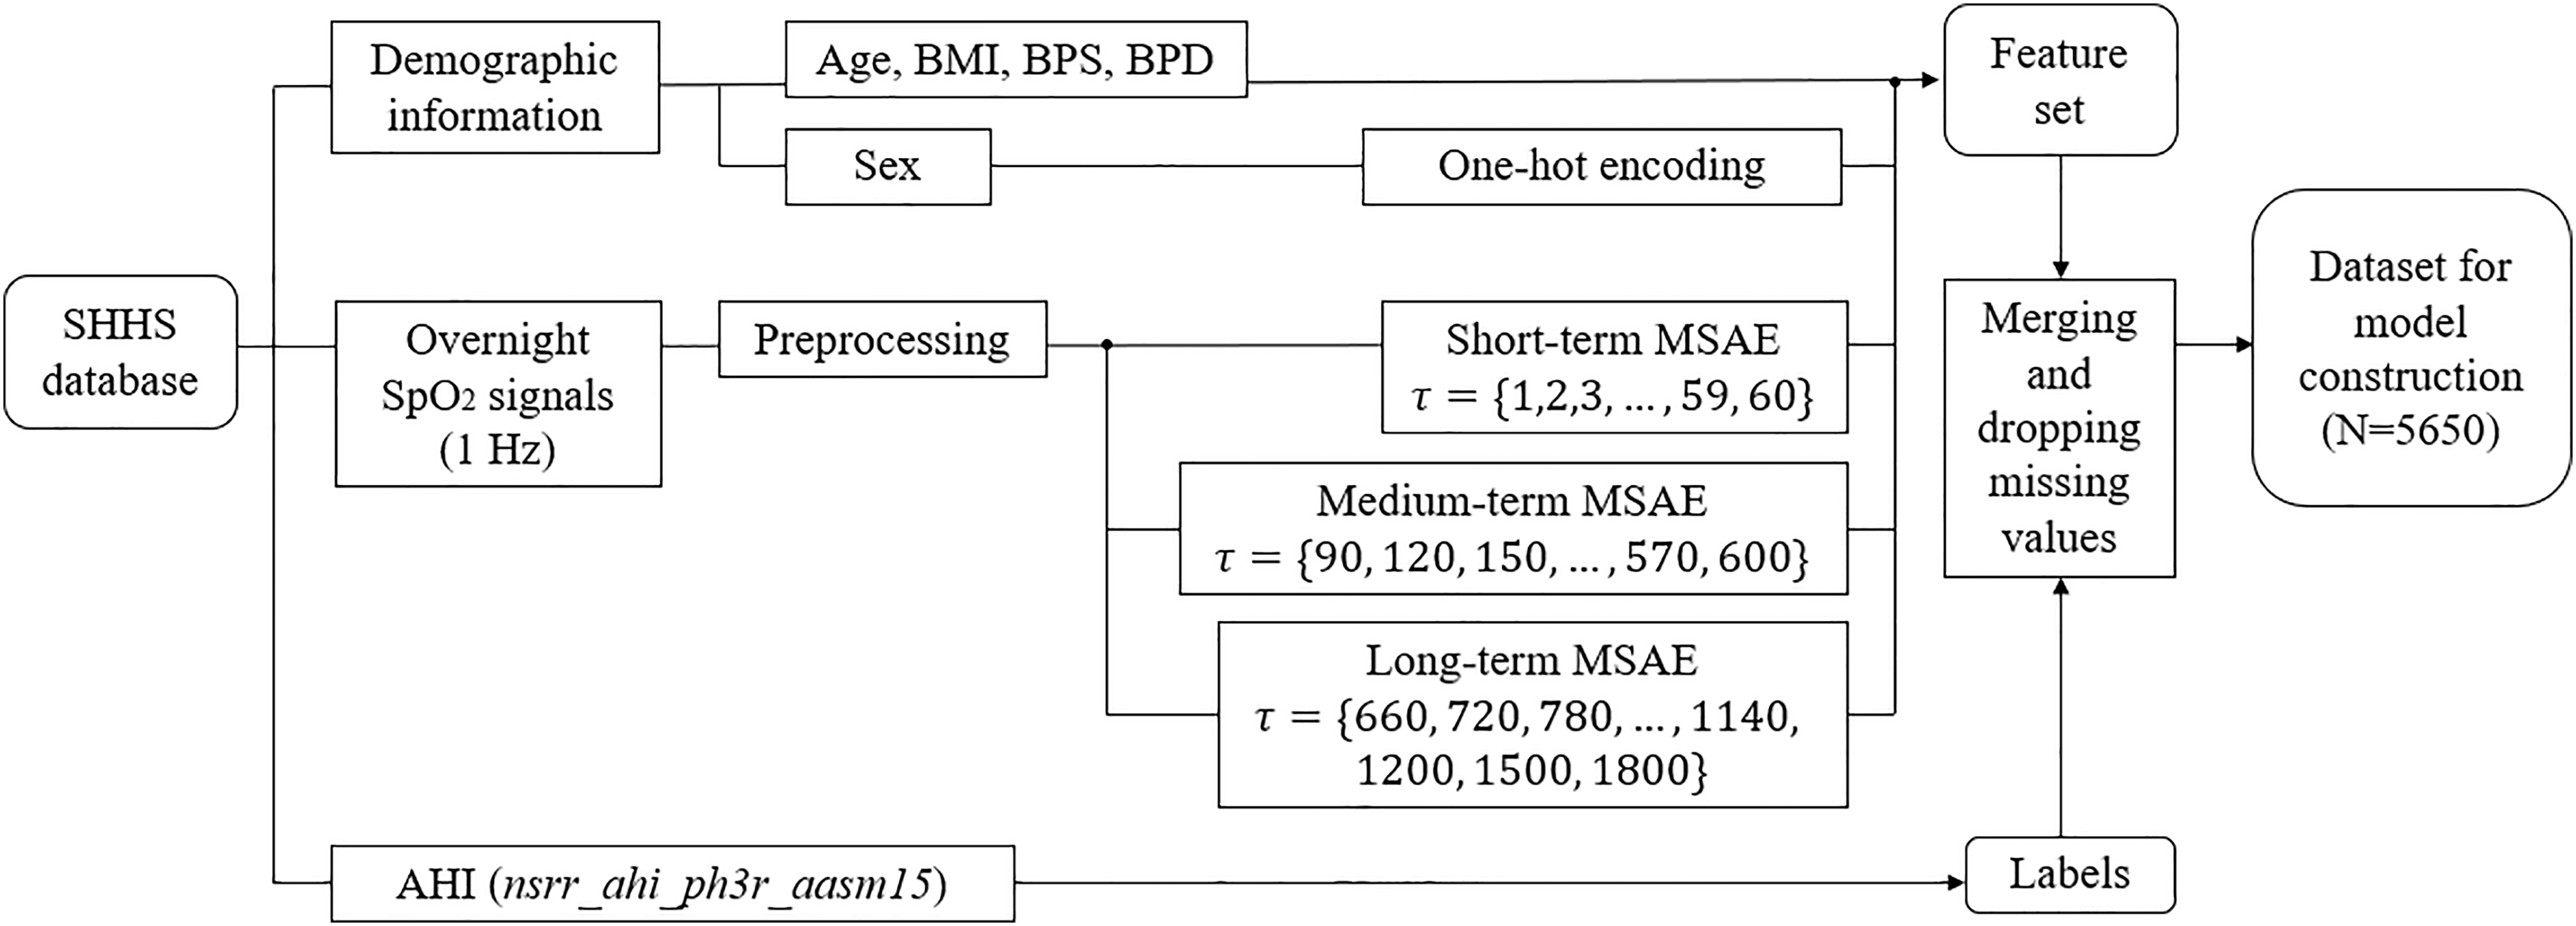
Process for feature and label construction. BMI: body mass index; BPS: systolic blood pressure; BPD: diastolic blood pressure.
Feature transformation using independent component analysis
A potential issue with the MSAE-based feature construction is that the derived features are correlated. As feature dependency may compromise the performance of classification models, we applied the ICA to transform the raw features into a new set of features so that the statistical dependency among the transformed features is minimized. The ICA technique was originally used in the field of computational neural science for de-noising EEG signals 40 and was later applied to a variety of problems. 41 In this study, the input to the ICA is the original set of the MSAE features, and the output of the ICA is a set of maximally independent features which are linear combinations of the original MSAE features. The number of components was set to the dimension of the original feature set, as the objective of the ICA was to remove the dependencies among the original features instead of dimension reduction.
We firstly normalized the original MSAE features because the ICA is sensitive to the scale of the input. Feature scaling is also an important preprocessing step for many machine learning algorithms, especially for distance-based learning algorithms such as support vector machine (SVM).
42
We normalized the range of the features using one of the following three methods.
Standard scaling (SS) normalizes features to have zero mean and unit variance. Robust scaling (RS) removes the median and scales features to the range between the first and the third quartiles. This scaling method is robust to outliers. Min–max scaling (MS) normalizes features to between zero and one.
Model training, validation, and test
We applied three supervised machine learning algorithms that are most suited for binary classification with medium data size: logistic regression (LR), SVM, and light gradient boosting machine (LGBM). LR and SVM have previously shown promise in sleep apnea classification with demographic features,9,43 whereas no prior study has used LGMB. Following the common practice in machine learning, we used 80% of the datasets for training and the rest for test. Hyper-parameters were tuned through grid search over a parameter grid and with 5-fold cross-validation to avoid over-fitting. The area under the receiver operating characteristic curve (AUC) was used as a model performance measure during the grid search. At the end of the grid search, a model was fitted on the entire training set with the best combination of hyperparameter values. The process of model construction is illustrated in Figure 4. Tree-based machine learning algorithms such as LGMB are not sensitive to feature scale nor the dependency among features. Hence, we constructed seven LGBM models with or without feature scaling and ICA. In contrast, LR models are sensitive to both feature scaling and multicollinearity. Hence, we constructed three RF models with feature scaling and ICA. SVM models are sensitive to feature scaling but less sensitive to multicollinearity. Hence, we constructed six SVM models with feature scaling and with or without ICA. The models were denoted using the following naming rule: [machine learning technique]_[scaling method]_[ICA or none]. For example, rSVM_SS and rSVM_SS_ICA both refer to RBF kernel-based SVM classifiers trained with features that were normalized using standard scaling, but in the former case, the features were not transformed using ICA while in the latter case, the features were transformed.
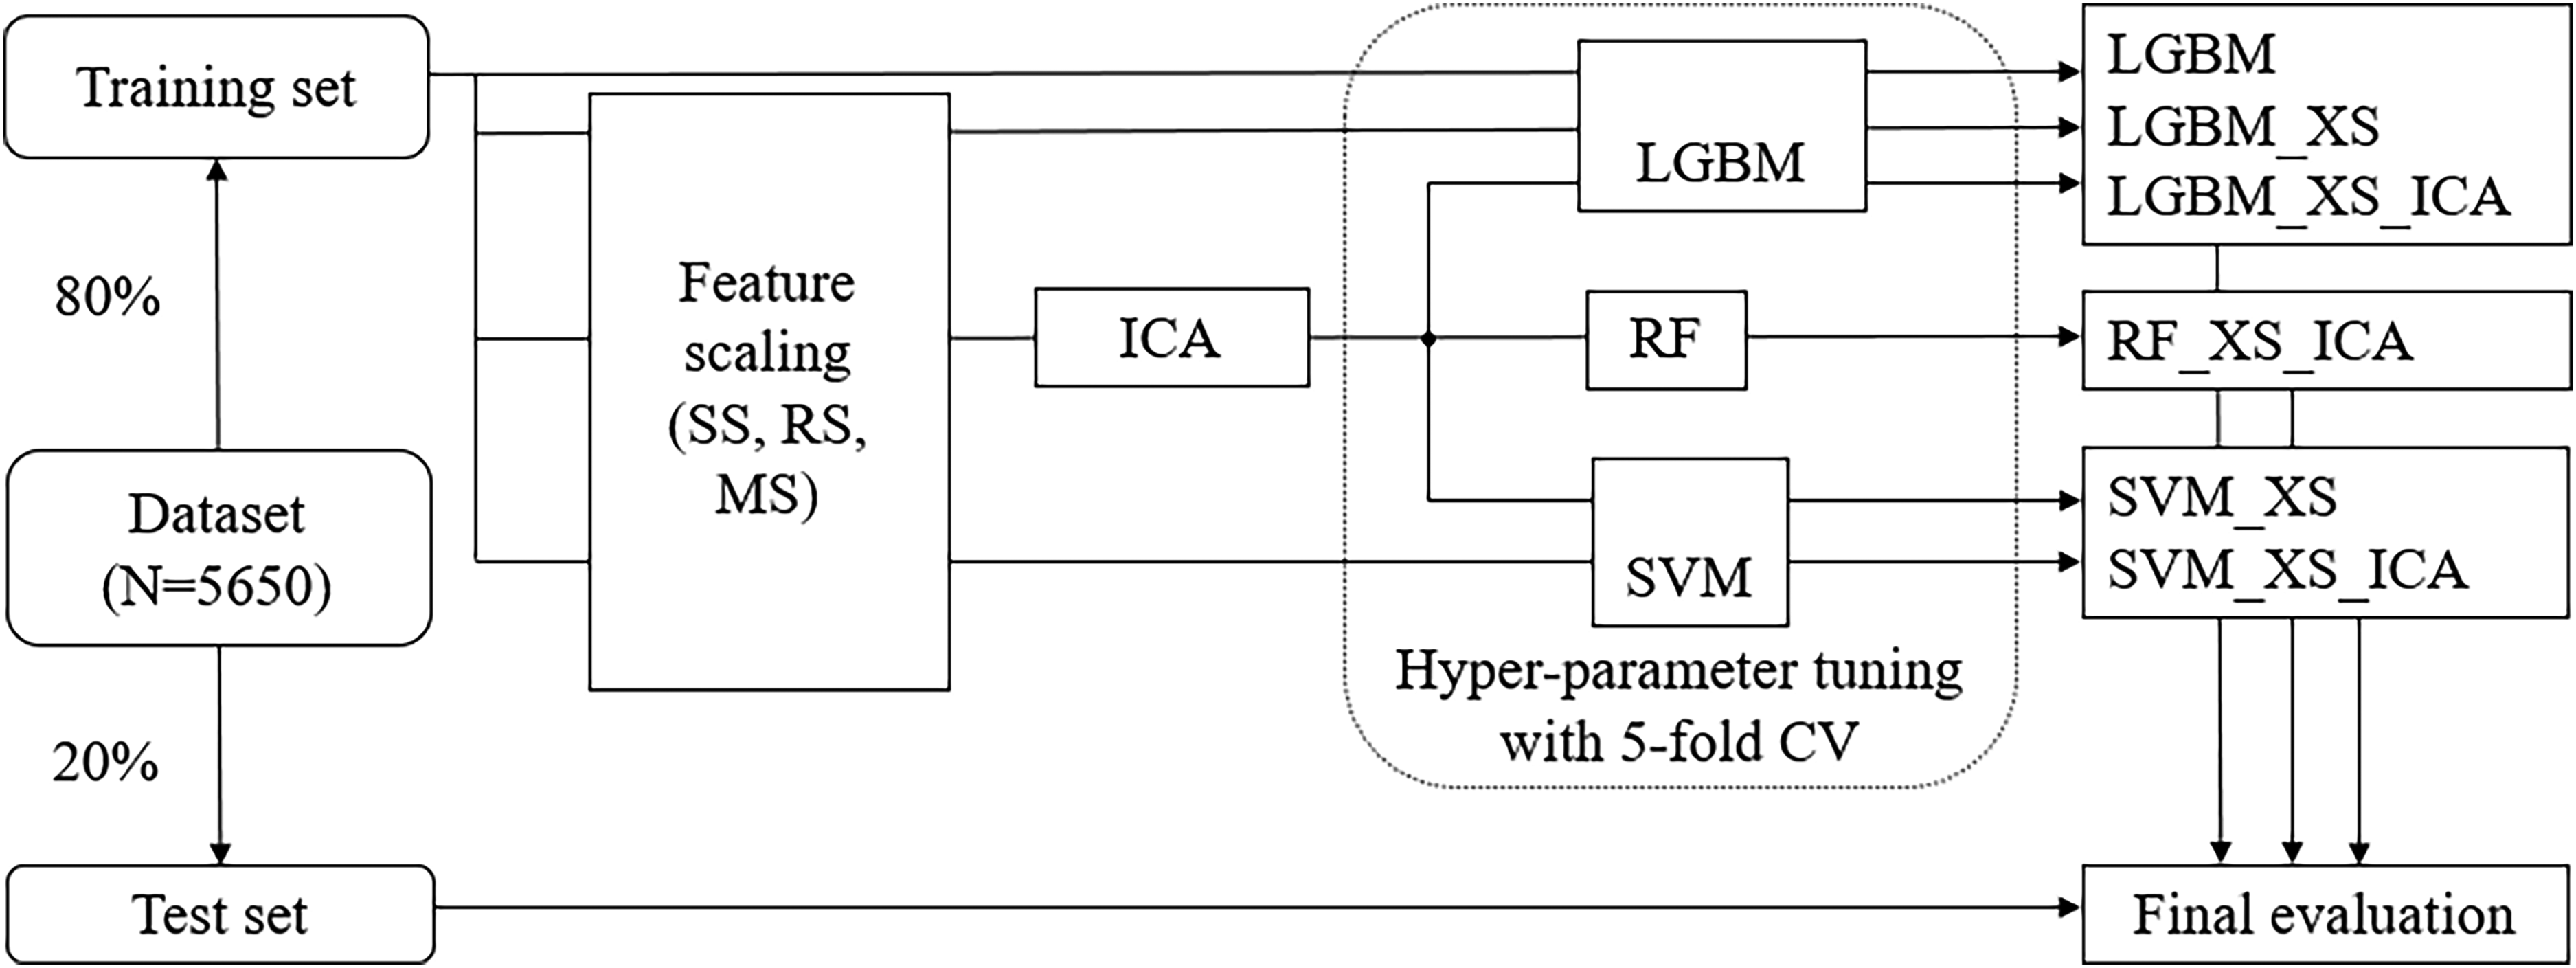
Process for model construction. SS: standard scaling; RS: robust scaling; MS: min–max scaling; XS refers to either SS, RS, or MS.
As shown in Table 1, there are more samples of the positive class than the negative class, implying an imbalanced dataset. To address this problem, the models (for LR and SVM) altered the loss function by weighting the loss of each sample of its class weight, or (for LGBM) re-weighted the splitting criterion, which is inversely proportional to the class frequency in the input data.
Performance evaluation
After hyperparameters tuning the models were evaluated using multiple performance measures. To account for the imbalanced frequencies of each class, we used Matthew’s correlation coefficient (MCC) to evaluate the overall performance of the models. MCC measures the performance of a classification model by summarizing the confusion matrix using equation (3), where TP, TN, FP, and FN denotes true positive, true negative, false positive, and false negative, respectively. The range of the MCC is between 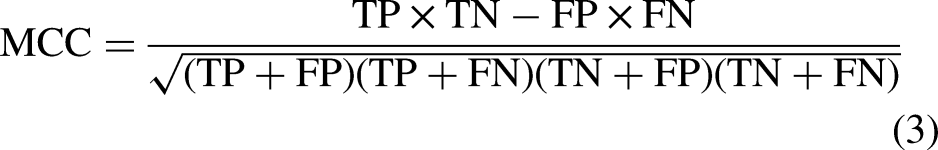
Results
Visualization of MSAE
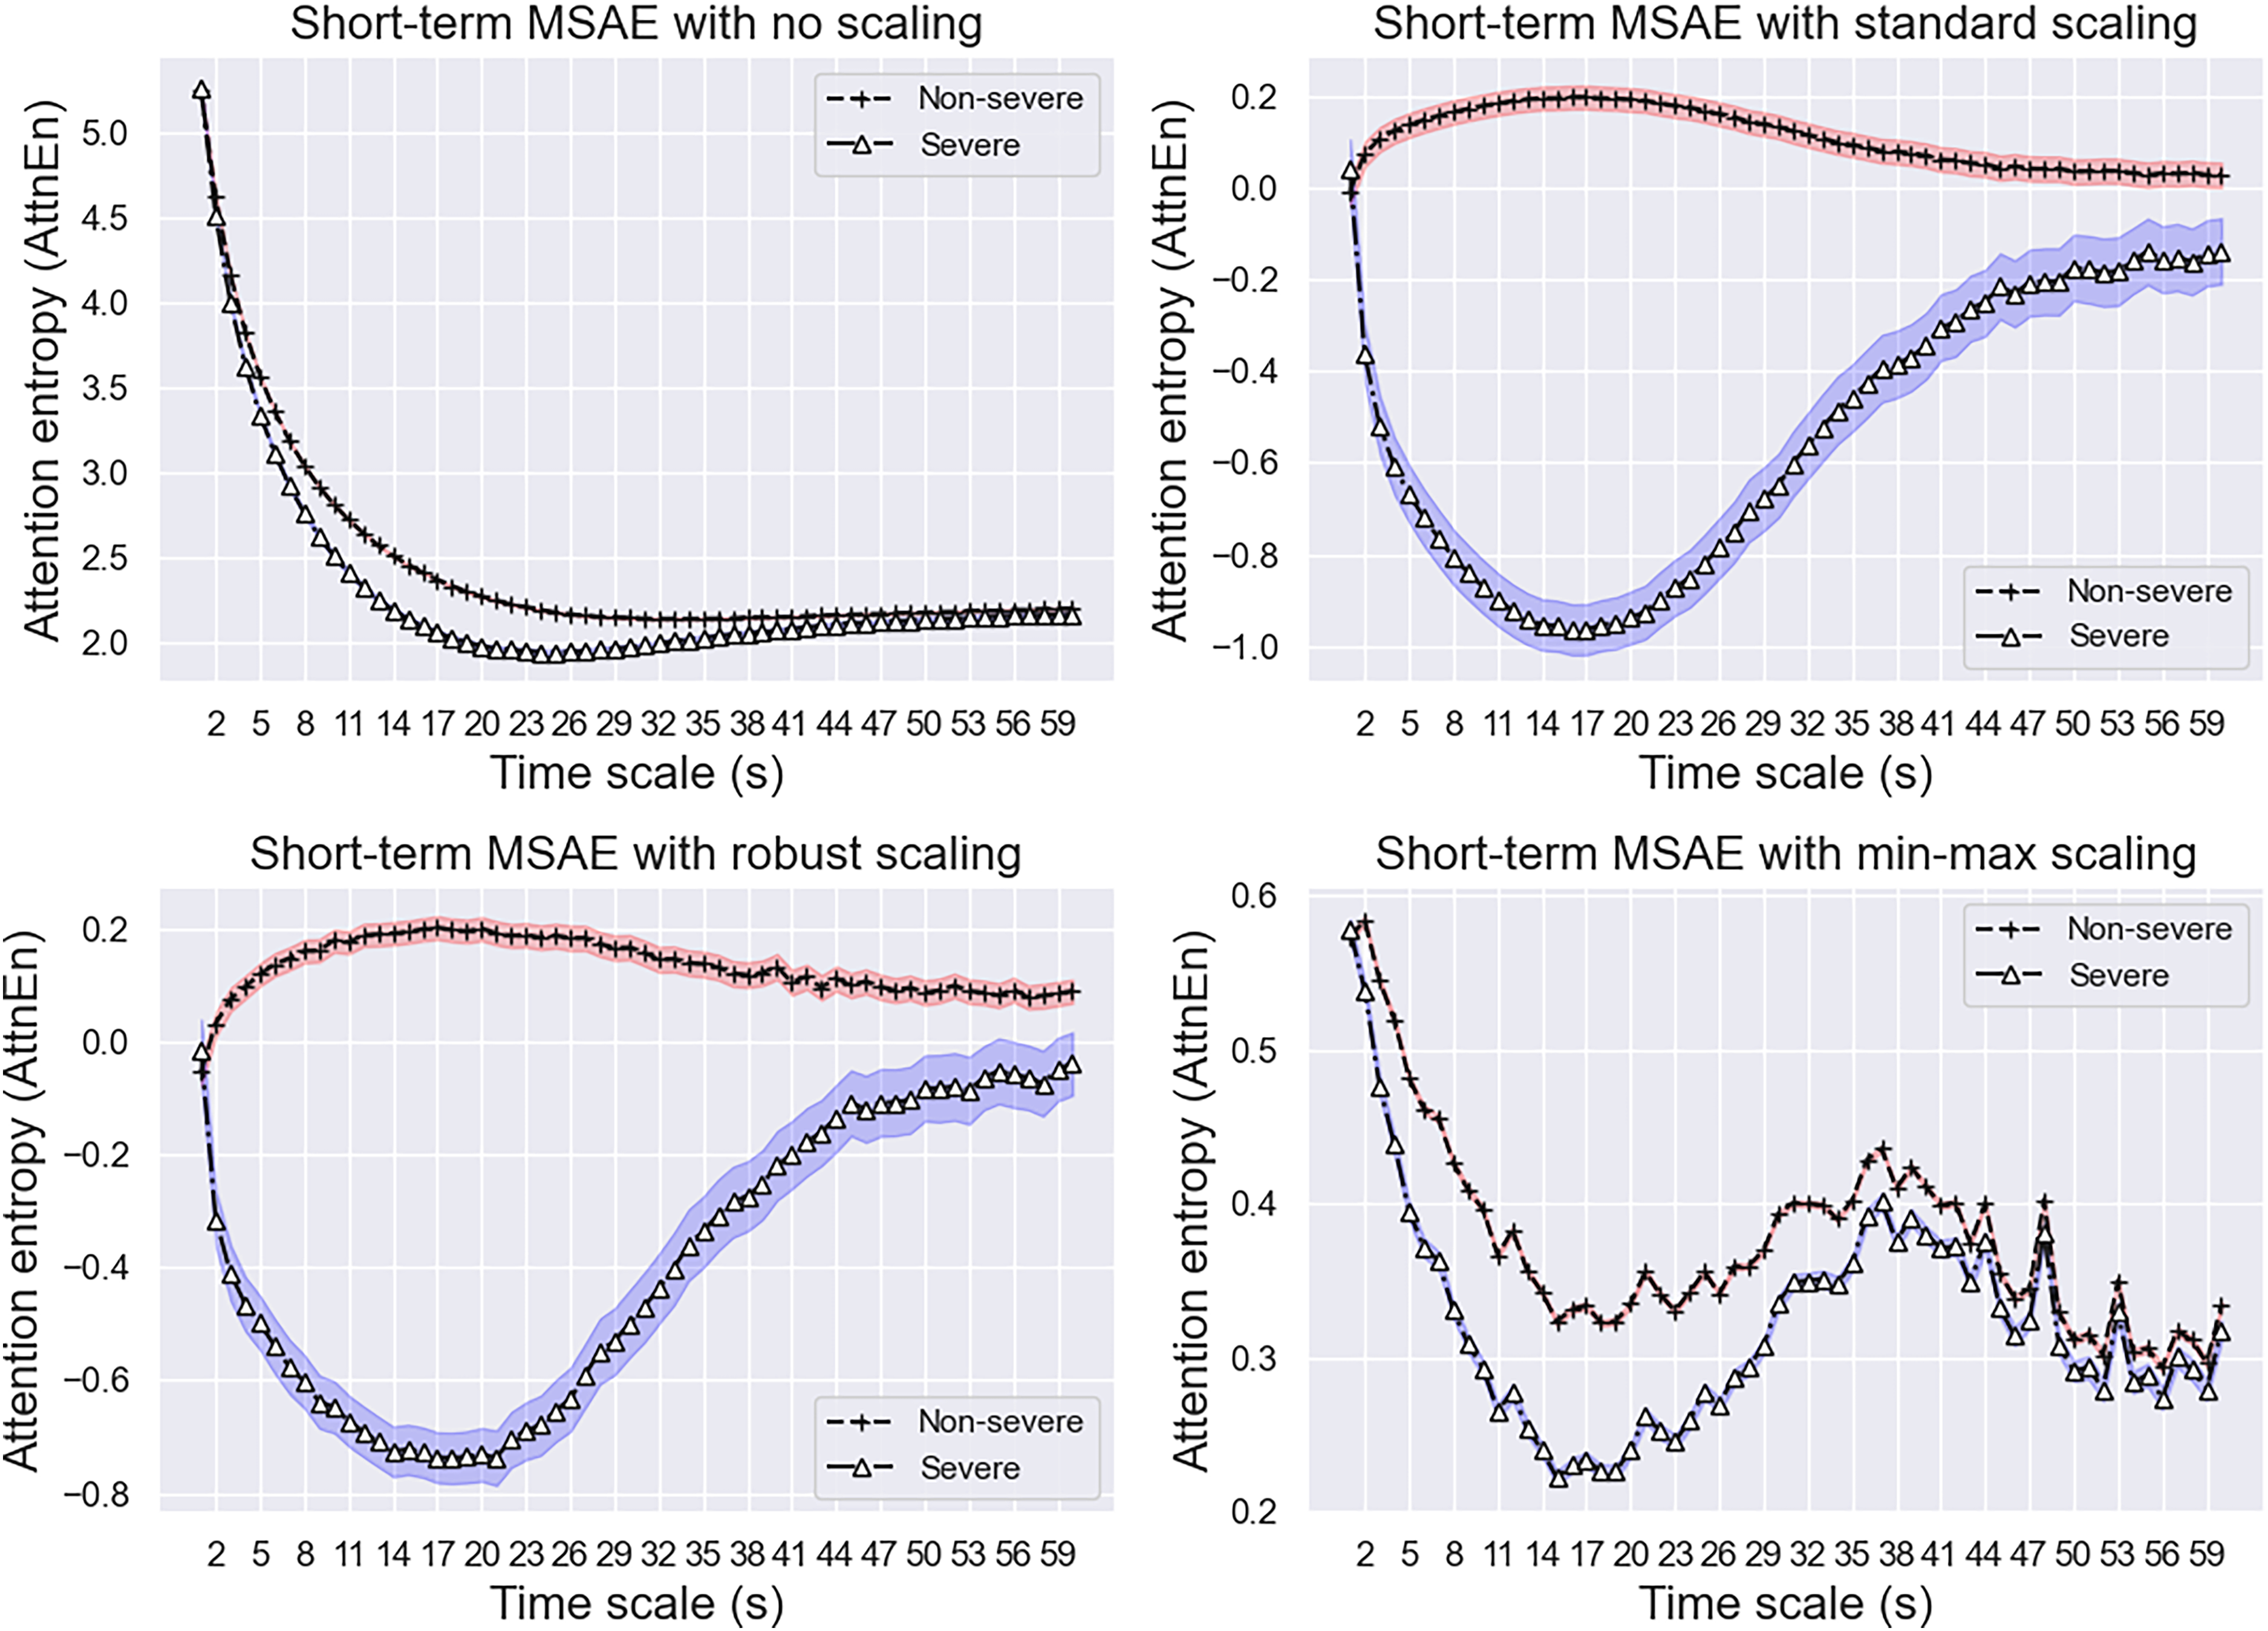
The temporal patterns of attention entropy for different time scales are shown in Figures 5 to 7 for cutoff

Multiscale attention entropy (MSAE) for short-term scale factor (cutoff

Multiscale attention entropy (MSAE) for medium-term scale factor (cutoff

Multiscale attention entropy (MSAE) for long-term scale factor (cutoff
Multiscale attention entropy (MSAE) for short-term scale factor (cutoff
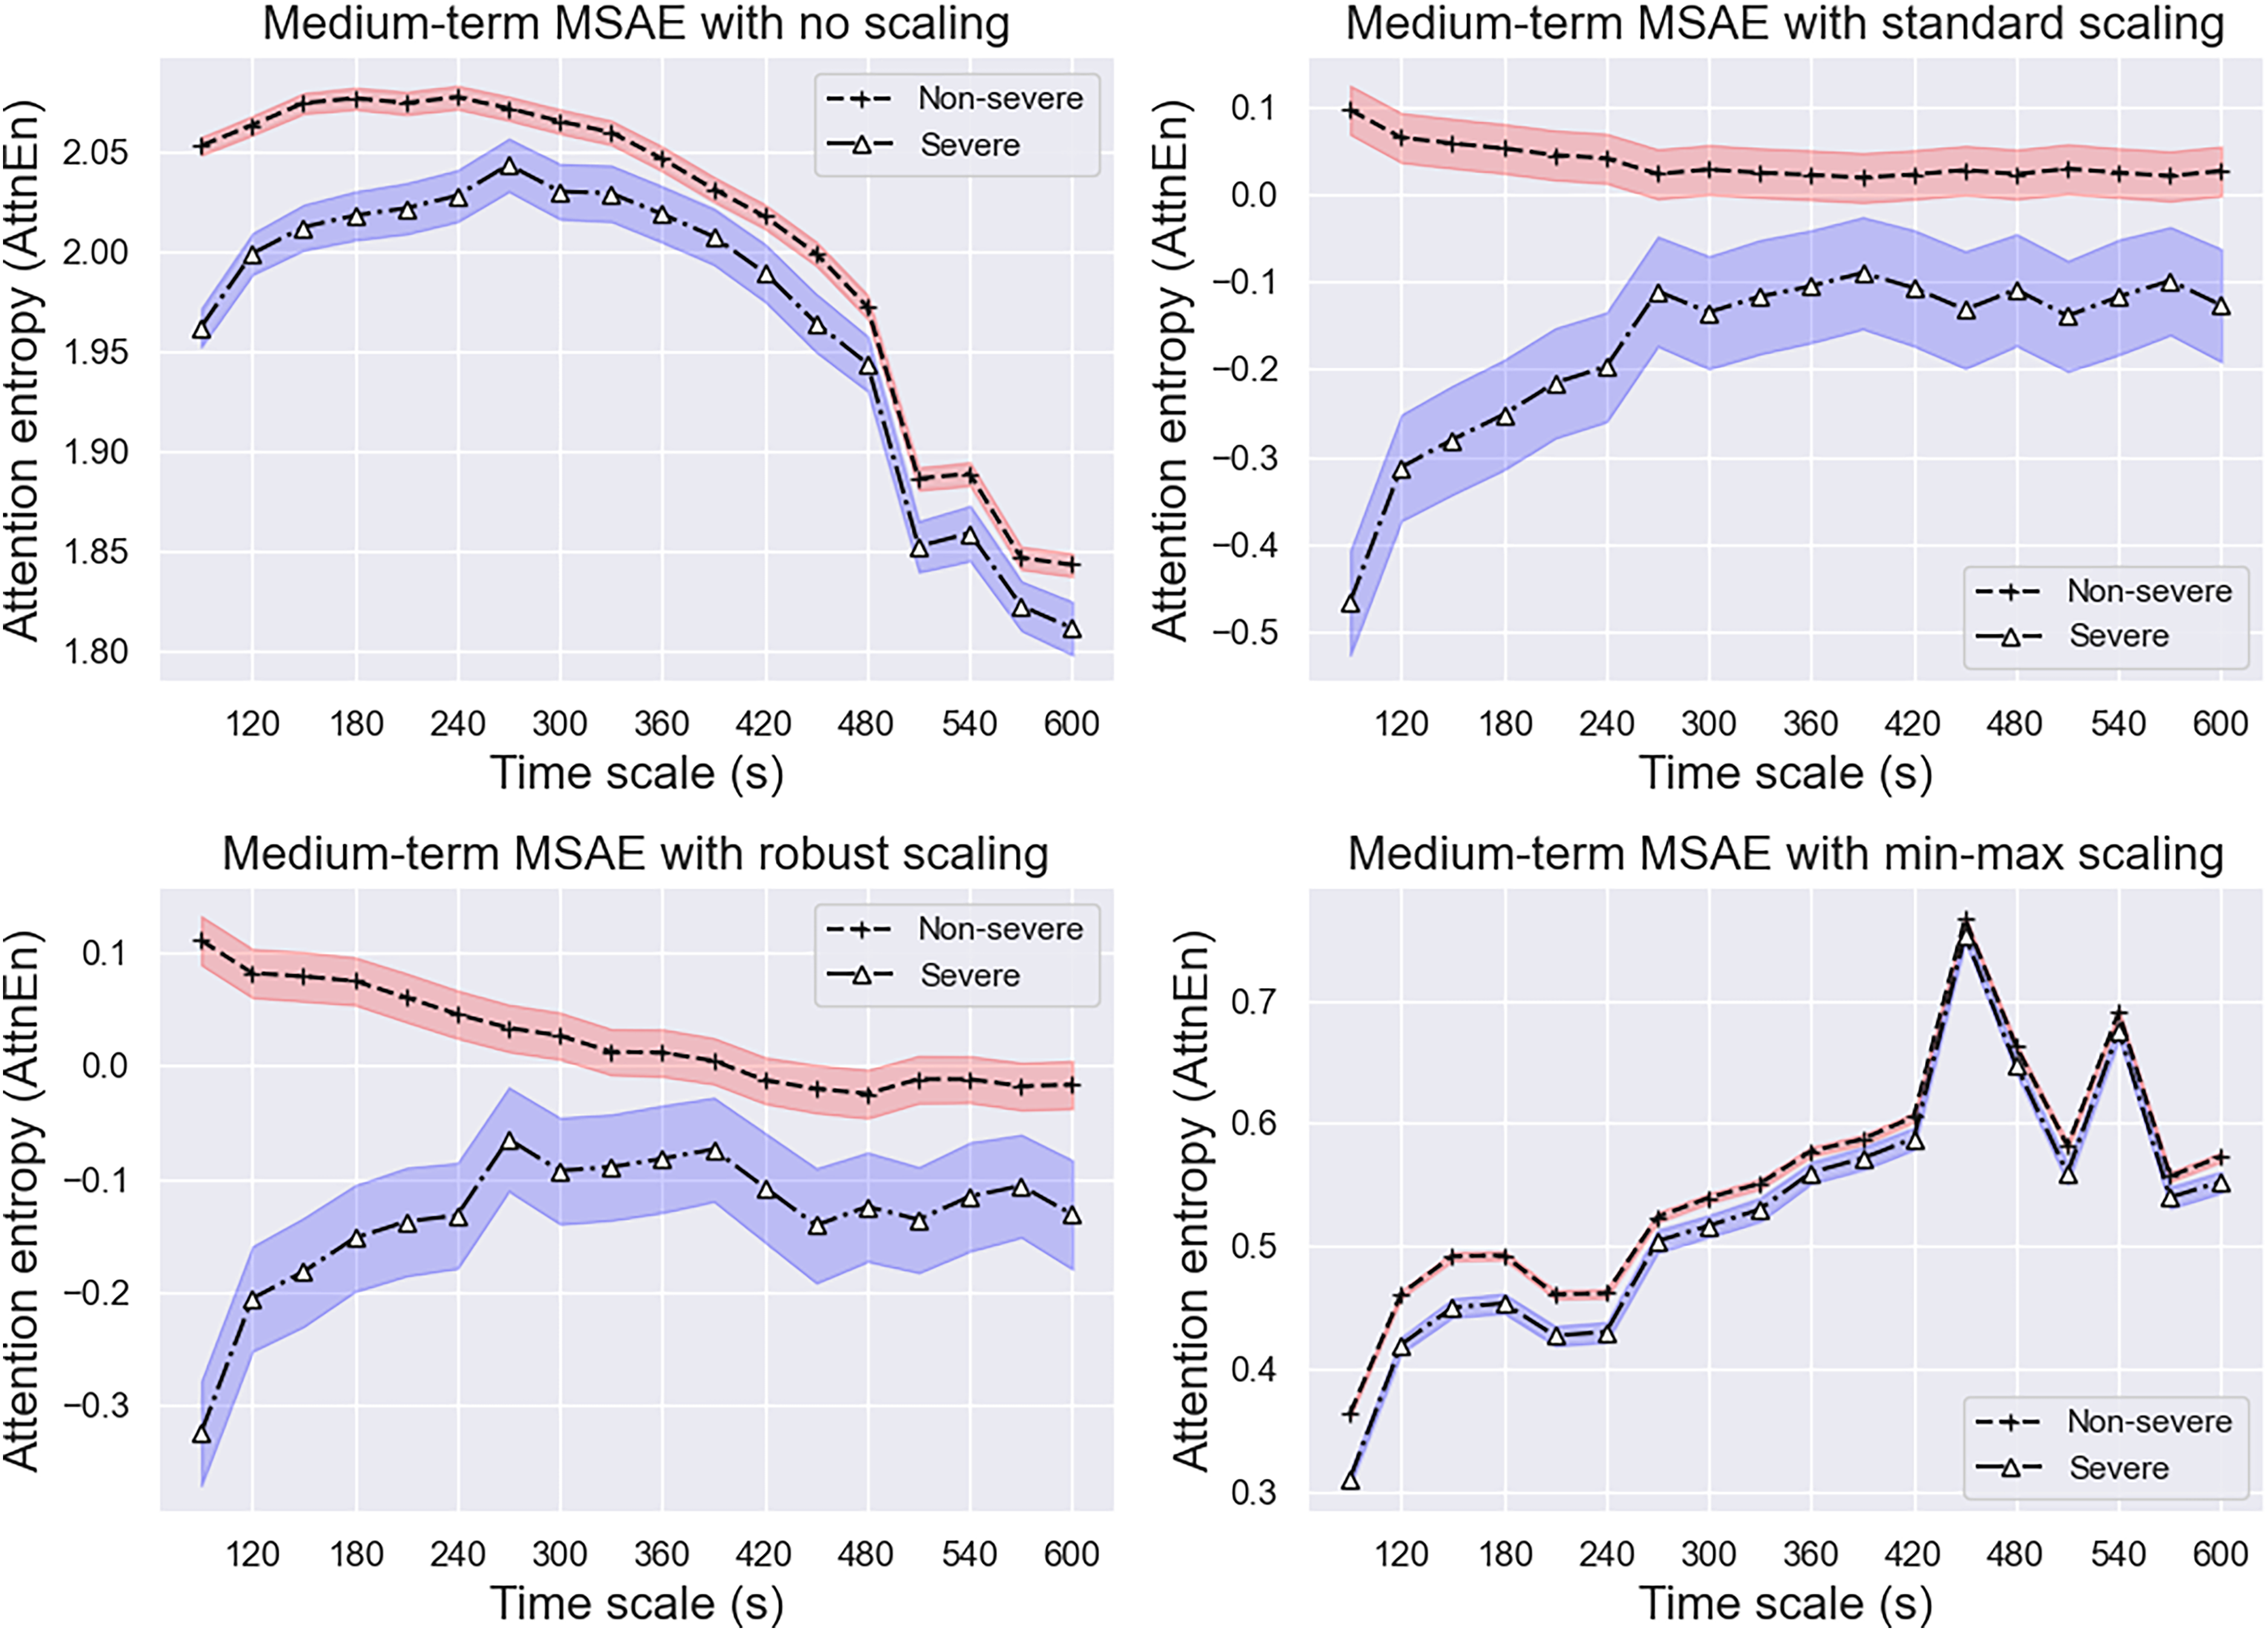
Multiscale attention entropy (MSAE) for medium-term scale factor (cutoff

Multiscale attention entropy (MSAE) for long-term scale factor (cutoff
Model performance
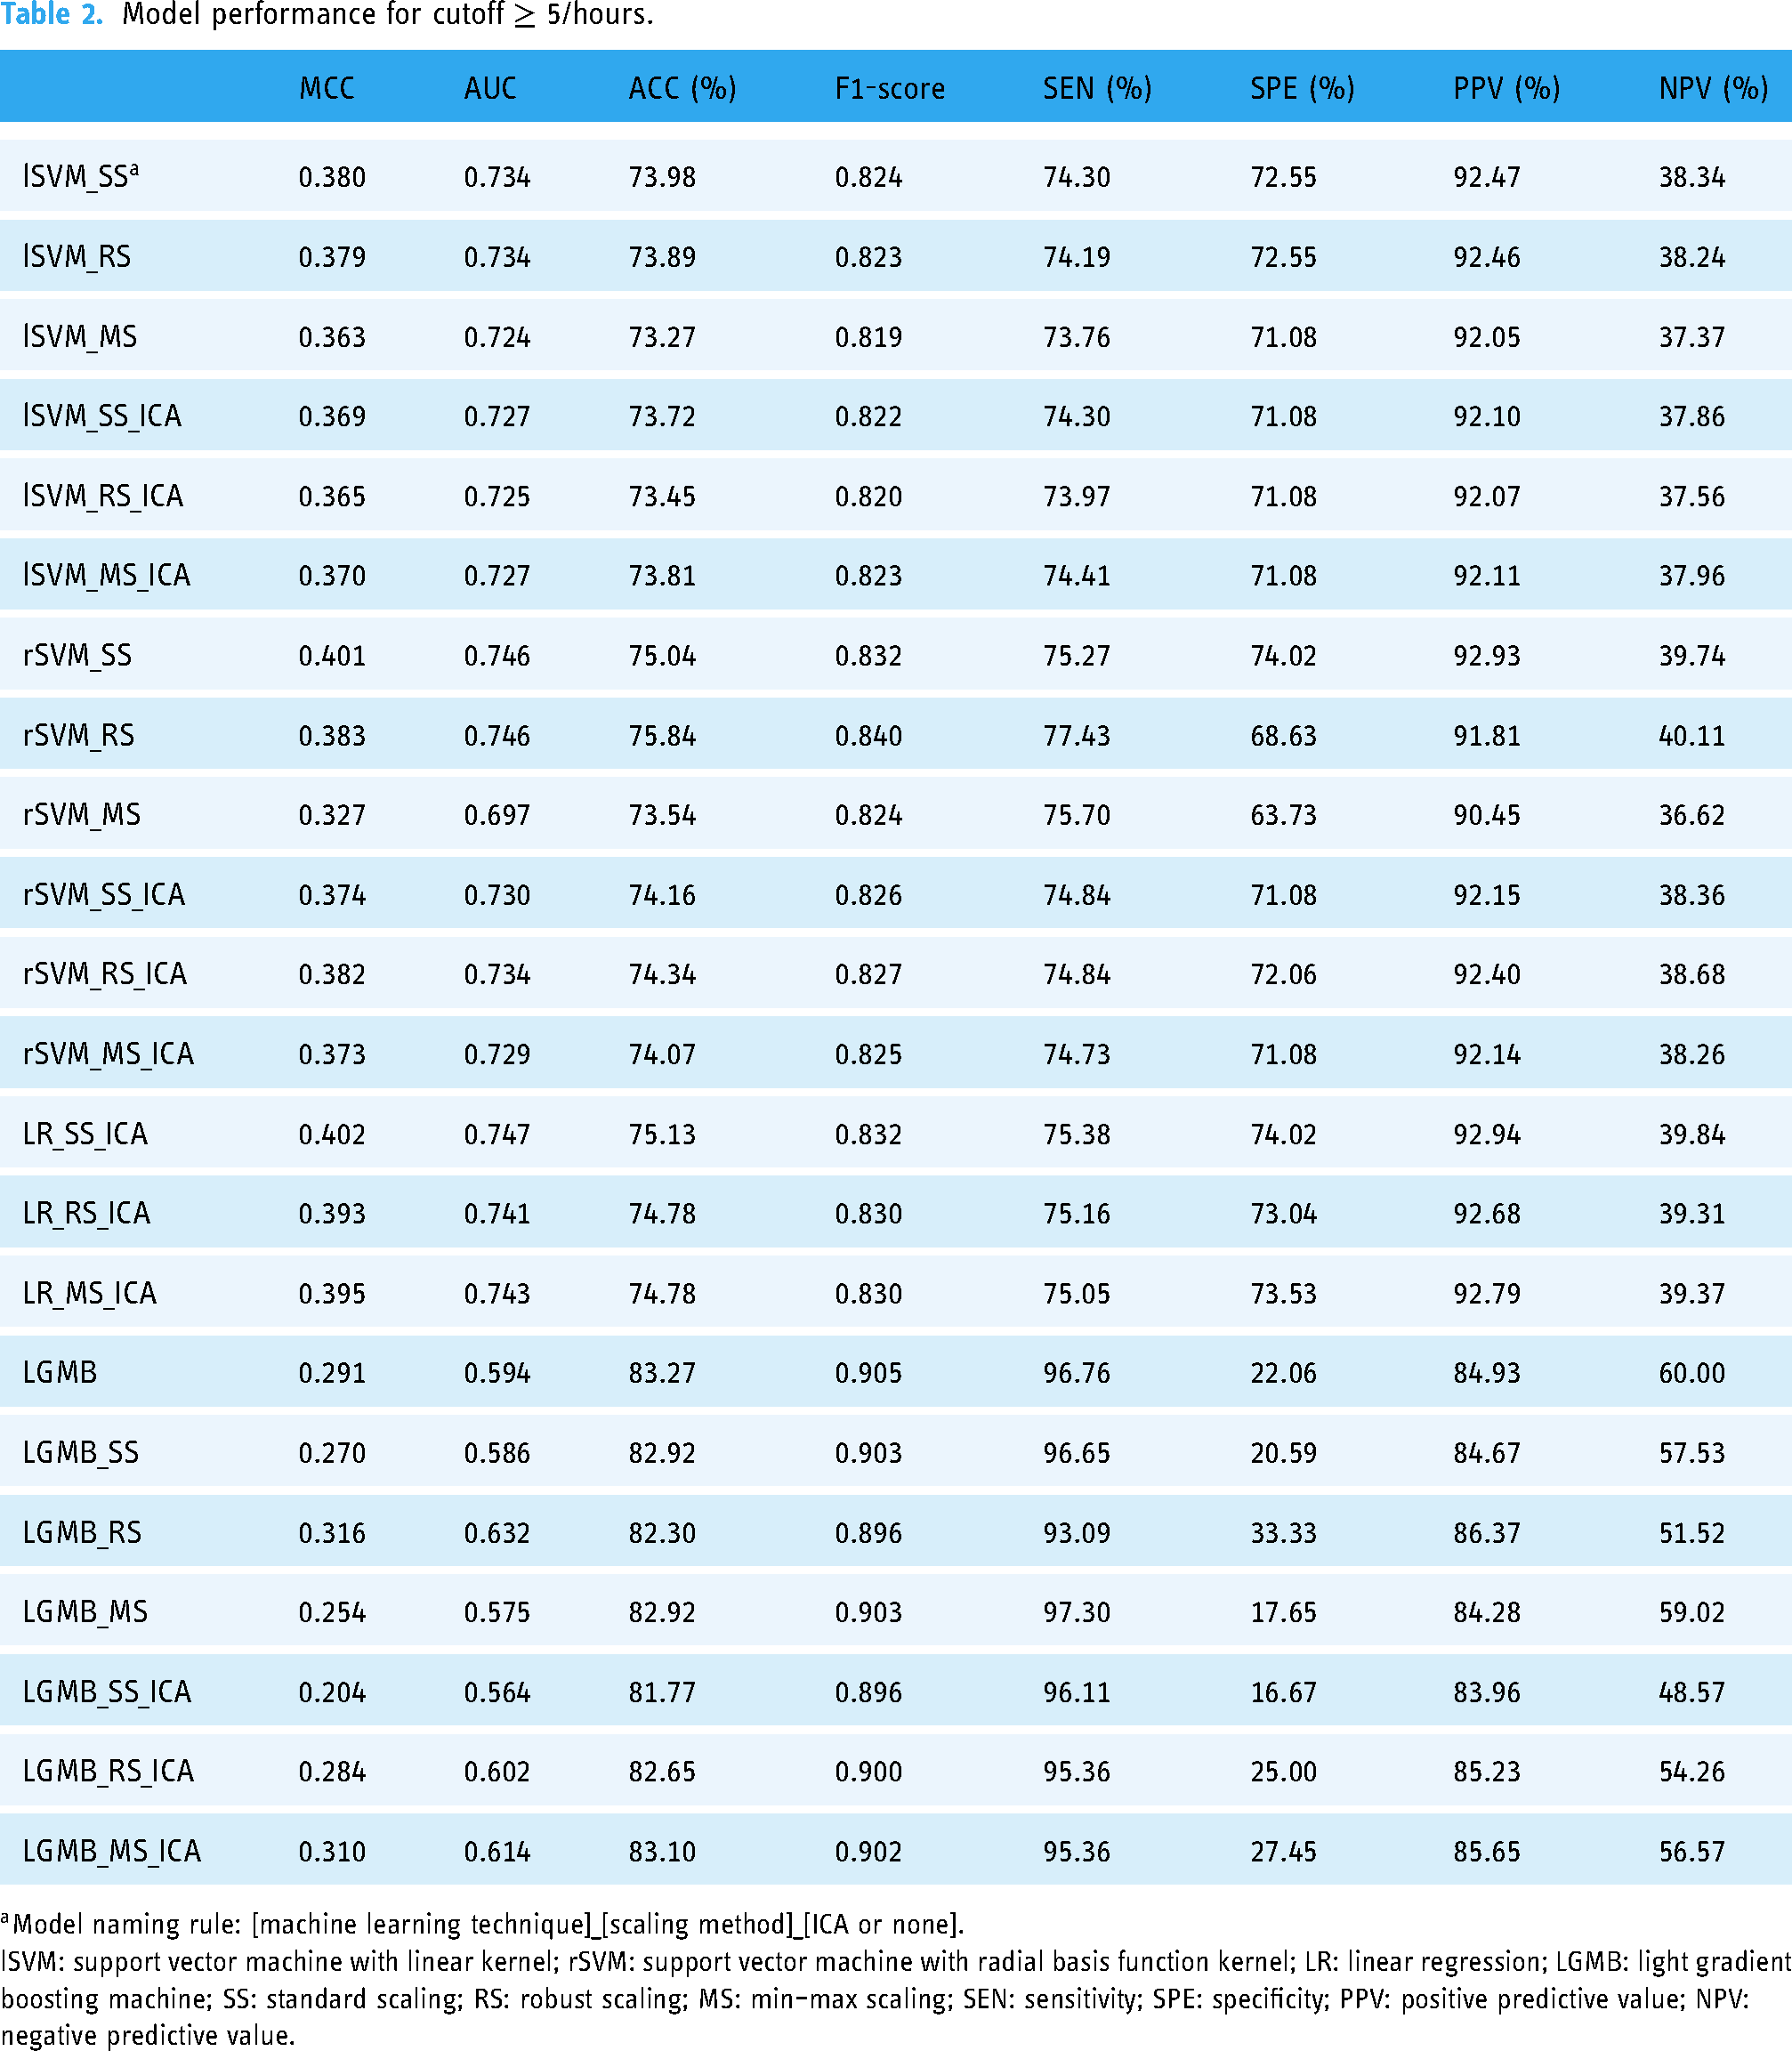
As shown in Table 2, for cutoff
Model performance for cutoff
For cutoff
Model performance for cutoff

Discussion
Principal results
We have proposed a novel method for easy sleep apnea screening and have presented the evaluated results. In what follows, we discuss the principal findings and their interpretations within the current landscape of the related research field.
To the best of our knowledge, this is the first study that examines multiscale entropy for a wide range of time scales. While prior studies have used single-scale entropy for a scale factor of 1 as a feature to develop apnea screening models,23,37 our results suggest that single-scale entropy may not have strong distinguishing power between apnea positive and negative groups. As shown in Figures 5 and 8, the attention entropy at a scale factor of 1 of the positive and negative groups are statistically indistinguishable and thus the single-scale entropy measure would have failed in screening the positive cases. As the scale factor increases, however, the between-group difference started to manifest, thus justifying the advantage of using multiscale entropy over single-scale entropy. We found that the MSAE was useful in distinguishing the positive and negative groups at both cutoff thresholds for short- and medium-term time scales. Standard scaling and robust scaling further magnified the differences between groups. The MSAE of the positive group was consistently lower than that of the negative group over a range of time scales for both cutoff thresholds, indicating a loss of complexity in the overnight SpO2 recordings for the positive group. This echoes findings in previous studies that reduced entropy was often observed in the physiological signals recorded from disease populations,32,44 indicating a loss of complexity with disease. Significant differences were observed between the curves of the two groups when the time scale was below 10 minutes. Notably, the difference between groups peaked around scale factors 15–20 for both cutoffs. As the time scale increases above 15 minutes, the two curves started to overlap and eventually converged when the time scale reached 30 minutes.
Regarding the apnea screening models, the best MCC was 0.402 for cutoff
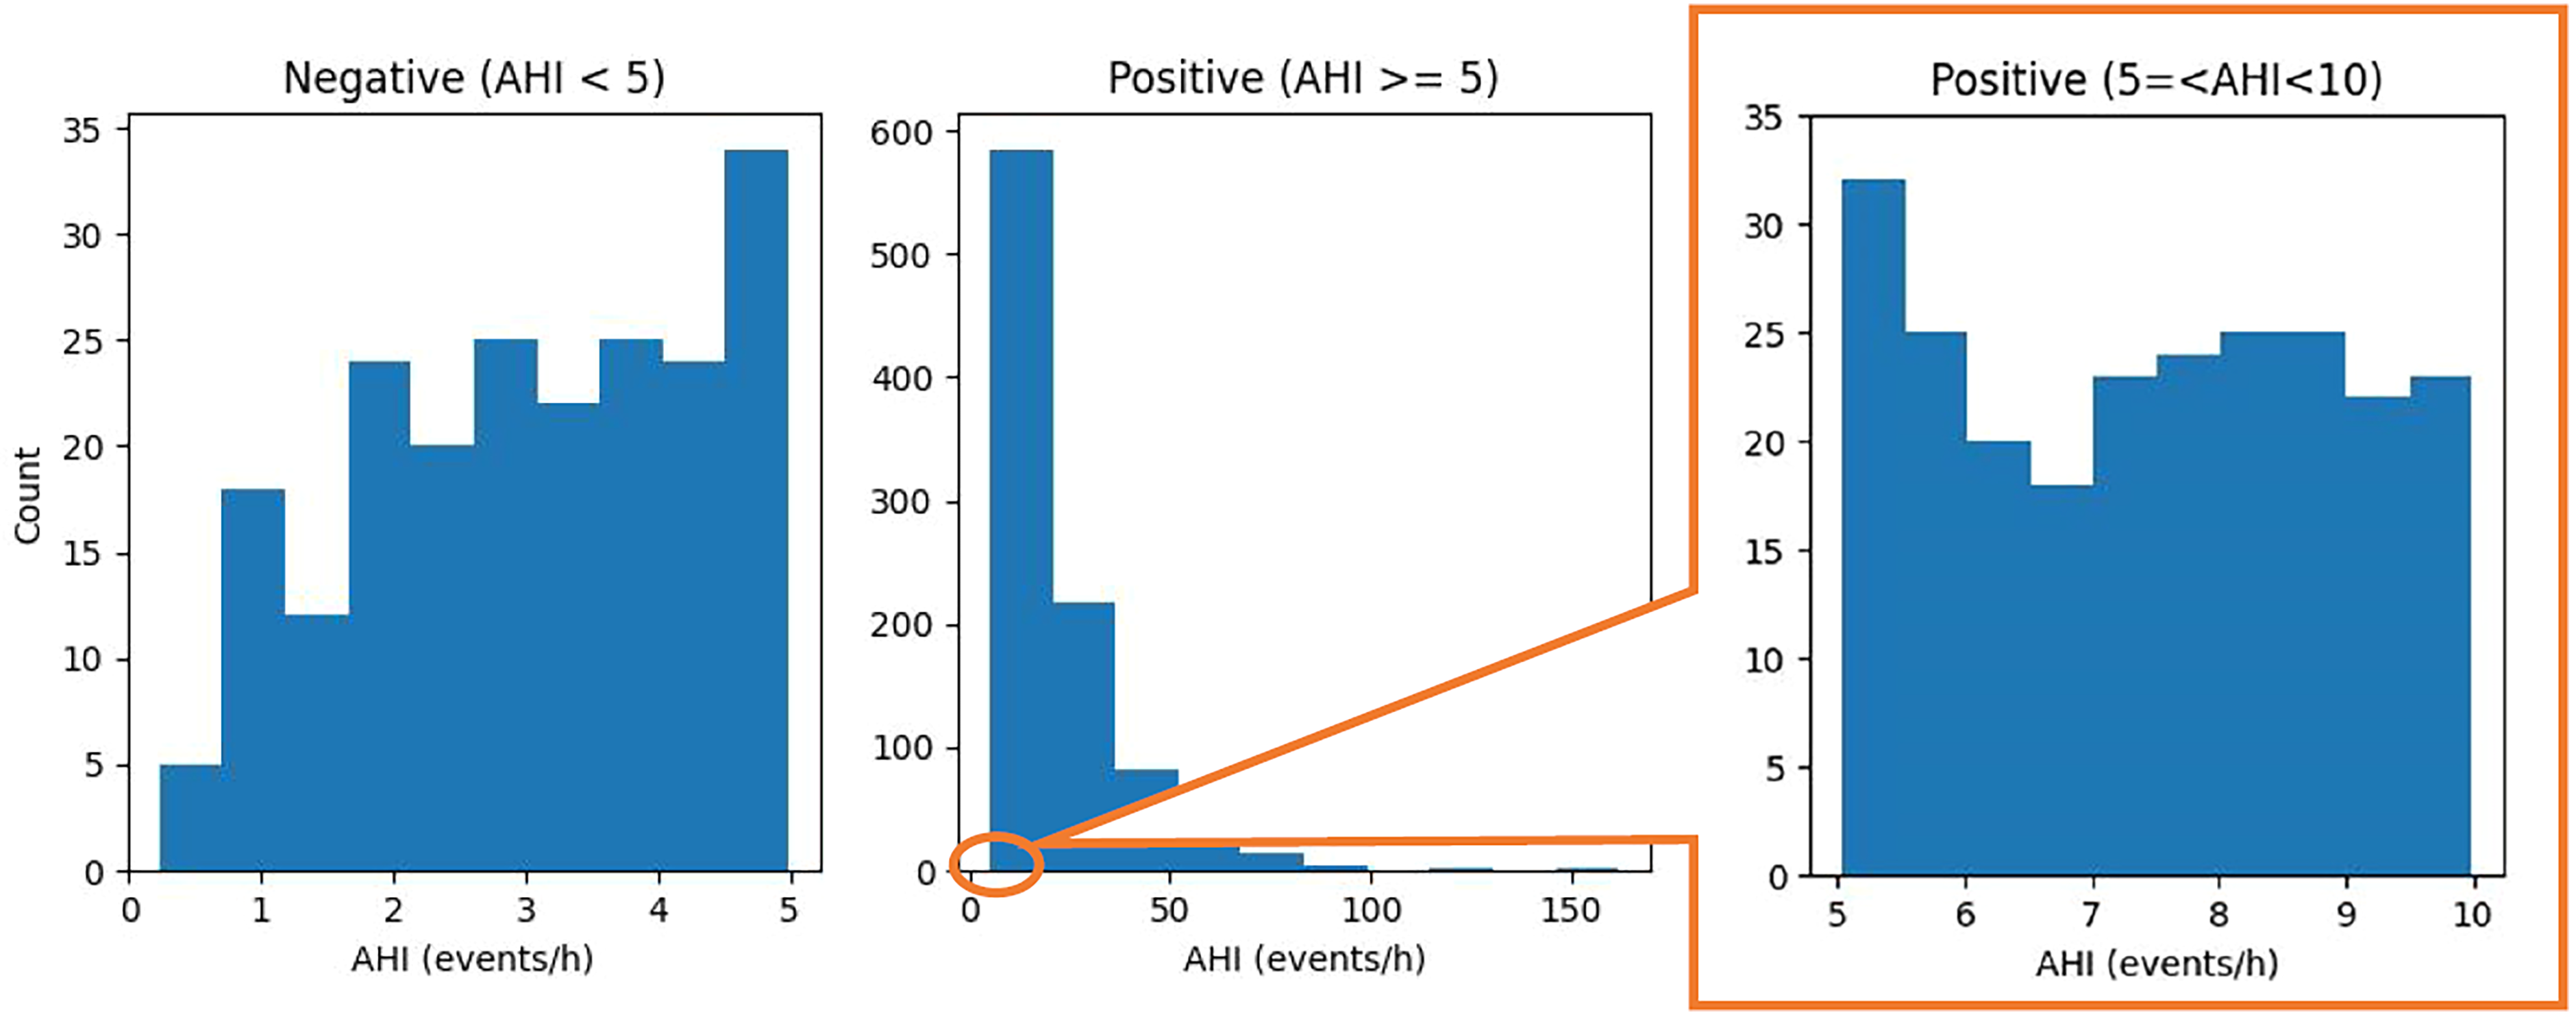
Distribution of apnea–hypopnea index (AHI) for the positive and negative groups (cutoff

Distribution of apnea–hypopnea index (AHI) for the positive and negative class at cutoff
We also observed that the LGMB models had distinct characteristics compared to the SVM and LR models. They were more effective in detecting the majority class, as indicated by the high SEN for cutoff
In addition to SEN and SPE, we evaluated the models using PPV and NPV—two relevant measures in clinical settings.48,49 In this evaluation dimension, the LGMB models achieved a better balance between PPV and NPV, especially for cutoff
Limitations
The present study has several limitations that are amenable to future investigations. First, the dataset used for model construction has a high prevalence of sleep apnea. The model performance, especially the measures that are heavily affected by disease prevalence including PPV and NPV, should be interpreted with caution and may not be generalized to other datasets. Second, we did not consider subtypes of sleep apnea and comorbidities in this study. Third, we did not use conventional time-domain and frequency-domain features that are commonly used in machine learning-based sleep apnea detection. Further studies may leverage those features to improve model performance.
Comparison with prior work
Many systems and algorithms have been developed for home sleep apnea screening, but most prior studies have only been validated on small samples (N = 3–481),
50
which threats the rigidity and generalizability of the developed models. To the best of our knowledge, there are only few studies that have validated their methods on a sufficiently large sample (N > 1000) and have used cutoff thresholds that permit direct comparisons with our models.9,12,8,51 The study that has validated their models on the largest sample so far (N = 17,448) used a different cutoff threshold of
Table 4 presents the comparison between our models and existing models for cutoff
Comparison to prior studies.
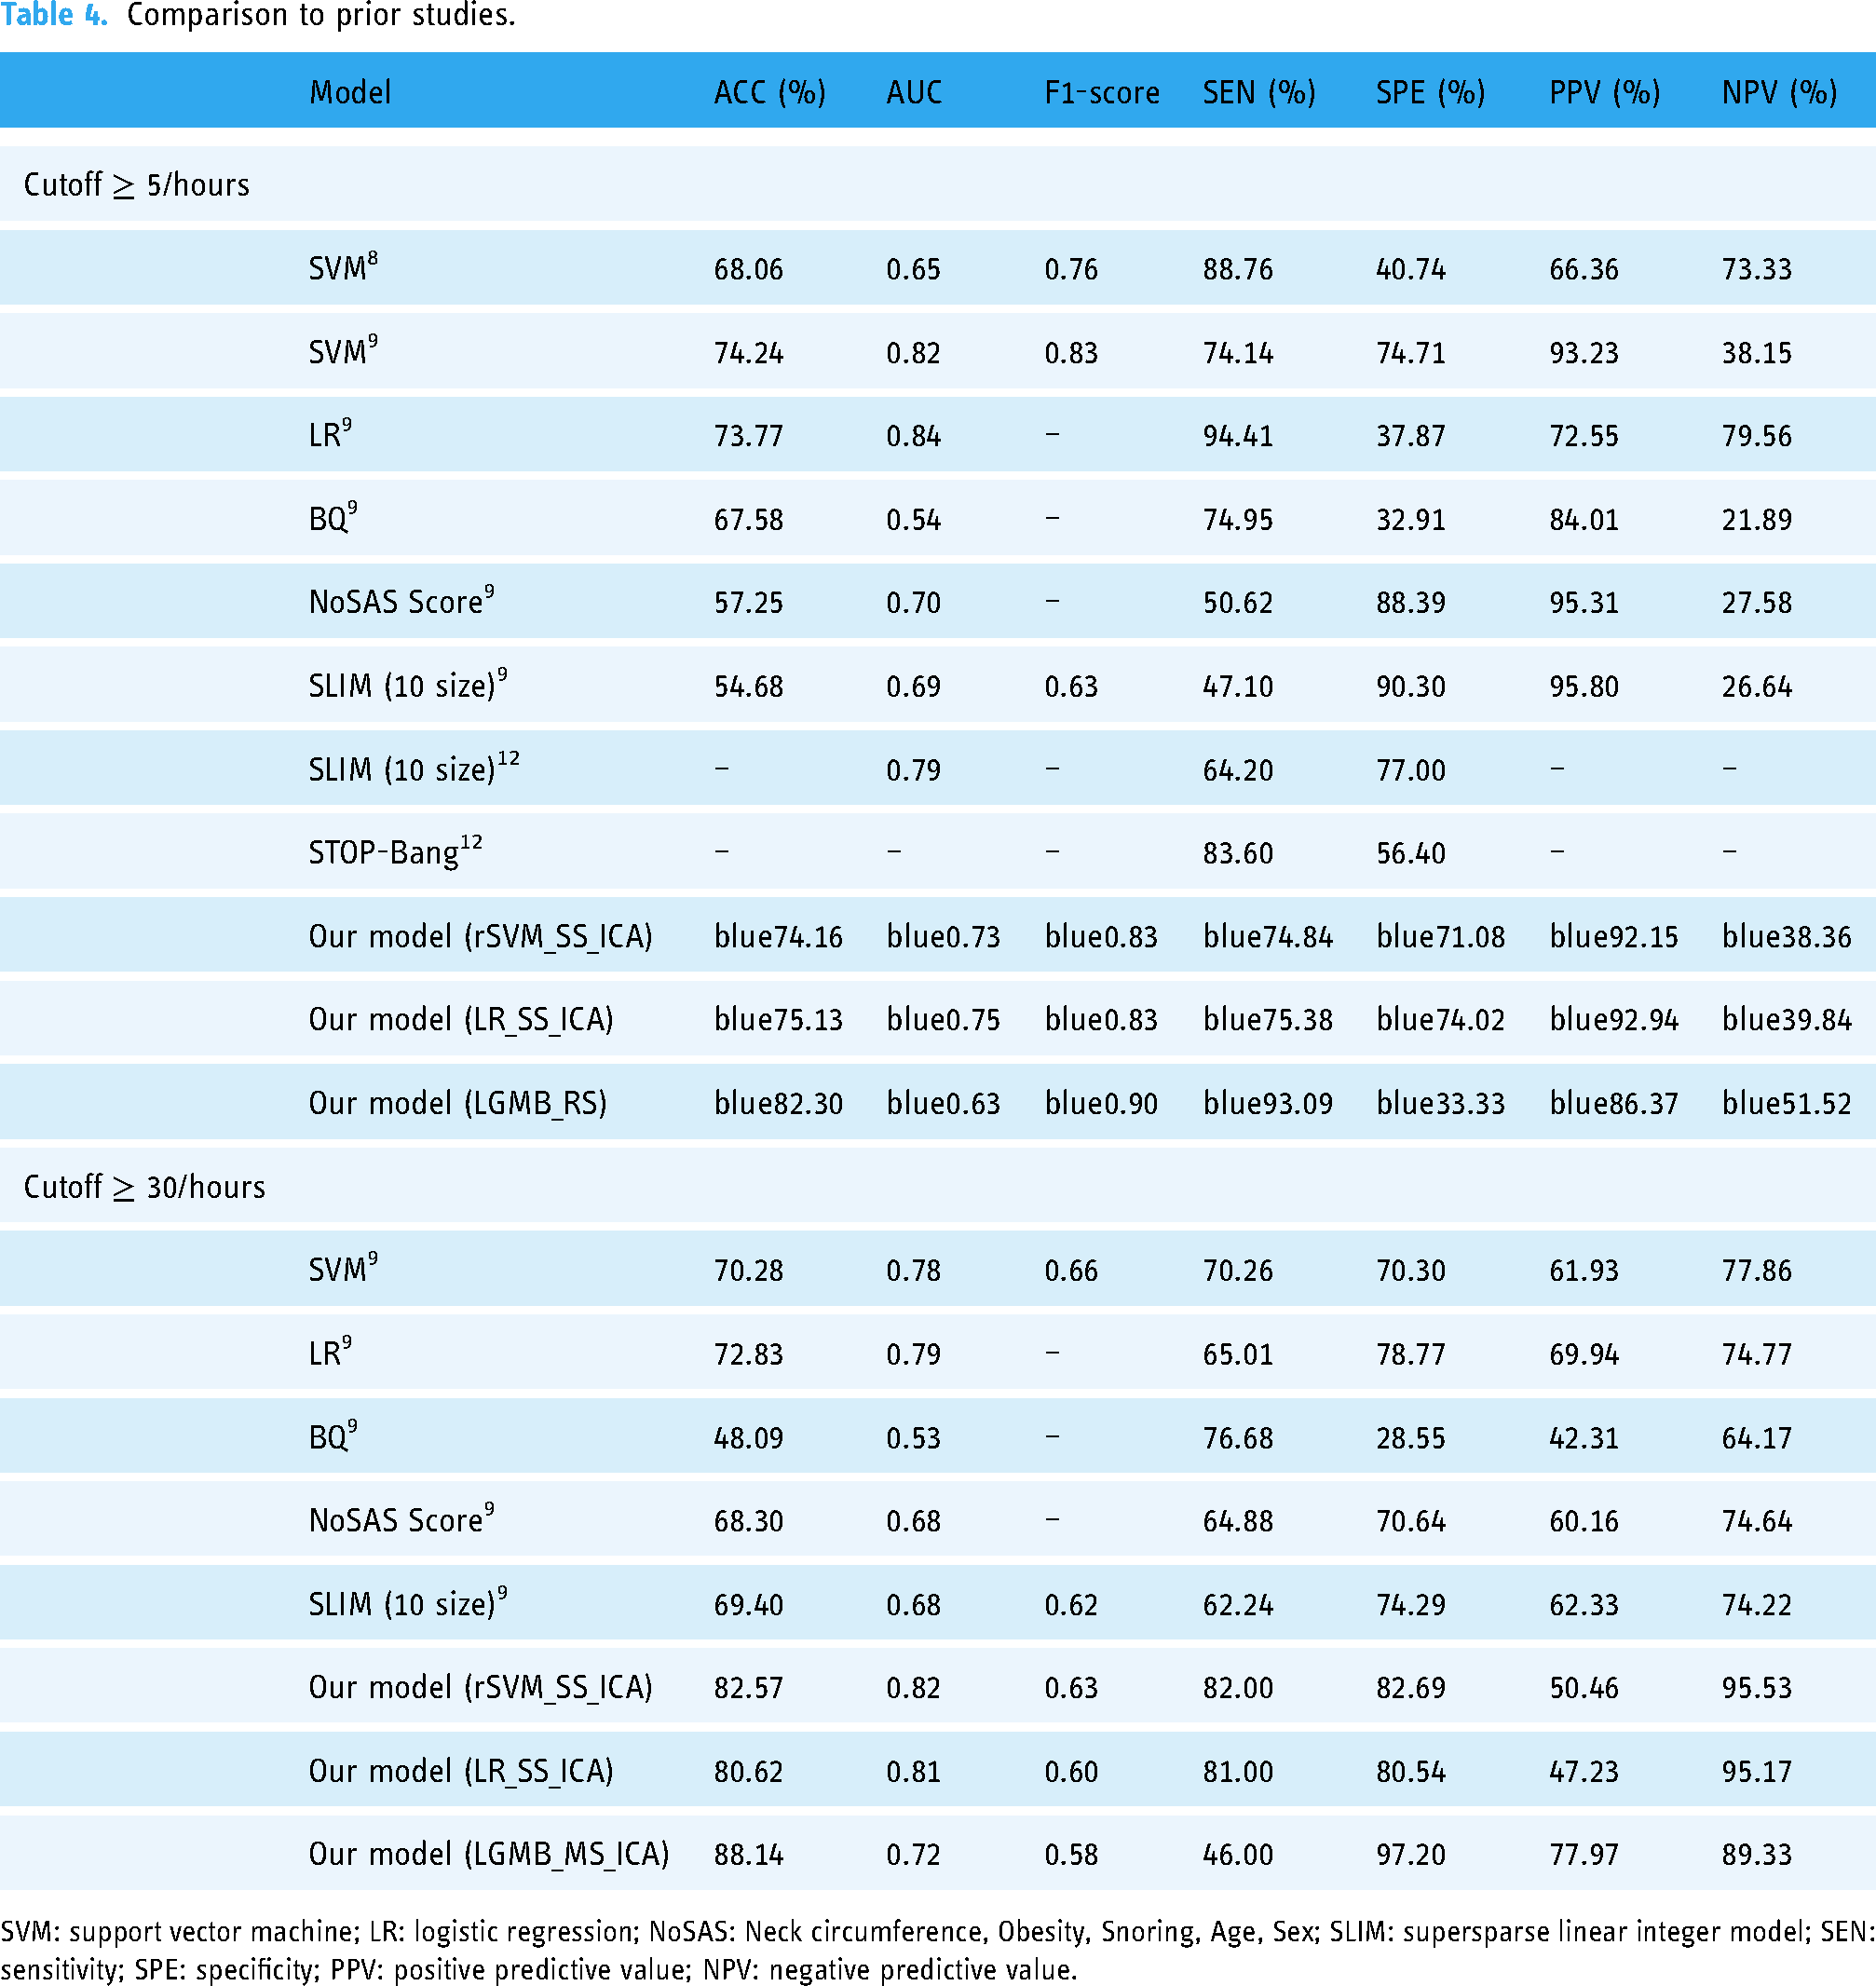
SVM: support vector machine; LR: logistic regression; NoSAS: Neck circumference, Obesity, Snoring, Age, Sex; SLIM: supersparse linear integer model; SEN: sensitivity; SPE: specificity; PPV: positive predictive value; NPV: negative predictive value.
Our method has several fundamental advantages over existing models. Compared to models that use traditional features, the MSAE features of overnight SpO2 are easier to obtain. EHR features such as medication records and blood test results are not always available, and questionnaire scores cannot be calculated from asymptomatic patients. Conventional time-domain, frequency-domain, and single-scale nonlinear features do not have satisfying discriminating power as indicated by the sub-optimal performance of prior shallow learning models. As shown in Figures 5 to 10, the fluctuation of the scaled attention entropy demonstrates the significant difference in the positive and negative groups at various time scales, which implies that the MSAE features are potentially powerful features for classification. In addition, this is the first study that investigates the MSE of the overnight SpO2 signals at a wide range of time scales. While prior studies on the MSE of physiological signals only used time scales lower than 1 minute, our study investigated a wide range of time scales between 1 seconds and 30 minutes. Our analysis found that the entropy at a longer time scale (1–15 minutes) could still be useful features for distinguishing apnea positive and negative. This is a new finding that no prior study had discovered. The advantage of our approach over deep learning models lies in its simplicity and better explainability. For one thing, shallow learning models such as ours do not require heavy computational and storage resources and can be easily applied to structured data. For another, our models have better explainability because the features used to develop the models have a physical meaning. In particular, the MSAE provides insights into how the complexity of the SpO2 signals changes at different time scales. Figures 5 to 10 show a loss of complexity for sleep apnea indicated by lower attention entropy values over a range of time scales.
Conclusions
In this study, we proposed a novel method for sleep apnea screening using only overnight SpO2 signals and simple demographic information. The method computes the attention entropy of the SpO2 signals for different time scale and uses these MSAE, together with age, sex, BMI, and blood pressure, as features to construct classification models that automatically detect positive cases for cutoff thresholds
Footnotes
Acknowledgements
The author would like to thank the National Sleep Research Resource for sharing the SHHS dataset.
Contributorship
ZL conceived of the presented idea, performed the computations, verified the analytical methods, interpreted the results, and wrote the final manuscript.
Declarations of conflicting interest
The author(s) declared no potential conflicts of interest with respect to the research, authorship, and/or publication of this article. The author(s) declare that they have no known competing financial interests or personal relationships that could have appeared to influence the work reported in this article.
Ethical approval
Ethics approval was obtained from the Ethics Review Board at Kyoto University of Advanced Science. Access to the SHHS database was granted by the National Sleep Research Resource.
Funding
The author(s) disclosed receipt of the following financial support for the research, authorship, and/or publication of this article: This study was supported by the JSPS KAKENHI Grant Number 21K17670.
Guarantor
ZL.