
Abstract
Objective
Polysomnography (PSG) is unique in diagnosing sleep disorders, notably obstructive sleep apnea (OSA). Despite its advantages, manual PSG data grading is time-consuming and laborious. Thus, this research evaluated a deep learning-based automated scoring system for respiratory events in sleep-disordered breathing patients.
Methods
A total of 1000 case PSG data were enrolled to develop a deep learning algorithm. Of the 1000 data, 700 were distributed for training, 200 for validation, and 100 for testing. The respiratory events scoring deep learning model is composed of five sequential layers: an initial layer of perceptrons, followed by three consecutive layers of long short-term memory cells, and ultimately, an additional two layers of perceptrons.
Results
The PSG data of 100 patients (simple snoring, mild, moderate, and severe OSA; n = 25 in each group) were selected for validation and testing of the deep learning model. The algorithm demonstrated high sensitivity (95% CI: 98.06–98.51) and specificity (95% CI: 95.46–97.79) across all OSA severities in detecting apnea/hypopnea events, compared to manual PSG analysis. The deep learning model's area under the curve values for predicting OSA in apnea-hypopnea index ≥ 5, 15, and 30 groups were 0.9402, 0.9388, and 0.9442, respectively, showing no significant differences between each group.
Conclusion
The deep learning algorithm employed in our study showed high accuracy in identifying apnea/hypopnea episodes and assessing the severity of OSA, suggesting the potential for enhancing both the efficiency and accuracy of automated respiratory event scoring in PSG through advanced deep learning techniques.
Keywords
Introduction
Obstructive Sleep Apnea (OSA) stands as a widely prevalent chronic disorder necessitating comprehensive, interdisciplinary management owing to its characteristic recurrent episodes of complete or partial upper airway obstructions during sleep.1–3 The pathophysiological ramifications of OSA, including sleep fragmentation, heightened sympathetic nervous system activity, hypoxemia, and hypercapnia, are intricately associated with the onset of OSA-related symptoms and complications.4–6 These manifestations range from excessive daytime sleepiness and morning headaches to severe outcomes such as hypertension, coronary artery disease, insulin resistance, stroke, and an increased risk of malignancies.7–11 Consequently, the prompt and accurate diagnosis of OSA is imperative when clinical suspicion arises.
Polysomnography (PSG), a cornerstone in the evaluation of sleep disorders, plays a pivotal role in diagnosing sleep disturbances by monitoring and recording an array of biological signals. Critical among these are the respiratory bio-signals; oral and nasal airflow, respiratory effort, snoring, and oxygen saturation signals, as well as the electroencephalogram (EEG), electrooculogram (EOG), electromyogram (EMG), electrocardiogram (ECG), body positions, which are all instrumental in identifying respiratory events during sleep. 12 Airflow measurements, utilizing oronasal thermal sensors and nasal pressure transducers, pinpoint respiratory disruptions including apneas and hypopneas. 13 Respiratory effort, gauged through chest and abdominal movements, helps differentiate between central, mixed, and obstructive respiratory disturbances. 14 Furthermore, oxygen saturation indices provide insights into blood oxygen levels, aiding in the detection of significant desaturations. 15 This comprehensive suite of data, manually scored by trained technicians and reviewed by sleep physicians, adheres to the American Academy of Sleep Medicine's guidelines. 16
OSA diagnosis aligns with the International Classification of Sleep Disorders, third edition, based on specific diagnostic criteria. 17 These include the manifestation of at least one symptom or comorbidity alongside a minimum of five obstructive respiratory events per hour of sleep, quantified as an Apnea-Hypopnea Index (AHI) of 5 or higher, or the presence of at least 15 obstructive events per hour irrespective of symptomatology. 17 The severity of OSA is further categorized by the AHI, with a threshold of 30 events per hour delineating severe OSA. 17
While PSG is invaluable in diagnosing various sleep disorders, the manual scoring of PSG data is labor-intensive and subject to inter-scorer variability, highlighting the need for a more streamlined approach. 16 Recent advancements in the detection and diagnosis of OSA emphasize the critical role of AI, particularly deep learning. 18 The automation of PSG data scoring, propelled by deep learning algorithms, has emerged as a field of intense research within medical informatics and sleep medicine.18–21 Recent reviews emphasize the need to bridge research findings with clinical applications, advocating for standardized management of OSA.22,23 Another study demonstrates the effectiveness of convolutional neural networks for OSA detection, promoting automation in diagnostics. 24 Further exploration into various AI methods suggests their integration into clinical settings, broadening the scope of diagnostic frameworks. 25 Innovations with a deep attention network that leverages multi-temporal data enhance detection accuracy and showcase the potential of AI to improve traditional diagnostics. 26
Although there have been recent papers that suggest and develop the use of AI technology to automatically score PSG-produced data.27–35 However, there is a crucial gap in the previous literatures; the number of investigations to accurately detect and score the severity of OSA are very limited to date, which the previous studies have only utilized deep learning models that were trained with only a limited number of biosignals, rather than including all essential respiratory-related biosignals recorded in the PSG.34,35 Therefore, our goal is to assess the effectiveness and precision of a newly developed deep learning algorithm intended for automated analysis of respiratory events to detect, and to categorize the severity of OSA in people with suspected sleep-disordered breathing.
Materials and methods
Ethical declaration
The research protocol of this study was reviewed and approved by the Institutional Review Board (IRB) of Soonchunhyang University Bucheon Hospital (Investigation number: SCHBC 2020-06-012). The research was conducted in accordance with the ethical principles outlined in the Declaration of Helsinki. The authors adhered to the directions provided by the IRB and executed the study under consistent supervision from the IRB. The IRB granted an exemption for informed consent since the present investigation was based on a validation study that used retrospectively gathered data devoid of personally identifying information.
Study subjects
The present work used a deep learning algorithm that was created using a dataset consisting of 1000 PSG records. These records were randomly picked from a larger database of adult patients who had undergone PSG between October 2017 and December 2019 at the clinic of the corresponding author. All patients who underwent PSG sought medical attention at a tertiary university hospital's otorhinolaryngology clinic, presenting symptoms such as excessive daytime drowsiness, snoring, or sleep apnea. Patients who did not have a complete overnight level I PSG, patients who had PSG at other clinics, and patients under 19 were excluded from the retrospective analysis.
Sleep-oriented history taking, physical examination, and level 1 PSG were conducted on all participants. The PSG was performed in a laboratory environment, with the presence of a technician, and included comprehensive monitoring of several physiological channels throughout the night. The PSG data, together with fundamental clinical data like the age, gender, and body mass index (BMI) of each participant, was acquired.
PSG and PSG-derived parameters
All individuals had a typical full-night level I PSG utilizing a computerized PSG system (Embla N7000; Natus Medical Inc., San Carlos, CA, USA). The PSG parameters included a six-channel EEG, a two-channel EOG, EMG recordings from the submental and leg muscles, measurements of airflow using a thermistor and pressure transducer, assessment of respiratory effort by monitoring chest and abdomen movement, measurement of oxygen saturation, detection of snoring, monitoring of body posture, and recording of the ECG. Throughout the entirety of the PSG procedure, a sleep technician who possessed the necessary certification continuously observed and assessed the signals of each participant. This involved manually scoring various aspects of the data, including respiratory events, arousals sleep stages, and other relevant information. The scoring process adhered to the guidelines outlined in The American Academy of Sleep Medicine Manual for the Scoring of Sleep and Associated Events: Rules, Terminology and Technical Specifications, version 2.6. 16 The PSG data that were evaluated manually underwent a comprehensive examination by the senior author (J.H.C), a sleep expert with several board certifications.
The concept of sleep efficiency has been defined as the proportion of the duration spent in a state of sleep (referred to as total sleep time) relative to the overall duration of time that was measured from the point of initiating sleep (referred to as lights out) to the point of awakening (referred to as lights on), including the whole recording period. Arousal is operationally defined as a sudden and distinct change in the frequency of the EEG, which persists for a minimum duration of three seconds, preceded by a period of at least ten seconds of steady sleep. In order to accurately assess arousals during stage R sleep, it is necessary to see a simultaneous increase in submental electromyogram activity that persists for a minimum duration of one second or longer. The arousal index was operationally defined as the ratio of the total number of arousals to the entire duration of sleep, expressed in hours. Apnea is operationally defined as an occurrence characterized by a reduction in amplitude of at least 90% and a duration of at least 10 s. The apnea index was operationally defined as the ratio of the total number of apneas to the entire duration of sleep, expressed in hours. Hypopnea is operationally defined as an occurrence characterized by a reduction in amplitude of at least 30% and a duration of at least 10 s, accompanied by a fall in oxygen saturation of at least 3% or an arousing event. The hypopnea Index is operationally defined as the ratio of the total number of hypopneas to the entire duration of sleep, expressed in hours. The apnea-hypopnea index (AHI) is a metric that quantifies the frequency of apnea and hypopnea events per hour of total sleep duration. The minimum SaO2 was operationally defined as the lowest recorded value of oxygen saturation throughout the sleep period.
Algorithm for automatic respiratory event scoring
In this investigation, we used SOMNUM, an AI diagnostic program developed by Honeynaps Co. Ltd in Seoul, Republic of Korea. This deep learning algorithm-based software was employed to automatically assess and rate sleep-related respiratory episodes in the sleep recordings of the patients included in our study. In order to identify instances of sleep apnea and hypopnea, input data consisting of nasal pressure, thermal flow, SpO2, chest belt, and abdominal belt signals were used.
To briefly describe details on data processing (e.g., noise filtering) and model tuning (e.g., hyperparameters turning and strategy), The use of a bandpass filter is employed as a means to eliminate extraneous external noise, as outlined in the previously mentioned Routinely Recorded Filter settings, as each hyperparameter value is further elaborated in Table 1.
The KNHIS database search criteria and processes for patients with each condition.
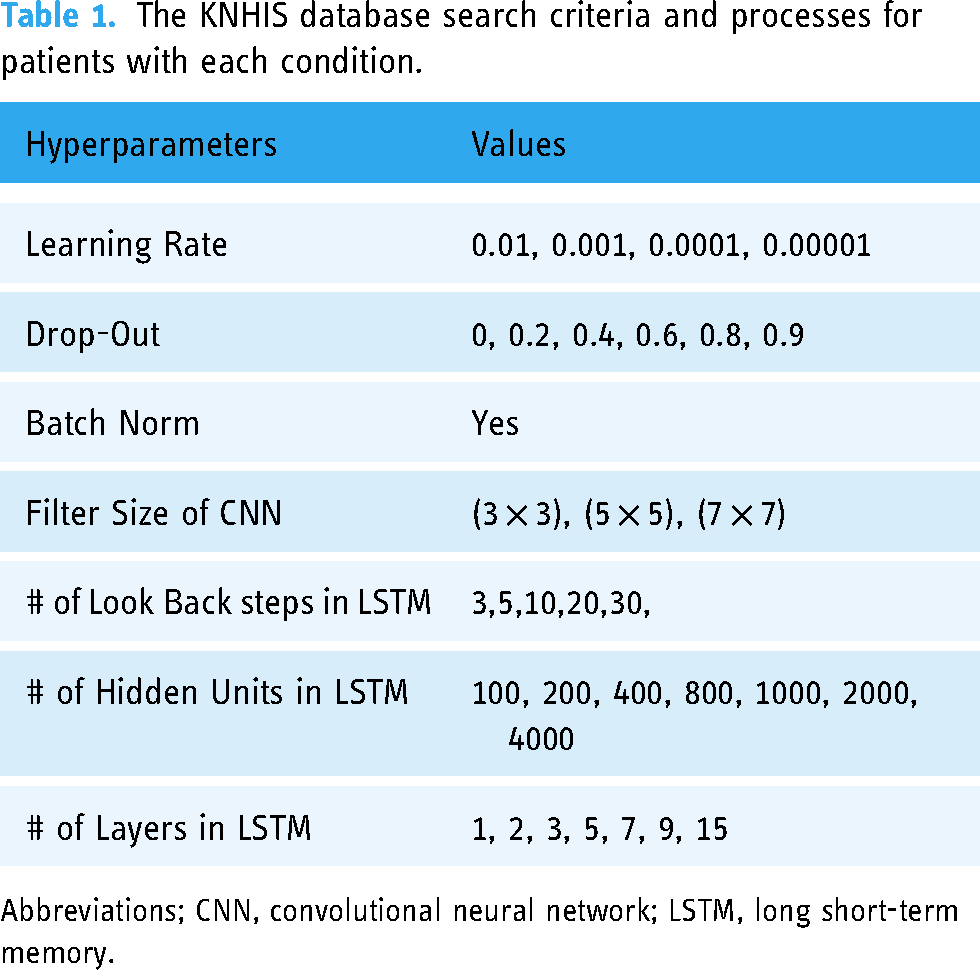
Abbreviations; CNN, convolutional neural network; LSTM, long short-term memory.
In order to construct a deep learning system, a total of 1000 case PSG data were used in the study. Out of the dataset consisting of 1000 data sets, 700 data sets were designated for training purposes, while 200 data sets were allotted for validation. Additionally, 100 data sets were set aside for both validation and testing. In detail, the study sample was selected as follows. Initially, a random sample of 1000 patients was selected and classified based on their AHI scores. Subsequently, a random selection of 25 patients was made from each of the four groups. The reason for selecting the proposed deep learning model randomly in two stages is to compare its performance based on the AHI index.
The selection of the deep neural network (DNN) architecture was informed by a multi-faceted approach. Initially, a review of architectures previously successful in related studies was conducted to guide the selection process. Subsequently, several candidate architectures were identified, taking into account the unique characteristics of our dataset and the inherent complexity of the problem. These candidates were then subjected to a rigorous evaluation using cross-validation techniques to assess their performance and computational efficiency. The architecture that demonstrated superior performance across these criteria was ultimately selected for implementation in our study.
The deep learning model construction framework used in this study was PyTorch 1.5, while the monitoring of deep learning training was carried out using TensorBoard. Briefly, the architecture of the respiratory event scoring model has five layers, namely, an initial layer of perceptrons, followed by three sequential layers of long short-term memory (LSTM) cells, and ultimately, two further layers of perceptrons. The first layer of perceptrons is comprised of individual perceptrons that produce a linear combination of all the characteristics. In an LSTM layer, there are N cells, with N/2 cells propagating their internal values in the forward direction to subsequent epochs, while the remaining cells propagate values in the reverse way. Ultimately, the N values generated from the final LSTM layer undergo processing via a perceptron layer consisting of N/2 neurons. Subsequently, these values are further processed by a final layer of two neurons, each corresponding to the probabilities of respiratory event classes. The activation functions used in the study were mostly sigmoid, except for the last layer, which utilized a softmax activation function. The Deep learning models we have adopted are composed of DCNN for down sampling layer and feature extraction, in addition to the Skip LSTM for classifier (Figure 1).

Architectural diagram of the deep learning models used in the current investigation; DCNN for down sampling layer, DCNN for feature extraction, and skip LSTM classifier.
Statistical analysis
Four groups were stratified based on the degree of OSA, which was determined by the AHI derived from manually-scored PSG data. These groups were the severe OSA group (AHI ≥ 30), moderate OSA group (30 > AHI ≥ 15), mild OSA group (15 > AHI ≥ 5), and simple (primary) snoring group (AHI < 5). A comprehensive analysis of the clinical, demographic data and PSG-derived parameters was conducted and afterward given for each of the four groups. An analysis of variance (ANOVA) test was conducted, followed by a Bonferroni post-hoc test, in order to examine the notable disparities in demographic and PSG data among four distinct groups (Supplementary Table 1).
The manually assessed respiratory event figures were regarded as the “benchmark” or “reference standard”. The analysis focused on comparing the scoring of respiratory events, namely apnea or hypopnea events occurring within a 30-s epoch, between the deep learning algorithm-based AI diagnostic software (referred to as SOMNUM) and the human-scored PSG report. The accuracy of identifying apnea or hypopnea episodes was assessed based on the stratification of OSA severity into four groups. The study categorized participants into four groups based on the severity of OSA: severe OSA (AHI ≥ 30), moderate OSA (30 > AHI ≥ 15), mild OSA (15 > AHI ≥ 5), and simple (primary) snoring (AHI < 5). The researchers compared the sensitivity and specificity of the deep learning-based model with the manually scored outcome within each group. The sensitivity and specificity were used to compute a receiver operating characteristic (ROC) curve and determine the area under the curve (AUC). This was done to assess the concordance between the automated scoring results for respiratory events and the human scoring results. In order to assess the statistical significance of the variations in diagnostic accuracy metrics, the researchers used a McNemar test. The study reported the median values of sensitivity and specificity, together with their corresponding 95% confidence intervals (CI).
The statistical analyses were conducted using R version 3.6.3 (The R Foundation for Statistical Computing, Vienna, Austria) and SPSS Statistics version 26.0 (IBM Corp., Armonk, NY, USA). A significance level of p less than 0.05 was used to determine statistical significance.
Results
In the process of developing a deep learning AI model, a dataset consisting of 1000 patients’ PSG records was used. Out of these, PSG data from 692 patients were employed for training the algorithm model, while PSG data from 200 patients were reserved for validation purposes. Additionally, PSG data from 100 patients were specifically utilized for validation tests. At the outset, the algorithm model training was intended to use PSG data from 700 patients. However, eight participants were subsequently omitted from the training dataset due to insufficient PSG data. The PSG data from three individuals was eliminated owing to the inability to identify breathing movements and respiratory signals caused by patient movements. Additionally, the PSG data from five patients were excluded because there was no recorded data during some periods as a result of unstable sensor connections.
In our investigation, a sample size of 100 participants was included for the purpose of validation and testing. The participants had a mean age of 50.59 years with a standard deviation (SD) of 14.01 years (Table 2). Out of the total participants, 55 were males and 45 were women. The participants also had a mean BMI of 26.30 kg/m2 with a SD of 3.98 kg/m2. The validation and assessment of PSG data included a sample of 100 individuals. This sample was divided into four groups: simple (primary) snoring (n = 25), mild OSA (n = 25), moderate OSA (n = 25), and severe OSA (n = 25). No notable variations were seen in the gender distribution among the four groups stratified based on the severity of OSA. However, a notable difference was observed in age and BMI, indicating that as the severity of OSA rises, there is a corresponding increase in age and BMI (Table 1). The PSG parameters were assessed for sleep efficiency (%), arousal index (events/hour), AHI (events/hour), and minimal SaO2 (%), yielding mean ± SD values of 83.32 ± 11.34, 25.67 ± 15.53, 22.26 ± 22.80, and 84.31 ± 7.87, respectively. Despite the absence of notable variations in sleep efficiency among the four subgroups, a noteworthy disparity in the characteristics associated with OSA was detected. This discrepancy was evident in terms of heightened arousal levels and the occurrence of apnea or hypopnea episodes, with all p-values being less than 0.001.
Demographics of OSA patients and controls.

Data are presented as mean ± standard deviation. * p-value calculated with analysis of variance followed by Bonferroni post-hoc test. p < 0.05 was considered as statistically significant. Abbreviations; AHI: apnea-hypopnea index, OSA: obstructive sleep apnea, M: male, F: female, BMI: body mass index, SaO2: arterial oxygen saturation, NS: non- significant.
The study demonstrated the efficacy of the deep learning algorithm used in our research for categorizing the severity of OSA and distinguishing the PSG data of patients with main snoring exclusively. The performance metrics, sensitivity and specificity, are shown in Figure 2. The sensitivity of simple snoring, mild OSA, moderate OSA, and severe OSA were 98.06 (95% CI 96.64–99.53), 98.12 (95% CI 96.68–99.87), 98.23 (95% CI 96.75–99.72), and 98.51 (95% CI 96.2–95.91), respectively. The study found that the specificity (95% CI) for simple snoring, mild OSA, moderate OSA, and severe OSA were 97.79 (92.84–99.95), 96.84 (93.6–99.95), 96.7 (93.32–99.59), and 95.46 (93.71–99.08), respectively.
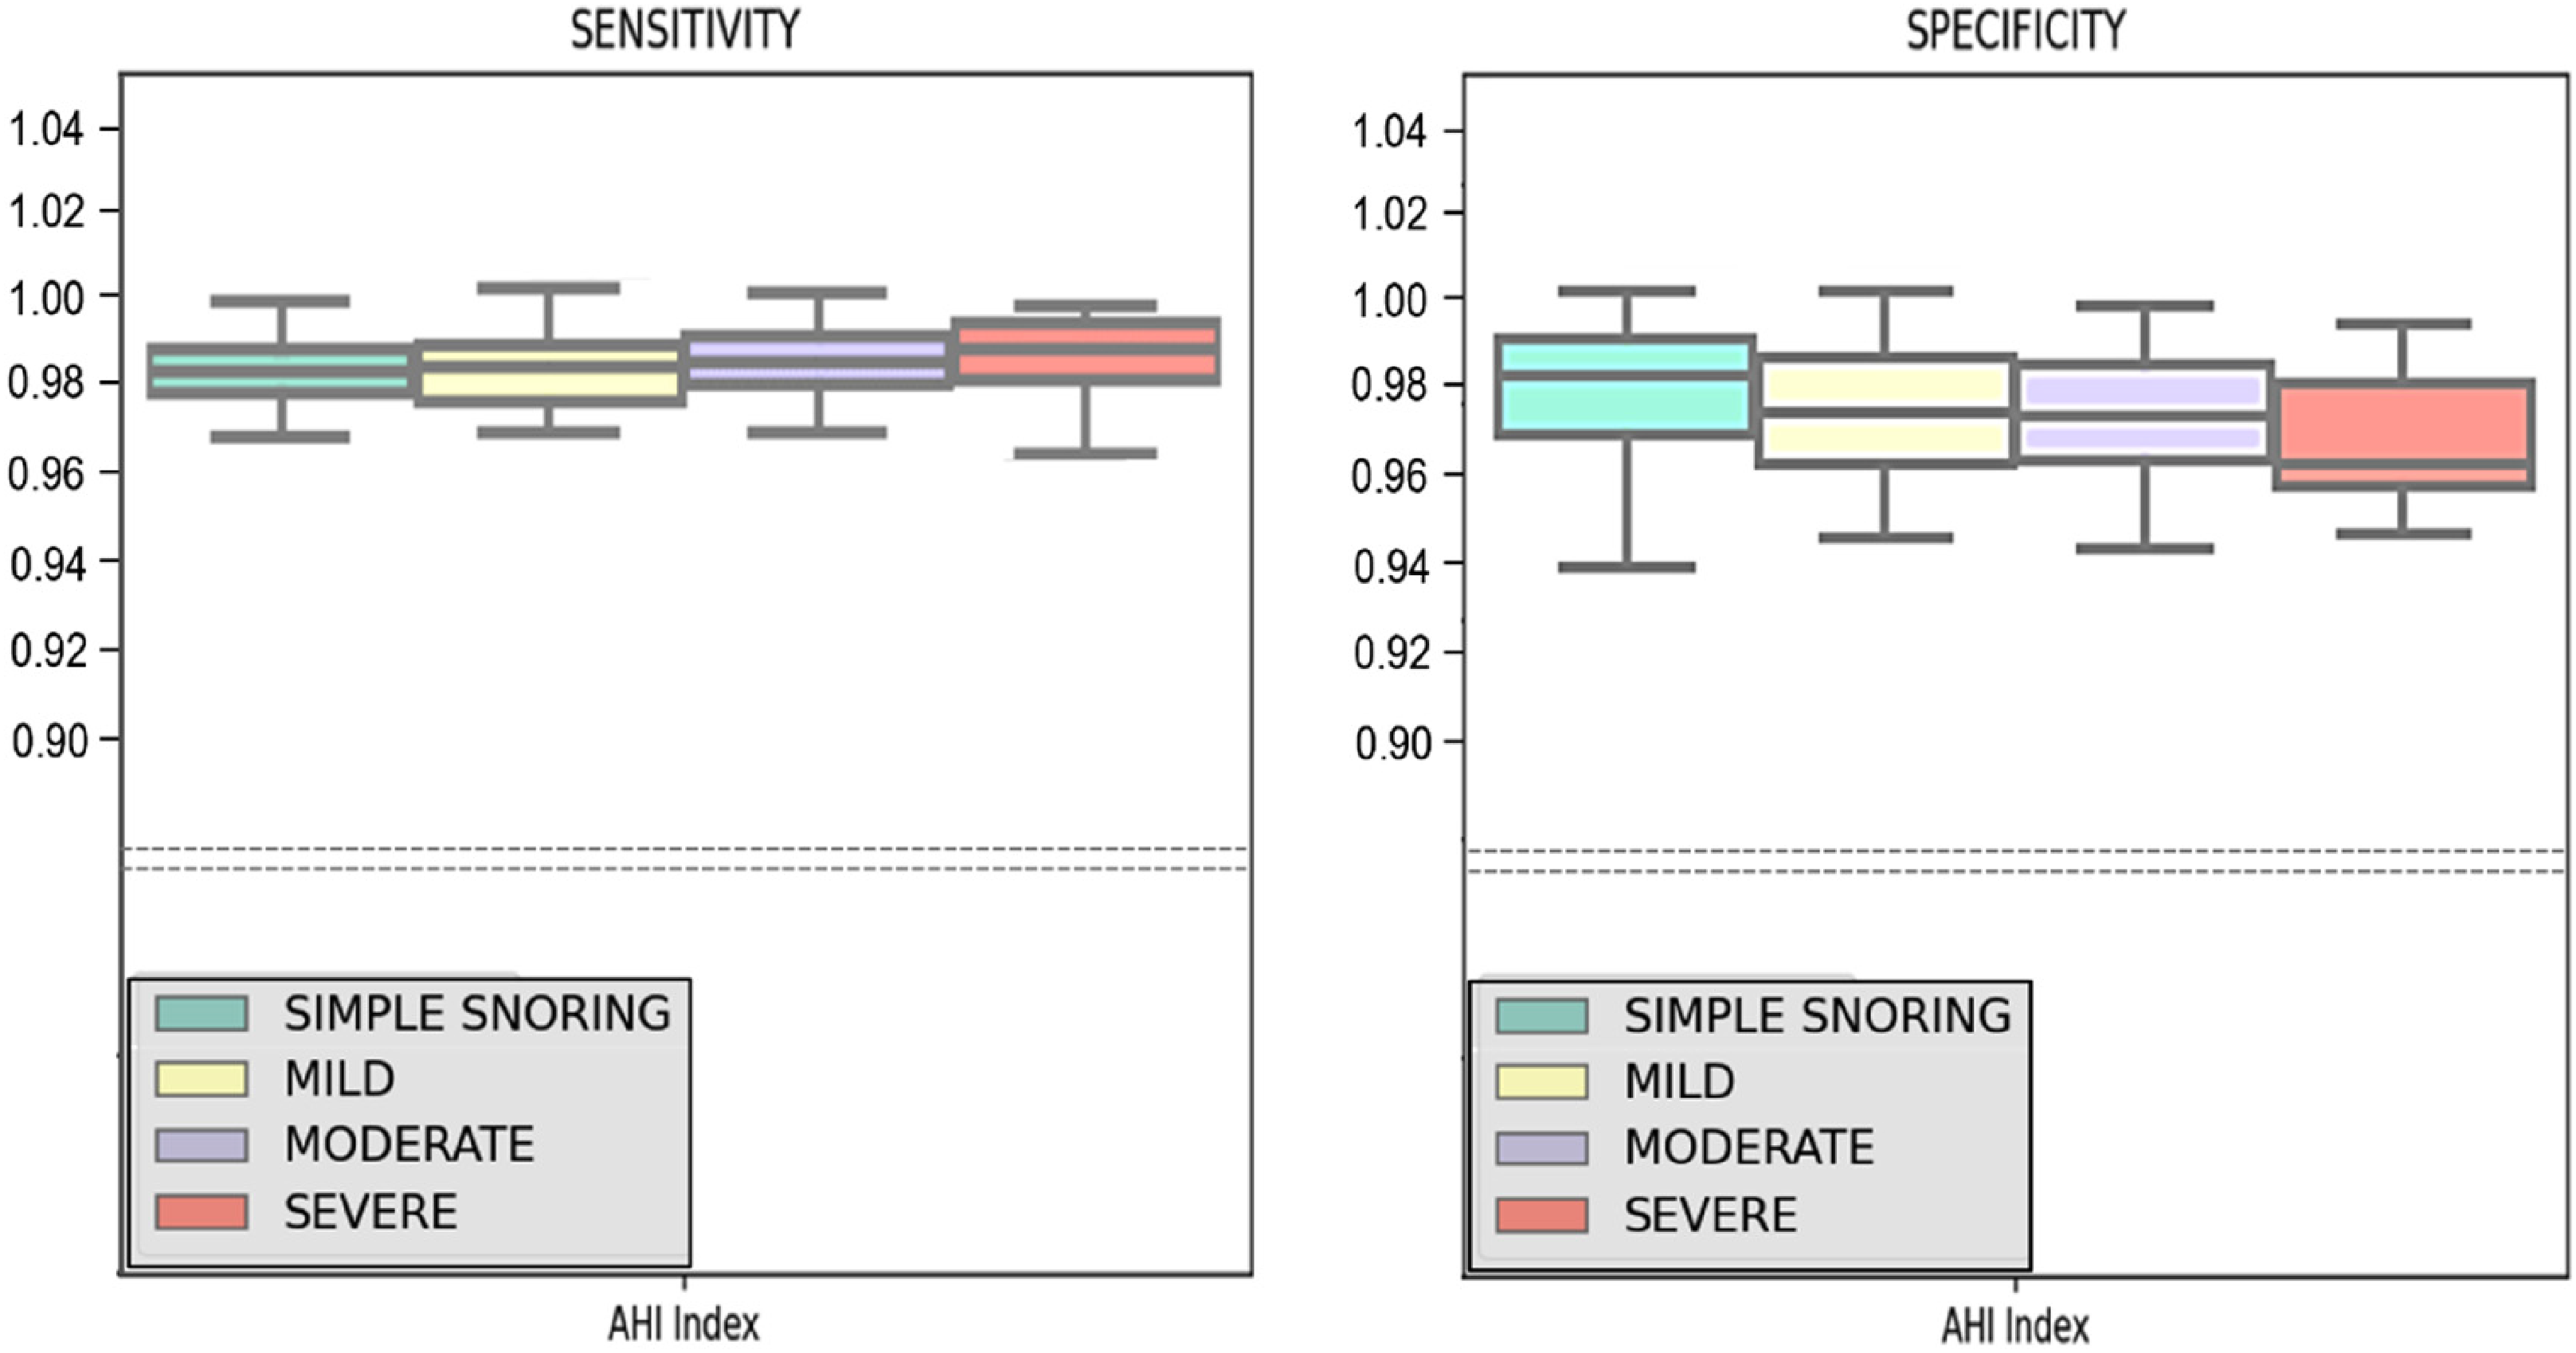
The sensitivity and specificity of the deep learning algorithm model to correctly score the respiratory-related events in the polysomnography (PSG) of patients in main snoring, mild, moderate, and serious obstructive sleep apnea (OSA).
The study used a deep learning algorithm to accurately detect the occurrence of apnea or hypopnea. The researchers presented ROC curves to illustrate the performance of the system in relation to the severity of the AHI, as shown in Figure 3. Furthermore, the AUC in the ROC curve serves as a measure of the ability of a deep learning algorithm to accurately distinguish between individuals with OSA and those without. In this study, the AUC values for predicting OSA in groups with AHI values greater than or equal to 5, 15, and 30 were reported as 0.9402, 0.9388, and 0.9442, respectively (Figure 3). There were no statistically significant differences seen among the three AUC values, as shown by all p-values being more than 0.05. Hence, irrespective of the extent of OSA as indicated by the AHI, our research demonstrated that the deep learning model used had a discerning capability to identify the existence of each OSA severity level with an accuracy above 93%.

Area under the receiver operating characteristic (ROC) curve of a deep learning algorithm model for predicting obstructive sleep apnea (OSA).
Figure 4 presents the Bland-Altman plot illustrating the comparison between the automated scoring of AHI using the deep learning algorithm and the human assessment of AHI using PSG. The Bland-Altman analysis is used to measure the level of concordance between two evaluation methods, namely in our research, the deep-learning model derived automatically scored PSG results and the humanly evaluated PSG data. A graphical representation of the disparities between the outcomes obtained via deep learning-based automated scoring and those obtained through manual scoring is illustrated in Figure 4. The y-axis represents the plot of these discrepancies, while the x-axis represents the mean values of the deep learning-based automatic scoring results and the humanly scored results. The diagnostic bias between the two modalities was quantified by an AHI of 1.66 per hour, with a mean difference of −1.66. The limits of agreement demonstrated a narrow range of −3.70 to 0.36, indicating a substantial level of concordance between the deep learning models and manually scored PSG data in identifying sleep-related breathing events and associated disorders.

Bland-Altman plot of apnea-hypopnea index (AHI) analyzed between a deep learning algorithm (automated scoring) and polysomnography (PSG) (manual scoring).
Discussion
Sleep apnea and main snoring are often seen as sleep-breathing problems in the clinical practice of sleep medicine.22,23 Despite the availability of several screening and diagnostic methods for identifying and evaluating sleep disorders and sleep-related breathing problems, in-laboratory PSG is widely acknowledged as a well-validated and influential diagnostic tool.23,36 The PSG is a comprehensive diagnostic tool used to detect and assess various sleep disorders. 37 It involves the collection of multiple bio-signals from an individual during sleep, including breathing and ventilation, hypoxia, sleep staging assessments, cardiac rhythm and rate assessments, peripheral limb movements, motion detection during sleep, and vocalization or snoring assessments. 37 By incorporating all these measurements into a single test, the PSG allows for the identification and evaluation of numerous sleep disorder conditions. Therefore, PSG is now used and implemented in many sleep medicine labs.22,38
Nonetheless, the process of analyzing and interpreting the unprocessed PSG data requires a substantial amount of manual effort and may be a time-intensive task. The raw PSG data comprises sequentially recorded biosignals from various channels connected to a patient for either the whole sleep duration or a significant percentage of the total sleep period, often exceeding 4 h. 39 Furthermore, the examination of the unprocessed PSG data needs the expertise of a trained specialist proficient in scoring and interpreting such raw PSG data. 19 It is important to acknowledge that the interpretation of these raw data findings may be subject to potential biases arising from inter-observer and intra-observer variations. 33 Therefore, the utilization of an automated logic or software device with a high level of accuracy and precision in scoring and interpreting raw PSG data could potentially offer significant advantages in addressing the primary challenges associated with manual scoring conducted by a proficient PSG specialist, as previously discussed.
The advancements in AI technology in many sectors of society have facilitated a decrease in the need for human labor while simultaneously guaranteeing precise and reliable execution of designated duties. 40 Extensive research is now being conducted in medicine and medical informatics about the automated scoring of human bio-signal data.31,41–44 The present study is being undertaken by researchers from several medical specialties. With the increasing prevalence of OSA worldwide and the growing recognition of its substantial impact on various cardiovascular comorbidities, there is a growing need among doctors and healthcare workers for an effective approach to screen and diagnose OSA.11,25 Consequently, there is growing interest and demand for PSG and home-based polygraphy. 38 However, the significant quantity of human effort and time required presents a challenge in adopting these diagnostic modalities as useful tools for diagnosis or screening. 24 The authors aimed to assess the accuracy and precision of a newly developed deep learning system in scoring respiratory episodes in individuals with sleep breathing disorders. The system's primary function was to detect the presence and determine the severity of sleep apneas, as well as differentiate patients with OSA from those with simple snoring. Despite the availability of more accessible and time-efficient equipment such as pulse oximeters or ECGs, PSG continues to be widely regarded as a standard diagnostic approach for identifying and categorizing severe OSA, as well as detecting other sleep disorders. 45
Recent reviews and studies highlight the expanding role of AI in diagnosing and understanding OSA, which are detailed in Table 3..26,46–54 Research emphasizes the need for bridging gaps between clinical practices and new knowledge in sleep-disordered breathing, while also offering a standardized framework for OSA management that reflects an international consensus.22,23 Advances in AI are promising, detailing how convolutional neural networks can be optimized for detecting OSA and reviewing broader AI applications in sleep apnea diagnosis, discussing both potentials and challenges.24,25,45 Further advancements introduce a multi-scale object detection approach for precise localization of apnea events in polysomnography, showcasing the enhancement of diagnostic accuracy, and exploring deep learning techniques that adapt across different patient datasets and utilize respiratory signals, marking significant improvements in predictive accuracy and clinical utility.47,48,50 These developments indicate a trend towards more sophisticated, data-driven approaches in the diagnosis and management of sleep apnea, potentially leading to more personalized and efficient patient care.
Comparative overview of most-recent AI-based methods for PSG scoring and diagnosis of sleep apnea.

Abbreviations; AUC, Area Under the Curve; CNN, Convolutional Neural Network; CSA, Central Sleep Apnea; CWT, Continuous Wavelet Transform; DNN, Deep Neural Network; ECG, Electrocardiogram; EMD, Empirical Mode Decomposition; GRU, Gated Recurrent Unit; HT, Heart Timing; LSTM, Long Short-Term Memory; LSTM-CNN, Long Short-Term Memory-Convolutional Neural Network; OSA, Obstructive Sleep Apnea; PSG, Polysomnography; RNN: Recurrent Neural Network; SVM: Support Vector Machine.
The proposal has been put up to use AI technology for the automated evaluation of data produced by PSG, aligning with this idea.24,25,45 Several recent scientific papers have focused on examining and documenting the diagnostic accuracy and validity of the issue being investigated.26,34,35,47,48,50,55 In their studies, Nikkonen et al. observed a rate of agreement between their artificial convoluted neural network and manual scoring, which was found to be 88.9% on an epoch-wise basis. 35 In a similar vein, Pittman and colleagues demonstrated a concordance rate of 94.9% between their automated scoring method and the humanly assessed findings obtained from PSG. 55 In particular, the assessment of respiratory episodes in Nikkonen et al.'s research demonstrated a notable level of agreement, with a concordance rate of 93.9% and a kappa coefficient of 0.92. 35 In addition, the neural network exhibited a significant level of concordance in detecting AHI, apnea, and hypopnea events, as shown by an intraclass correlation value of 0.985 (95% CI 0.978–0.990) for AHI, 0.971 (95% CI 0.955–0.981) for apnea, and 0.966 (95% CI 0.943–0.979) for hypopnea. 35 The Bland-Altman plot revealed that the error magnitude for AHI was 3.0 events per hour, for apnea was 2.0 events per hour, and for hypopnea was 2.9 events per hour. 35 These findings collectively indicate a high level of agreement and a minimal degree of error in the algorithms developed for automated scoring of respiratory events in PSG. Similarly, the magnitude of inaccuracy in the AHI observed in our investigation exhibited a value of 1.66 per hour, which demonstrated a little decrease compared to the findings reported in their study.
In our study, we observed the accuracy of an automatic-respiratory events scoring software employing a deep learning algorithm, which demonstrated a notable level of validity compared to manually scored PSG data. This validity was evident in accurately identifying sleep apneas, distinguishing adult patients with OSA from those with simple snoring and evaluating the severity of OSA. Irrespective of the degree of OSA as indicated by the AHI, both sensitivity and specificity have shown a value over 96% in properly assessing the occurrences of respiratory episodes during sleep. The results of this investigation show some degree of similarity and divergence when compared to the research conducted by Nikkonen et al.. 35 The findings of the study demonstrated that the severe OSA group exhibited the greatest detection accuracy, with a score of 92.3% for AHI. In comparison, the moderate and mild OSA groups achieved accuracies of 81.5% and 81.0%, respectively. 30 Nevertheless, the non-OSA group had a high accuracy rate comparable to the severe OSA group, with a rate of 92.3%. 30 In contrast, our research found that our deep learning algorithm model has greater sensitivity in persons with severe OSA and higher specificity in the simple snoring (non-OSA) group. This suggests that the deep learning algorithm employed in our study exhibited a stronger ability to differentiate severe OSA cases and accurately identify those without OSA. Moreover, the AUC value in the ROC curve values ranging from 93% to 94% in our research, independent of the AHI, provides an accuracy validation for the algorithm's acceptable performance, compared with previously created deep-learning based algorithms employed in prior literatures.35,55,56
The findings of this work have the potential to enhance the precision and practical implementation of the deep learning algorithm in automatically assessing respiratory episodes, therefore enabling the detection and classification of the severity of OSA using raw PSG data. Despite the relatively high sensitivity, specificity, and diagnostic accuracy shown in this study for accurately scoring sleep-related apneas and hypopnea episodes, the authors acknowledge several limits and shortcomings in our research. Initially, the deep learning system was taught using the raw PSG data of 1000 people, with a subset allocated for validation and validation testing. While the dataset consisting of 1000 patients’ PSG data is rather large, it is necessary to enhance the characteristics associated with the accuracy of apnea and hypopnea detection by using a greater number of raw PSG data inputs during the training of an algorithmic model. Furthermore, it is worth noting that the distribution of male and female participants in our study was generally balanced. However, after examining the raw PSG data of adult patients, we saw that the average age was 50 years, with the majority falling within the range of 40 to 55 years. The study's findings are limited due to the lack of age variety in our PSG raw sample, since the rising incidence of sleep apnea among both senior patients and younger patients aged 20 to 40 is not well represented. Furthermore, the research design did not include PSG data from children. The occurrence of OSA in children is often attributed to the growth of tonsillar and adenoid structures throughout childhood. However, it is important to note that the diagnostic criteria and features of apneas or hypopnea events in children vary from those seen in adults, since the underlying pathophysiology exhibits variations between the two age groups.
Therefore, it would be a compelling area of research to explore the development of a deep learning model for automated scoring, with the aim of identifying and diagnosing OSA in pediatric patients. In conclusion, it should be noted that our research included all 1000 patients who had PSG and were ultimately diagnosed with either OSA or primary snoring. However, it is important to acknowledge that our study did not specifically exclude individuals who may have had overlapping central sleep apnea (CSA) or mixed sleep apnea, whereby OSA episodes occur subsequent to the onset of CSA. Despite the potential benefits of identifying CSA or mixed apneas, we were unable to address this issue in our research owing to its complexity. Furthermore, it would enhance the validation of our results to test the current model using an open PSG dataset, allowing us to more accurately assess its sensitivity and specificity. Additional examination of a larger number of patient cohorts and various biosignal inputs is necessary to construct an algorithm model capable of determining the existence of these apnea types. Hence, the authors propose that this issue should be addressed in the next investigation.
Conclusion
The deep learning algorithm used in our study demonstrated a significant level of precision in identifying apnea/hypopnea occurrences and then classifying the severity of OSA. The results of our investigation possess the capacity to improve the applicability and accuracy of deep learning algorithms used for the automated assessment of respiratory events in PSG.
Supplemental Material
sj-docx-1-dhj-10.1177_20552076241291707 - Supplemental material for A deep learning algorithm model to automatically score and grade obstructive sleep apnea in adult polysomnography
Supplemental material, sj-docx-1-dhj-10.1177_20552076241291707 for A deep learning algorithm model to automatically score and grade obstructive sleep apnea in adult polysomnography by Marn Joon Park, Ji Ho Choi, Shin Young Kim and Tae Kyoung Ha in DIGITAL HEALTH
Footnotes
Acknowledgments
We extend our gratitude to Ho Dong Lee and Young Jun Lee of the Honeynaps Research and Development Center, Honeynaps Co. Ltd, Seoul, Republic of Korea, for their advisory support and for providing detailed information on SOMNUM, an AI diagnostic program developed by Honeynaps Co. Ltd.
Author contributions
Conceptualization, J.H.C.; methodology, M.J.P. and J.H.C.; formal analysis; M.J.P., S.Y.K., and J.H.C.; investigation, M.J.P., T.K.H., and J.H.C.; resources, T.K.H. and J.H.C.; writing–original draft, M.J.P. and J.H.C.; writing-review and editing, M.J.P. and J.H.C.; supervision, J.H.C.; All authors have read and approved the final manuscript.
Data availability
The datasets used and/or analyzed during the current study may be provided from the corresponding author, upon appropriate request.
Declaration of conflicting interests
The author(s) declared the following potential conflicts of interest with respect to the research, authorship, and/or publication of this article: Marn Joon Park and Shin Young Kim declare no conflicts of interest. Ji Ho Choi is the principal investigator (PI) of the current study, and is currently serving as the nonexecutive board of Honeynaps Co. Ltd., appointed from March 2024. Tae Kyoung Ha is the president of Honeynaps Co. Ltd. The current investigation was independently conceptualized and designed by Ji Ho Choi, utilizing Dr. Choi's patient data from 2017 to 2019, and received IRB approval from Dr. Choi's institution at 2020. The company had no role in the decision to publish the results.
Funding
The author(s) disclosed receipt of the following financial support for the research, authorship, and/or publication of this article: Seoul Business Agency (2023 Bio/Medical Technology Commercialization Supporting Project), Soonchunhyang University Research Fund, (grant number BT230157, N/A).
Guarantor statement
Ji Ho Choi takes full responsibility for the article, including for the accuracy and appropriateness of the reference list.
Supplemental material
Supplemental material for this article is available online.
References
Supplementary Material
Please find the following supplemental material available below.
For Open Access articles published under a Creative Commons License, all supplemental material carries the same license as the article it is associated with.
For non-Open Access articles published, all supplemental material carries a non-exclusive license, and permission requests for re-use of supplemental material or any part of supplemental material shall be sent directly to the copyright owner as specified in the copyright notice associated with the article.