
Abstract
Objective
Obstructive sleep apnea is a global health concern, and several tools have been developed to screen its severity. However, most tools focus on respiratory events instead of sleep arousal, which can also affect sleep efficiency. This study employed easy-to-measure parameters—namely heart rate variability, oxygen saturation, and body profiles—to predict arousal occurrence.
Methods
Body profiles and polysomnography recordings were collected from 659 patients. Continuous heart rate variability and oximetry measurements were performed and then labeled based on the presence of sleep arousal. The dataset, comprising five body profiles, mean heart rate, six heart rate variability, and five oximetry variables, was then split into 80% training/validation and 20% testing datasets. Eight machine learning approaches were employed. The model with the highest accuracy, area under the receiver operating characteristic curve, and area under the precision recall curve values in the training/validation dataset was applied to the testing dataset and to determine feature importance.
Results
InceptionTime, which exhibited superior performance in predicting sleep arousal in the training dataset, was used to classify the testing dataset and explore feature importance. In the testing dataset, InceptionTime achieved an accuracy of 76.21%, an area under the receiver operating characteristic curve of 84.33%, and an area under the precision recall curve of 86.28%. The standard deviations of time intervals between successive normal heartbeats and the square roots of the means of the squares of successive differences between normal heartbeats were predominant predictors of arousal occurrence.
Conclusions
The established models can be considered for screening sleep arousal occurrence or integrated in wearable devices for home-based sleep examination.
Keywords
Introduction
Obstructive sleep apnea (OSA) is a sleep-breathing disorder caused by a partial or total obstruction of the airway. 1 In the global population aged between 30 and 69 years, nearly one billion people have mild-to-severe OSA, and almost half a billion have moderate-to-severe OSA, making OSA a condition of critical health concern worldwide. 2 Between 1990 and 2010 in the United States, the prevalence rate of OSA increased by nearly 30%. 3 Patients with OSA are more likely than people without OSA to experience a variety of unfavorable clinical outcomes, such as neuropsychiatric impairment 4 and cerebrovascular and cardiovascular morbidity. 5 Consequently, prompt OSA diagnosis and appropriate treatment are crucial.
In-lab polysomnography (PSG) is the gold standard test for measuring the apnea–hypopnea index (AHI), which is used to categorize OSA severity. Curative therapies are typically advised for patients with moderate-to-severe OSA. 6 However, PSG is time-consuming and arduous to perform, and thus its efficacy and promptness may be limited. For instance, the average waiting time for PSG examinations ranges from several months to 2 years in developed countries because PSG requires a protracted monitoring period and the involvement of professional experts. 7 Therefore, researchers have developed multiple alternative approaches to identifying OSA risk, including home sleep tests, 8 questionnaires, 9 machine learning models, 10 and wearable devices. 11 However, the currently available approaches predominantly focus on predicting OSA severity based on the AHI.12,13 Another index, such as the arousal index (ArI) derived from the electroencephalogram (EEG) in the PSG channel, should be used for assessing sleep quality. 14 In other words, sleep arousal, which refers to transitions between different sleep stages, may affect individuals’ health, such as cognitive and memory function. 15 Although these physiological events have been linked to OSA severity, previous researchers have indicated that only approximately two-thirds of respiratory events are accompanied by sleep arousal. 16 This finding suggests that focusing solely on the AHI may not provide a comprehensive assessment of OSA manifestations and their related health risks. Thus, it has become crucial to develop methods for predicting the occurrence of sleep arousal instead of exclusively relying on the AHI to evaluate OSA severity. 17 Previous studies have developed models by using deep neural networks to predict the presence of sleep arousal. These models incorporate various physiological signals, such as EEG, electrocardiography (EKG), electrooculography (EOG), electromyography (EMG), and oximetry measurements. 18 Similarly, another study utilized deep learning approaches, leveraging signals from PSG recordings (i.e., EEG, EOG, EMG, thoracoabdominal inductance signal, and oximetry parameters), to detect sleep arousal from sleep recordings. 19 However, these methods primarily or partly rely on EEG signals, which could limit their potential application in home-based scenarios due to the complexity of EEG equipment. Whether these approaches can extract arousal-related information without EEG channels remains to be determined. Therefore, establishing arousal prediction models that are robust and do not solely rely on EEG signals is essential.
To develop a model for predicting arousal occurrence without using EEG, the underlying mechanism, namely brain–heart interaction, must be explored. Cardiac-related signals (e.g., electrocardiograms or photoplethysmograms) reveal alterations in the central nervous system (CNS), which significantly influence heart rate (HR) and HR variability (HRV) by modulating heart rhythms and contractility.20,21 Researchers have indicated that physiological responses in the CNS (i.e., reduced sympathetic discharge rate and elevated parasympathetic discharge rate) may linearly reduce an individual's HR. 22 These physiological responses are linked to CNS stimulation, which may mirror cardiac-related signals and present as alterations in HR or HRV, which influence sleep arousal. 23 A related study demonstrated that one of the time-domain HRV features, namely the standard deviations (SDs) of the time intervals between successive normal heartbeats (SDNN), was significantly associated with a slow-wave sleep cycle. 24 Another study indicated that another time-domain HRV feature, namely the square roots of the means of the squares of successive differences between normal heartbeats (RMSSD), was significantly and positively correlated with sleep efficiency. 25 Regarding frequency-domain HRV features, one study determined that HRV values in the bands of very low frequency (VLF; 0.003–0.04 Hz), low frequency (LF; 0.04–0.15 Hz), and high frequency (HF; 0.15–0.4 Hz) were associated with sleep rhythm or cycles. 26 These relationships between alterations in HRV and the CNS could imply that incorporating HRV features into arousal prediction models may be beneficial given that such features are easily obtainable. The current arousal screening method is based on brainwave signals, which may be difficult to measure in a home environment. Therefore, the recording of HRV measurements by using wearable devices is more suitable for detecting sleep arousal in home-based sleep examinations and may provide more comprehensive results.
The purpose of this retrospective study was to develop prediction models for arousal events by using machine learning techniques that incorporated easily obtainable parameters, namely HRV, oximetry parameters, and body profiles. We hypothesized that established models that considered these parameters would demonstrate adequate performance in arousal event prediction because of the relationships between these parameters. We applied multiple machine learning techniques to determine the model with the highest accuracy and further analyzed the feature importance of each input variable to assess its contribution to the prediction. The results may reveal whether the prediction of arousal episodes without the use of EEG is feasible and could help to determine the relationship between arousal and HRV.
Methods
Study population
Data were collected retrospectively from patients who underwent PSG for OSA severity evaluation between September 2019 and September 2021 at the Sleep Center of Shuang Ho Hospital, Taipei Medical University (New Taipei City, Taiwan). The inclusion criteria are described as follows: (1) age = 18 to 85 years, (2) PSG recording time > 6 h, (3) sleep efficiency > 60%, and (4) no use of hypnotic or psychotropic medications and no history of invasive surgery for OSA. Data regarding physical characteristics—including age, sex, body mass index (BMI), and neck and waist circumferences—were accessed from the participants’ baseline surveys. Information regarding the patients’ histories of surgical intervention and regular medication use was acquired from their medical records. All the data from eligible patients were used for further analysis.
Sleep parameters
Data on sleep parameters were collected from the PSG database, which was established and maintained by the sleep center. Two systems, namely ResMed Embla N7000 (ResMed, San Diego, CA, USA) and Embla MPR (Natus Medical, Pleasanton, CA, USA), were employed to perform in-laboratory overnight PSG. Several physiological signals—including those from EEG, electrocardiography (EKG), electrooculography, and chin and leg electromyography; nasal and oral airflow; snoring patterns; thoracic and abdominal impendence; sleeping position; and oxygen saturation—were recorded during PSG. Next, the sleep events were scored by a qualified technician who used RemLogic software (version 3.41; Embla, Thornton, CO, USA) in compliance with the scoring manual published by the Americana Academy of Sleep Medicine in 2017. 27 To reduce individual scoring bias, the scoring outcomes were reviewed by another licensed technician, and any disagreement was further reviewed until consensus was reached. Furthermore, multiple sleep parameters—including sleep architecture, oxygen saturation, snoring events, OSA severity indices (i.e., the AHI and the oxygen desaturation index [ODI]), arousal responses, and the ArI—were determined.
HRV analysis and time-series data
This study employed Python (version 3.7.15) and open-source modules—namely BioSPPy (version 1.0.0), pyHRV (version 0.4.1), and hrv-analysis (version 1.0.3)—for HRV analysis. First, EKG signals and information on arousal events were extracted from PSG data. Figure 1 presents the flowchart of the dataset preparation process. Subsequently, HRV analysis was performed on 60-s segments of EKG signals. The selection of this segment length was based on a previous study that achieved acceptable accuracy in apnea detection by using HRV features (including both time- and frequency-domain parameters) within 60-s segments due to their regular patterns in apnea-arousal durations. 28 Furthermore, the decision to use a 60-s segment aligns with clinical practices for scoring arousal occurrences because accurate interpretation typically requires the evaluation of consecutive 2-page PSG signals (60 s). As presented in Figure 1 (Step A), this study employed a 60-s time window and a 1-s stride throughout the approximately 6-h long PSG recording to obtain continuous HRV features, including time- and frequency-domain metrics, in each second. Supplemental Figure 1 (Figure S1) presents further technical details. The 60-s time window began rolling at the start of the PSG recording (T = 0), and the initial readings of continuous HRV features (corresponding to the data at T = 60 s) were derived from EKG data collected between T = 0 and T = 60 s. Next, with the use of a 1-s stride throughout the PSG recording, continuous HRV features were obtained using EKG signals (e.g., as T = 1–61 s, T = 2–62 s, and so on). The time-domain metrics were SDNN, RMSSD, the number of interval differences of successive normal heartbeats greater than 50 milliseconds (NN50), and mean HR (HR-mean). The frequency-domain metrics were normalized LF (nLF), normalized HF (nHF), and normalized VLF (nVLF). To prevent data artifacts, if the mean HR derived from the 60-s time window was More than 90 or less than 40 beats per minute, suspected artifacts were addressed by interpolation with neighboring data to replace them. 29 Moreover, the peripheral arterial oxygen saturation level (SpO2), which was measured using pulse oximetry, was extracted from PSG data and was time-aligned with the derived HRV features to be used as joint input features. Next, as presented in Figure 1 (Step B), the generated time-series data were utilized to construct the dataset for developing the model. A 60-s time window with a 30-s stride was employed to extract data for dataset construction. Considering that sleep staging and arousal scoring were performed every 30 s (as per the PSG montage page) and the criteria for scoring arousal required at least 10 s of steady sleep preceding the arousal event, with the arousal not lasting more than 15 s, 27 we employed two consecutive stable sleep pages (60-s window) or stable sleep on the first page (first 30 s) followed by wakefulness on the second page due to arousal (last 30 s) to predict the occurrence of sleep arousal. Subsequently, the time-series data were labeled as arousal data if the arousal event occurred within the 60-s interval Figure 1 (Step C). In rare cases where sleep arousal events extended across two pages of the PSG montage (e.g., a 14-s arousal event occurring between the last 10 s of page 100 and the first 4 s of page 101), such events were included in the dataset only once. Specifically, for such an example, the time-series data (within the 60-s window between pages 99 and 100) were labeled as arousal data and were included in the dataset. However, despite the inclusion of the first 4 s of the arousal event, time-series data collected within the 60-s window between pages 100 and 101 were not included in the dataset. Most of the time-series data labeled as arousal data captured the complete duration of the arousal event, considering that the maximum duration of arousal did not exceed 15 s and the 30-s stride was used. For crossed-page arousals, only the first interval involved in the event was included in the dataset. Input data type (cross-sectional and time-series data)
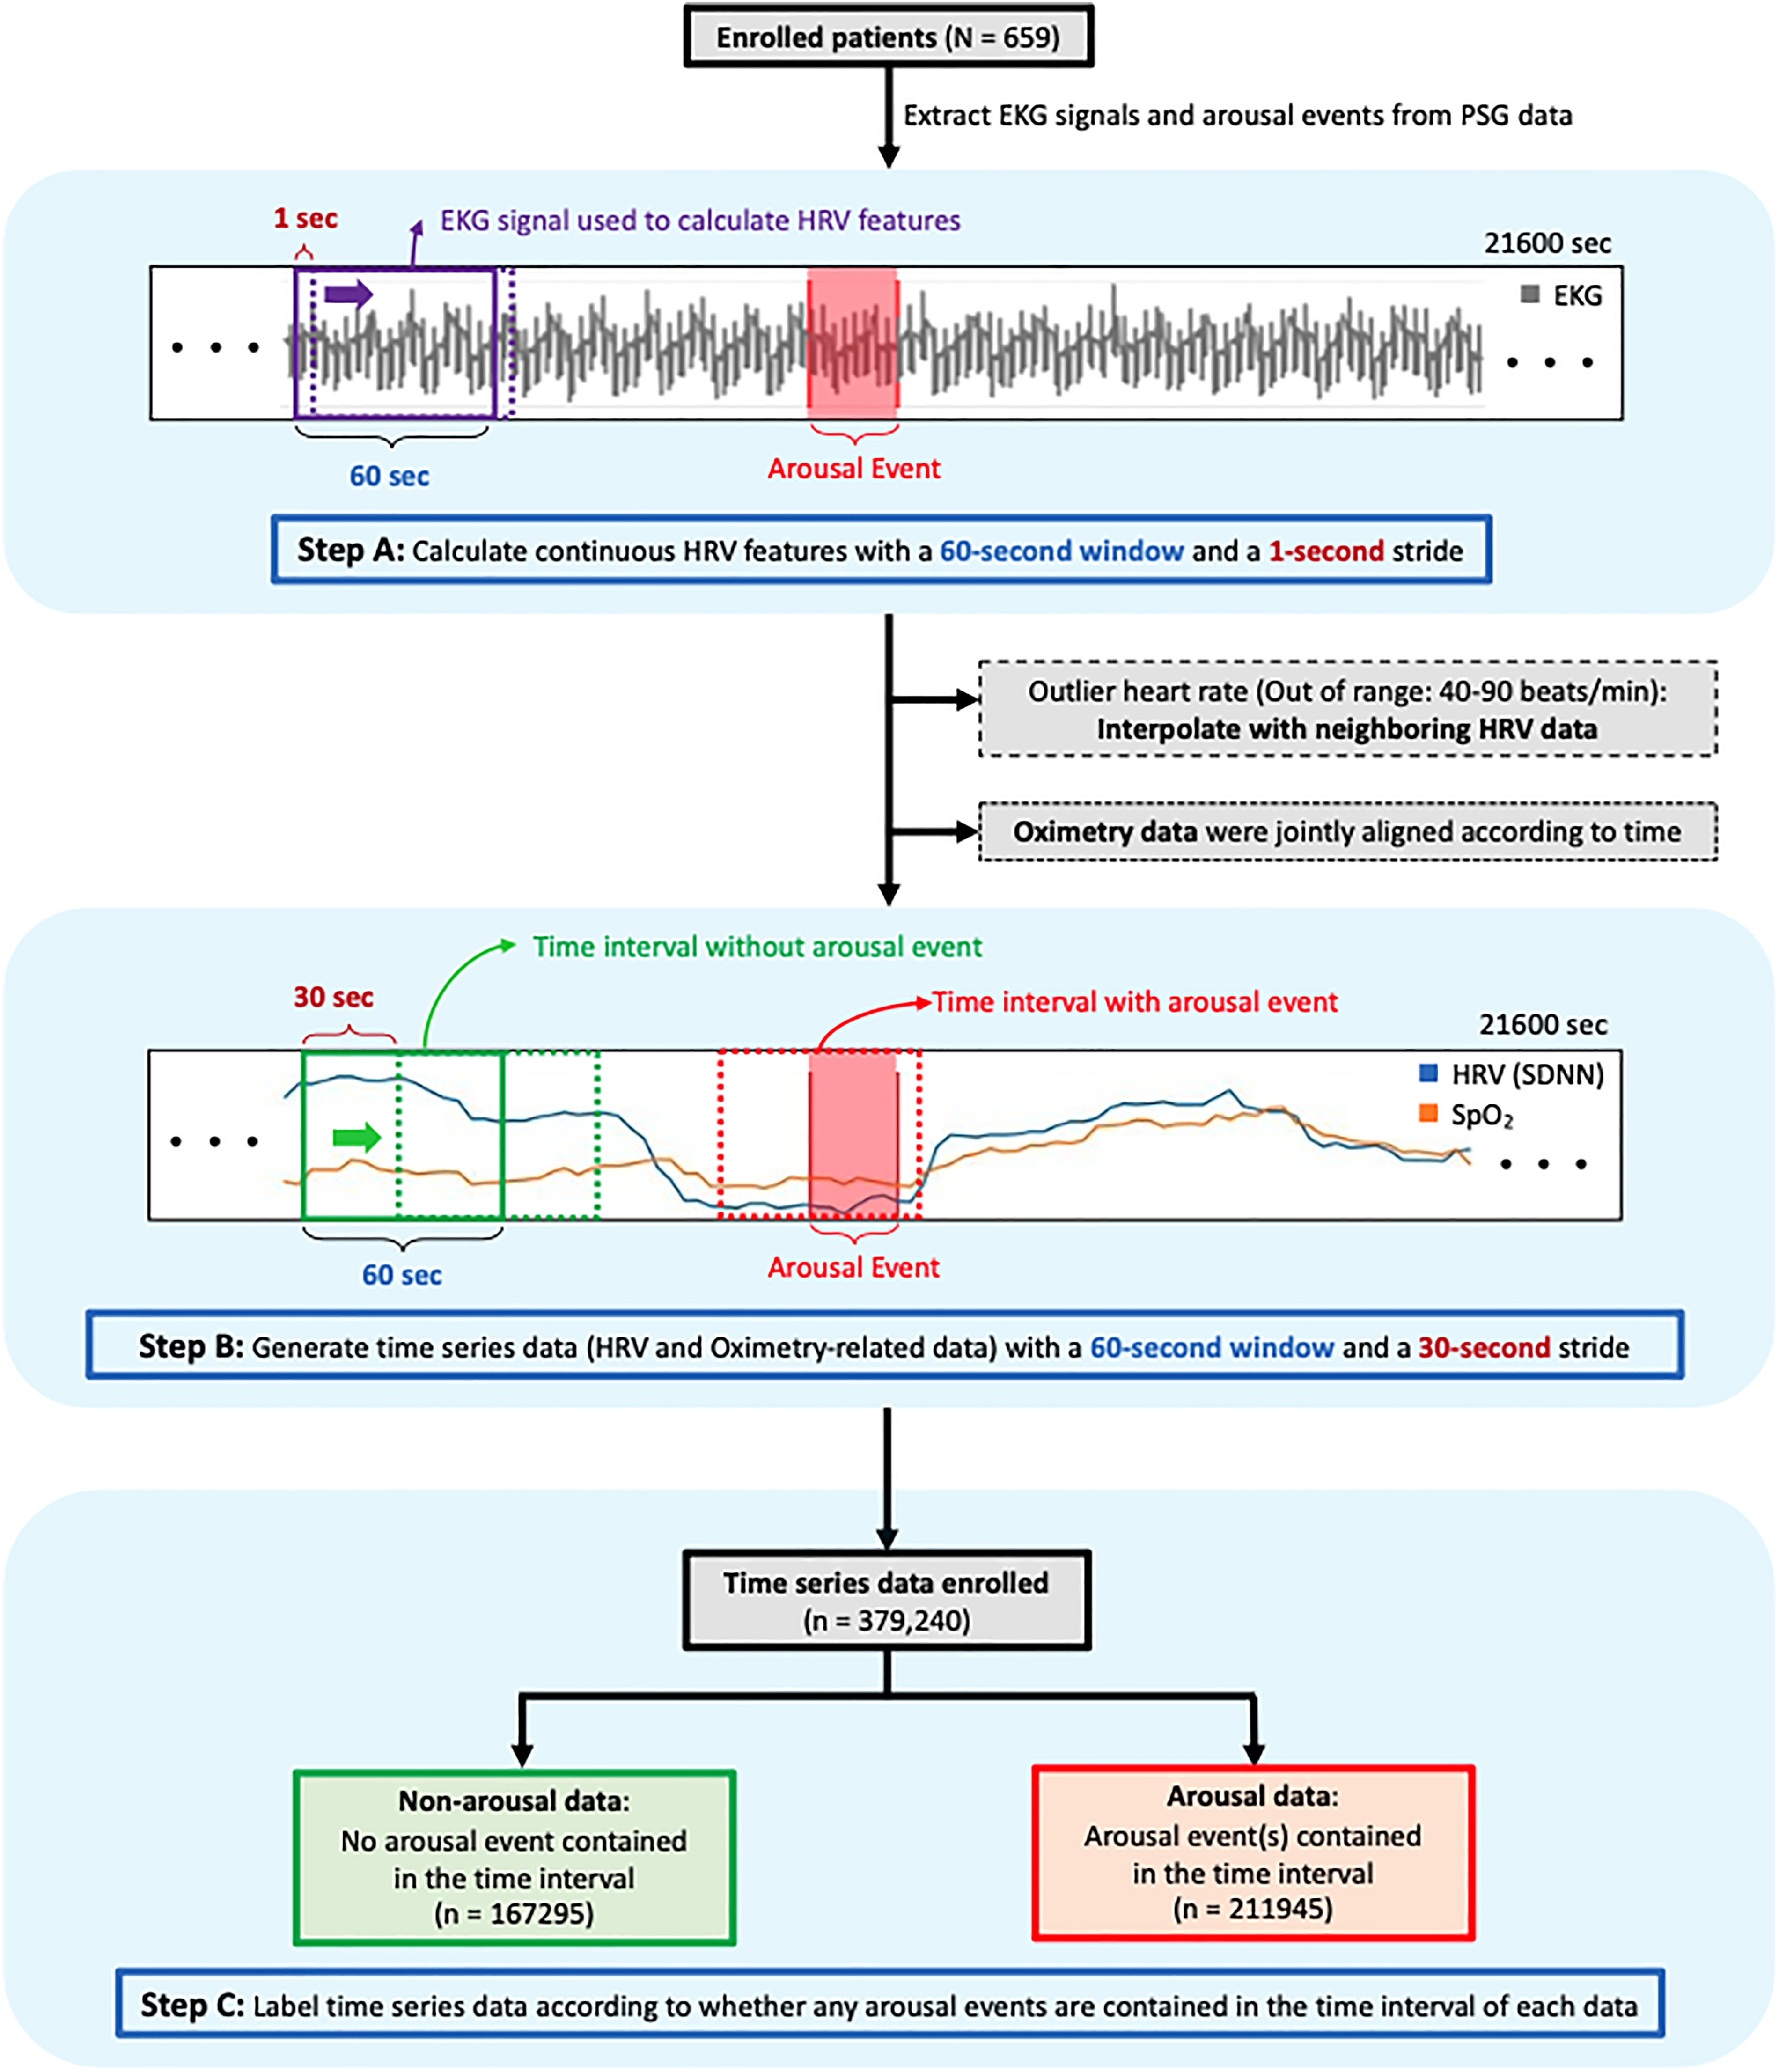
The flowchart of data collection and processing. The dataset preparation process. First, EKG signals and arousal event information were extracted from PSG data, followed by HRV analysis with 60-s EKG segments (Step A). The study employed a 60-s time window and a 1-s stride to generate continuous HRV features from the approximately 6-h PSG recording. Oximetry data were also extracted from the PSG data and time-aligned with the HRV features. The resulting timeseries data (Step B) were then used to create the dataset. A 60-s time window and 30-s stride were used for data extraction, with the time-series data labeled as arousal data if an arousal event occurred within the 60-s interval (Step C). Notably, to prevent data artifacts, if the mean heart rate derived from the 60-s time window was more than 90 or less than 40 beats per minute, suspected artifacts were addressed by interpolating with neighboring data to replace them. PSG: polysomnography; EKG: electrocardiogram; HRV: heart rate variability; SpO2: peripheral arterial oxygen saturation level.
Given that nocturnal oxygen saturation may provide additional insights into sleep status or affect the arousal threshold, aiding in predicting sleep arousal occurrence,30,31 this study utilized both the 60-s SpO2 data as continuous data and derived additional SpO2 features for each 60-s interval. These additional SpO2 features for each interval included the mean SpO2 (SpO2-mean), the standard deviation of SpO2 (SpO2-std), the minimum value of SpO2 (SpO2-min), the maximum decrease from the SpO2-mean (desaturation depth), and the duration of desaturation below 3% of the SpO2-mean (desaturation duration). Next, because this study employed two approaches, namely cross-sectional and time-series models, two datasets were prepared accordingly. First, for cross-sectional models, the mean of each continuous variable (per 60-s window) was calculated as the input feature. The dataset for cross-sectional models included five baseline characteristics (age, sex, BMI, and neck and waist circumferences), HR-mean, mean of six HRV features (mean of SDNN, RMSSD, NN50, nLF, nHF, and nVLF), and mean of five oximetry variables (SpO2-mean, SpO2-std, SpO2-min, desaturation depth, and desaturation duration). For time-series models, the input data shape was set as a sequence of 60 values, with each value corresponding to each second (60-s window). Thus, no further alterations were required for continuous data, such as HRV features and SpO2, to meet the input shape. However, mean or nonsequence data, such as baseline characteristics, the HR-mean of 60-s windows, and the mean of five oximetry variables of 60-s windows, needed to be broadcasted to a length of 60 values to be stacked with other time-series features.
Machine learning approaches
Based on the mechanism of brain–heart interaction, this study established machine learning models to predict arousal occurrence on the basis of alterations in HRV (Figure S2 provides an example). Open-source Python libraries—including scikit-learn (version 1.1.2), 32 tsai (version 0.3.4), 33 fastai (version 2.7.9), 34 and PyTorch (version 1.13.1) 35 —were employed for machine learning training and evaluation. In addition, eight supervised machine learning models—namely logistic regression (LR), k-nearest neighbors (kNN), naïve Bayes (NB), support vector machine (SVM), random forest (RF), gradient boosting machine (GBM), long short-term memory (LSTM), and InceptionTime 36 —were selected to establish the arousal event prediction model. The model development workflow is illustrated in Figure 2. First, the data were randomly divided into a training dataset and a testing dataset at proportions of 80% and 20%, respectively. In the training phase, a 10-fold cross-validated grid search was performed to obtain the optimal classifier for each machine learning algorithm. 37 Considering the imbalanced nature of sleep, where individuals typically have more nonarousal sleep and few sleep-time-involved arousal events, 90% of the training dataset was to an oversampling process by using the synthesized minority oversampling technique (SMOTE) to balance the training dataset and mitigate the risk of overfitting. 38 The remaining 10% of the training dataset was randomly allocated as validation data in each iteration.

Training and testing process for developing models of arousal event prediction. The time-series datasets were randomly divided into training and testing datasets with an 80% and 20% split, respectively. Various models, including LR, kNNs, NB, SVM, RF, GBM, LSTM, and InceptionTime, were trained. A 10-fold cross-validated grid search was implemented to determine the optimal classifier for each machine-learning algorithm. Due to the imbalanced nature of sleep, characterized by extended periods of nonarousal sleep punctuated by occasional arousal events, 90% of the training dataset underwent an oversampling process. The SMOTE was utilized to balance the training dataset, thereby minimizing the risk of overfitting. All the developed models were then used to classify the testing dataset. Subsequently, the permutation method, which evaluates the decrease in accuracy of testing scores when a single feature value is randomly shuffled, was used to compute the feature importance of the model with the highest accuracy, AUROC, and AUPRC values for the testing dataset. LR: logistic regression; kNN: k-nearest neighbors; NB: Naïve Bayes; SVM: support vector machine; RF: random forest; GBM: gradient boosting machine; LSTM: long short-term memory; SMOTE: synthesized minority oversampling technique; AUROC: area under the receiver operating characteristic curve; AUPRC: area under the precision recall curve.
In this study, two types of models were established and trained. Regarding their input data type, the cross-sectional models (LR, kNN, NB, SVM, RF, and GBM) utilized the cross-sectional dataset (where each feature was input as the mean of the respective 60-s time window). By contrast, the time-series models (LSTM and InceptionTime) employed the time-series dataset (where each input feature retained its 60-s time window shape, keeping 60-s values as continuous data).
Regarding grid search outcomes, for the cross-sectional models, we optimized accuracy by tuning (a) the inverse values of regularization strength (C, ranging from 10−1 to 101) and the algorithm used in the optimization problem (limited-memory Broyden–Fletcher–Goldfarb–Shanno algorithm or LIBLINEAR) for the LR models; (b) the k value (ranging from 1 to 2) and weight type (uniform or distance) for the kNN models; (c) the portion of the largest variance of all features for the NB models (from 10−9 to 1); (d) multiple kernel types (linear, polynomial, radial basis function, and sigmoid), the kernel coefficient (the reciprocal of the number of input features or the reciprocal of the product of the number of input features and the variance of input data), and regularization values (C, between 10−1 and 101) for the SVM models; (e) the criterion (Gini impurity or Shannon entropy), the maximum number of features used for fitting (the square root or binary logarithm of the total number of features), the maximum depth of the trees (set as 2, 6, or 10), and the number of classification trees (set as 250, 500, or 800) for the RF models; and (f) the criterion (mean squared error with or without the improvement score provided by Friedman), the fraction of samples to be used for fitting individual base learners (set as 0.5, 0.75, or 1), the maximum number of features used for fitting (the square root, binary logarithm, or total number of features), the maximum depth of trees (set as 2, 6, or 10), and the number of estimators (set as 50, 100, or 800) for the GBM models. For time-series models, we optimized accuracy by tuning (g) the number of layers (set as 2, 3, or 4) and the dropout rate for both the recurrent network and fully connected layers (set as 20%, 40%, or 50%) for the LSTM and (h) the number of filters (set as 16, 32, or 64) and the model depth (set as 4, 6, or 8) for InceptionTime. Next, the following hyperparameters were used for training the time-series models: A batch size of 4096, cross-entropy loss as the loss function, Adam as the optimizer, an epoch of 40, and a weight decay of 0.01. The data augmentation technique known as MixUp 39 was applied during training. The learning rate and momentum scheduler proposed in the one-cycle policy 40 were used during fitting, which was performed in two phases. The first phase accounted for 25% of the fitting, in which the learning rate increased and the momentum decreased with cosine annealing. The second phase accounted for the remaining 75% of the fitting, in which the learning rate decreased and the momentum increased. The learning rate finder proposed in the one-cycle policy was used to determine the maximum learning rate.
To evaluate model performance, we calculated the accuracy, precision, recall, F1 score, area under the receiver operating characteristic curve (AUROC), and area under the precision recall curve (AUPRC) for each of the eight models in the training and testing phases. The model with the highest accuracy, AUROC, and AUPRC values for the testing dataset was chosen for further evaluation of feature importance. Subsequently, the contribution of each input variable to arousal event prediction was determined by computing their feature importance. The permutation method was employed for feature importance calculation, in which the decrease in accuracy in testing scores is determined when a single feature value is randomly shuffled.
Results
Characteristics of enrolled participants
A total of 659 participants were enrolled in this retrospective study; their demographic characteristics are presented in Table 1. The study population had an average age of 48.41 (SD: 12.94) years and was predominantly male (536/123, 81.3%). Regarding body profile, they had a mean BMI of 29.05 (SD: 5.61) kg/m3, denoting a general status of overweight; a neck circumference of 39.67 (SD: 4.07) cm; and a waist circumference of 98.37 (SD: 13.28) cm. Regarding the distribution of OSA severity, most patients were categorized as having severe OSA (568, 86.19%).
Demographic characteristics of the patients.

BMI: body mass index; OSA: obstructive sleep apnea.
Data are expressed as mean ± standard deviation.
Sleep parameters
Sleep parameters derived from PSG data are listed in Table 2. The mean value of sleep efficiency was 75.59% (SD: 12.68%), and the total sleep time was 276.47 (SD: 47.28) minutes. Regarding oximetry parameters, a mean ODI value (≥3%) of 52.31 (SD: 31.08) events/hour was observed in the study population. Regarding the sleep disorder index, the patients exhibited a mean AHI of 61.11 (SD: 27.47) events/hour and an ArI of 48.16 (SD: 17.27) events/hour.
Sleep parameters of the patients.

SPT: sleep period of time; NREM: nonrapid eye movement; REM: rapid eye movement; WASO: wake time after sleep onset; TST: total sleep time; SpO2: peripheral arterial oxygen saturation, as measured using pulse oximetry; ODI: oxygen desaturation index (≥3%); AHI: apnea–hypopnea index; ArI: arousal index.
Data are expressed as mean ± standard deviation.
The number of patients with rapid eye movement sleep was 636.
Validation performance of machine learning approaches
Comparison of the cross-validation results of the models established using multiple machine learning approaches.

LR: logistic regression; kNN, k-nearest neighbor algorithms; NB, Naïve Bayes; SVM, support vector machine; RF, random forest; GBM: gradient boosting machine; LSTM: long short-term memory; AUROC: area under the receiver operating characteristic curve; AUPRC: area under the precision recall curve.
Testing performance and feature importance
The model performance for the testing dataset is presented in Table 4. The number of data in the testing dataset was 75,790, comprising 33,479 nonarousal and 42,311 arousal events. The InceptionTime model demonstrated the highest accuracy (LR: 66.34%, kNN: 69.94%, NB: 64.61%, SVM: 71.56%, RF: 68.40%, GBM: 57.59%, LSTM: 73.41%, InceptionTime: 76.21%), the highest AUROC (LR: 72.68%, kNN: 69.61%, NB: 70.74%, SVM: 78.38%, RF: 76.73%, GBM: 77.83%, LSTM: 81.17%, InceptionTime: 84.33%), and the highest AUPRC (LR: 74.79%, kNN: 68.54%, NB: 71.73%, SVM: 79.65%, RF: 78.81%, GBM: 80.66%, LSTM: 83.32%, InceptionTime: 86.28%). Therefore, the InceptionTime model was selected to further assess the feature importance of each input variable. The permutation feature importance of the InceptionTime model is presented in Table 5. The most major decrease in accuracy was obtained when SDNN values were randomly shuffled, indicating that the SDNN had the most significant feature importance. The RMSSD, HR-mean, BMI, and waist circumference were subsequently ranked from second to fifth, respectively, in terms of feature importance in the arousal event prediction model.
Comparison of the performance of the models established using various machine learning approaches for the testing dataset.

LR: logistic regression; kNN, k-nearest neighbor algorithms; NB, Naïve Bayes; SVM, support vector machine; RF, random forest; GBM: gradient boosting machine; LSTM: long short-term memory; AUROC: area under the receiver operating characteristic curve; AUPRC: area under the precision recall curve.
Feature importance of the selected model (InceptionTime) in the testing dataset.
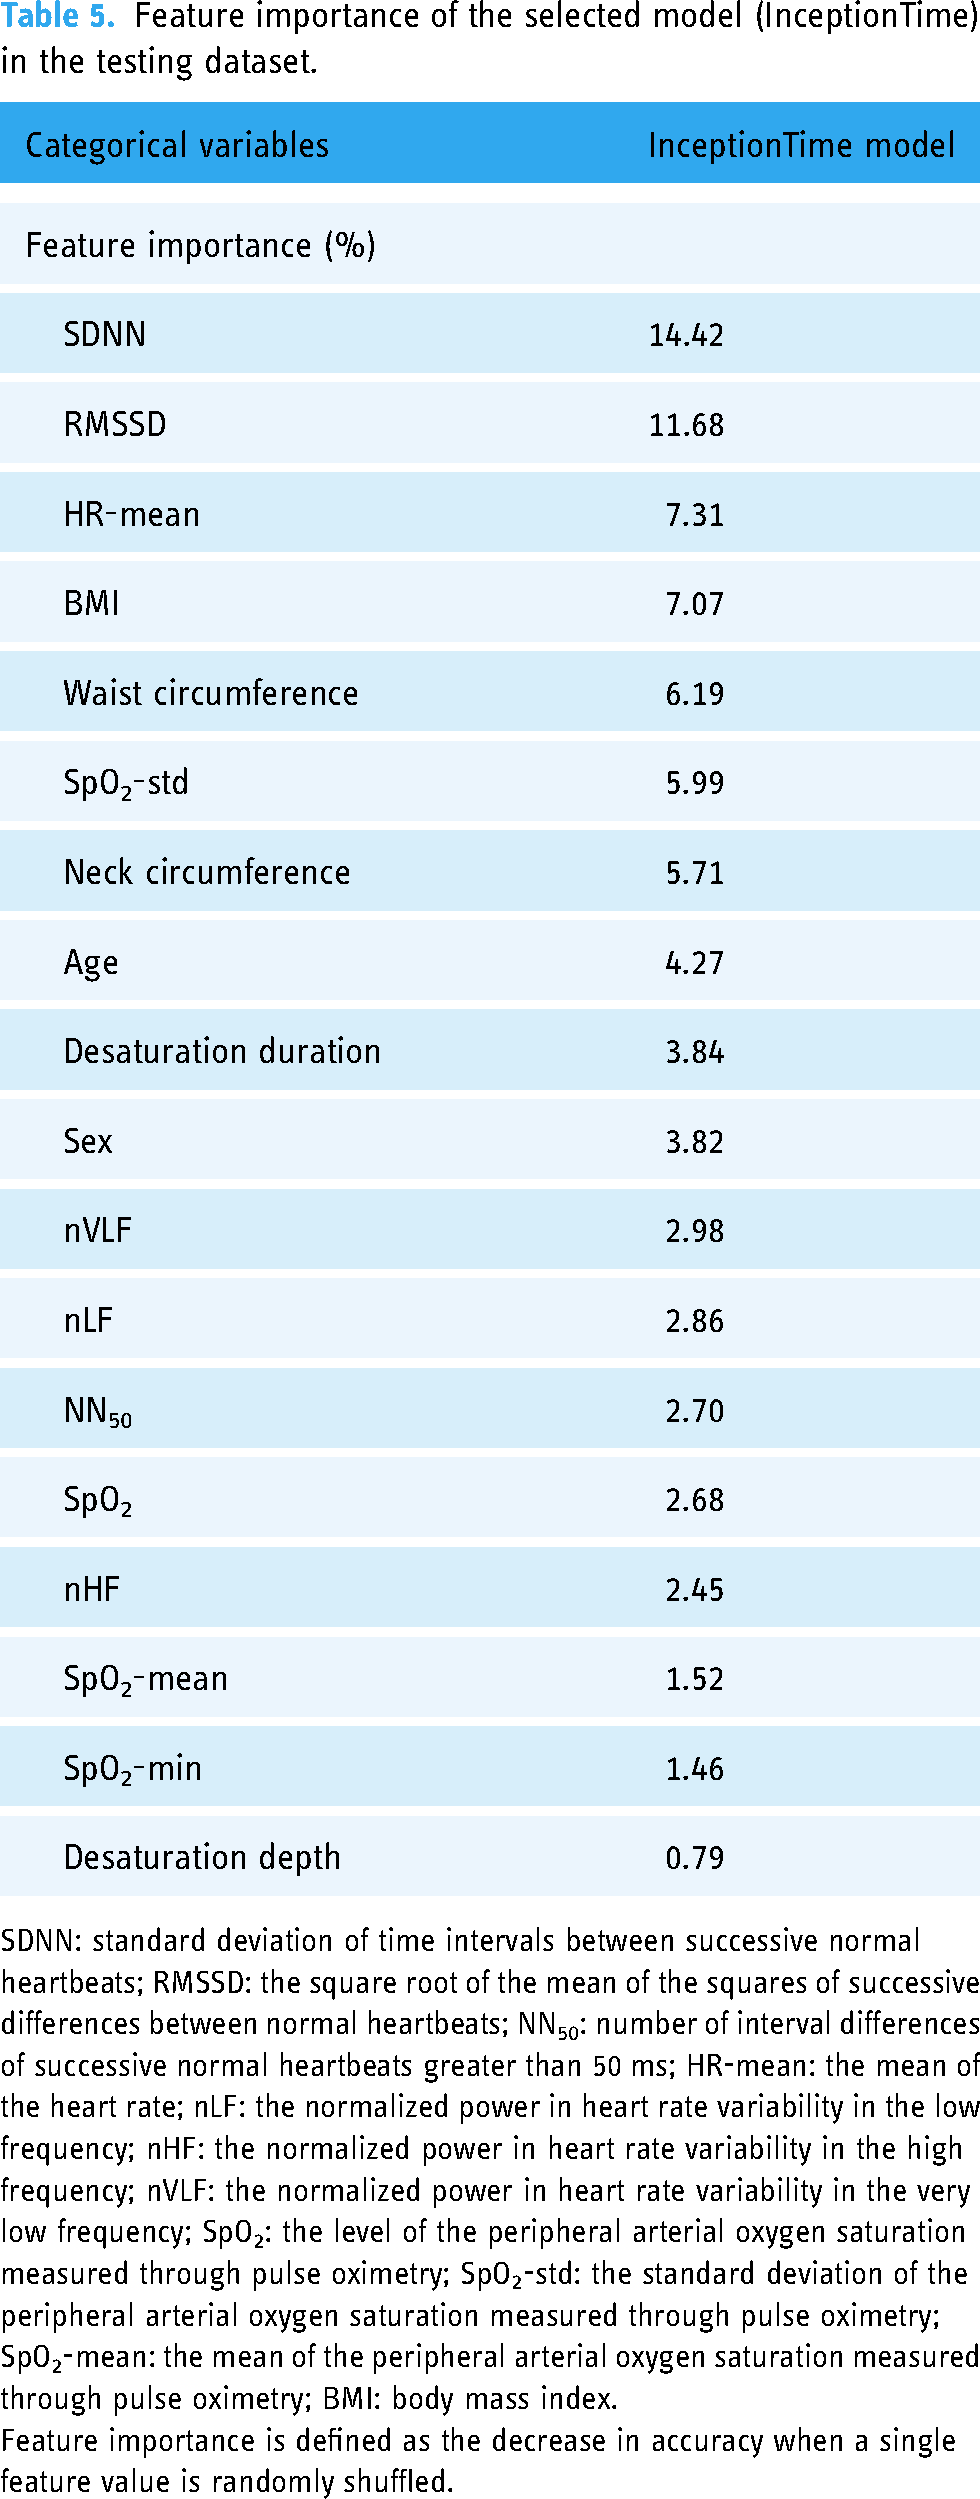
SDNN: standard deviation of time intervals between successive normal heartbeats; RMSSD: the square root of the mean of the squares of successive differences between normal heartbeats; NN50: number of interval differences of successive normal heartbeats greater than 50 ms; HR-mean: the mean of the heart rate; nLF: the normalized power in heart rate variability in the low frequency; nHF: the normalized power in heart rate variability in the high frequency; nVLF: the normalized power in heart rate variability in the very low frequency; SpO2: the level of the peripheral arterial oxygen saturation measured through pulse oximetry; SpO2-std: the standard deviation of the peripheral arterial oxygen saturation measured through pulse oximetry; SpO2-mean: the mean of the peripheral arterial oxygen saturation measured through pulse oximetry; BMI: body mass index.
Feature importance is defined as the decrease in accuracy when a single feature value is randomly shuffled.
Supplementary
Given that the data used in this study were obtained from patients with varying degrees of OSA severity, as indicated by their AHI values, we utilized the selected model (i.e., InceptionTime) for arousal prediction in the four OSA severity subgroups. The accuracy, AUROC, and AUPRC of these models ranged from 71.75% to 77.80%, 79.12% to 84.53%, and 64.16% to 87.39%, respectively (Table S1). Next, to investigate the resilience or generalizability of the developed models, the present study used an alternative procedure for model training, and the results are shown in the Supplementary Information. The models were built according to the aforementioned procedure but with a different approach for the preparation of the dataset. Specifically, the data were independently divided into two datasets based on patient information. Data from 527 patients were used in the training and validation phase, whereas data from the remaining 132 patients were used in the testing phase. The results are illustrated in the Supplementary Information. In the training and validation stage (Table S2), the LSTM model demonstrated the highest accuracy (69.7%), AUROC (75.77%), and AUPRC (76.81%). similarly, the LSTM model demonstrated the highest accuracy (70.31%), AUROC (76.34%), and AUPRC (79.07%) in the testing stage (Table S3). Therefore, the LSTM model was employed to determine feature importance in predicting arousal events on the testing dataset. As presented in Table S4, the SDNN caused the most major decrease in accuracy when its values were randomly shuffled in the LSTM model, suggesting that the SDNN had the highest feature importance. SpO2-std, nVLF, SpO2-mean, and nLF were subsequently ranked from second to fifth, respectively, in terms of feature importance.
Discussion
This study established sleep arousal prediction models by employing eight machine learning approaches based on HRV metrics, oximetry parameters, and body profiles. Approximately 400,000 sleep period data (1 min), including data with and without arousal, were obtained from 659 participants and divided into a training and validation dataset (80%) and a testing dataset (20%). The overall accuracy levels of all the established models in the training and validation stage were compared, and the feature importance of the models that demonstrated the highest accuracy and largest AUC was assessed in the testing stage.
Regarding OSA severity and PSG parameters, most of the enrolled participants had severe OSA (86.16%), with an AHI of 61.11 events/hour, an ODI of 52.31 events/hour, and an ArI of 48.16 events/hour. The average value of arousal response frequency was lower than the average values of the AHI and ODI. This finding indicated that only a certain percentage of the sleep-disordered breathing or oxygen desaturation events ended with arousal response that recruited the upper airway dilator muscle. Previous studies have suggested that 20%–30% of respiratory events do not end with an arousal response.41,42 One study employed a continuous positive airway pressure machine and lowered the support level while patients were using it to simulate respiratory events and hypoxia occurrence. That study observed that nearly 60% of all recorded events ended with arousal responses. 43 Another study analyzed the PSG parameters of participants with normal cognitive function in Taiwan and reported that approximately 80% of all recorded respiratory events ended with arousal responses. 44 Taken together, the low ArI in the present study is consistent with the results of previous studies; this consistency suggests that respiratory events or oxygen desaturation events may not always accompany arousal responses.
Regarding the overall performance of the developed approaches, the InceptionTime model exhibited the highest values in accuracy, AUROC, and AUPRC, followed by the LSTM model. In addition, this study employed independent testing datasets for further analysis to simulate real-world scenarios, in which sleep arousal prediction was conducted in new patients. This independent testing enabled us to compare results derived from easily obtainable parameters with arousal data scored from the EEG channel, Furthermore, it allowed us to examine the resilience and adaptability of the established models when applied to new patients. Regarding outcomes in supplementary analyses, another type of time-series model, namely the LSTM model, demonstrated the highest accuracy, AUROC, and AUPRC values, followed by the InceptionTime model. Studies have employed these two models for sleep arousal prediction by using time-series data (i.e., EKG or HRV data) and demonstrated adequate performance in multiple medical tasks, including OSA severity classification.45,46 Although no evidence supports the superiority of time-series classification models (e.g., LSTM and InceptionTime) over traditional machine learning techniques (e.g., LR, kNN, and NB), the present observations have multiple possible explanations. First, time-series models consider dynamic features by time order or stride by considering each time point as a particular characteristic. Such consideration may be relatively suitable when using HRV parameters for prediction because HRV data includes sequential information. A previous study reported that time-series models (LSTM or adjusted LSTM) outperformed traditional models (e.g., SVM, RF) when sequential HRV data were used to predict sleep and wake cycles. 47 Another study compared the overall accuracy levels of time-series classification models and traditional classification models in classifying sleep stages based on HRV features 48 and found a similar result, namely higher overall accuracy for the time-series classification models than for the other approaches. When considering prediction performance determined using testing datasets (both pooled and independent), the results revealed values above 70% with accuracy, AUROC, and AUPRC ranging from 70.31% to 75.85%, 76.34% to 84.33%, and 79.07% to 86.28%, respectively. Previous studies have incorporated EEG signals and have employed various cross-sectional models (e.g., RF, SVM, kNN, Fisher's linear discriminant, and artificial neural networks) to predict arousal occurrence, achieving similar AUROC values ranging from 76.8% to 84.4%. 49 Another related study employed decision tree, LR, and NB models to predict arousal events, achieving accuracy values ranging from 78.1% to 84.84%. However, this study was based only on PSG signals from 28 patients. 50 Another study achieved an AUROC of above 85% but an AUPRC of less than 55% by incorporating EEG signals and employing a time-series model (i.e., LSTM) with a deep-learning setting (depth = 90) to predict sleep arousal. 51 Therefore, the findings of the current study obtained by utilizing time-series models based on easily obtainable parameters indicate the possibility of predicting sleep arousal without relying on EEG signals. However, in the current study, the accuracy of testing datasets (both pooled and independent datasets) was less than 80%, indicating scope for improvement. A potential factor affecting predictive accuracy is the patient data distribution. In this study, the enrolled patients exhibited high mean ArI (48.16 ± 17.27 events/hour) and AHI values (61.11 ± 27.47 events/hour). Predictive accuracy might be improved by training the model with a dataset containing a more evenly distributed range of OSA severe cases. Another potential factor that can be considered for improving accuracy is the length of the time window. In the present study, physiological signals were analyzed over a 60-s window, which may occasionally span across two sleep stages. Although the sleep stage may appear continuous without event interruptions, 52 it is still possible for the first 30 s of a 60-s interval to correspond to one sleep stage and the last 30 s to correspond to another. Taken together, the proposed time-series models based on easily obtainable parameters are suitable for sleep arousal detection, and they can be integrated with wearable devices for use in home-based sleep scenarios. However, additional efforts are needed to enhance the accuracy of predictions.
Regarding the feature importance of the selected model (i.e., InceptionTime) for predicting the testing dataset, the SDNN and RMSSD demonstrated the highest feature importance for arousal response prediction. To the best of our knowledge, no straightforward evidence directly linking the SDNN, RMSSD, and HR-mean to sleep arousal exists. However, the present findings may be explained by several mechanisms underlying the brain–heart interaction. The SDNN and RMSSD may serve as indicators of the sleep–wake cycle or sleep arousal because changes in manifestations during the sleep stage are mediated by the CNS and are indicated by alterations in HRV features.53,54 Moreover, sleep arousal is associated with several changes in physiological reactions, including increased heart rate, elevated blood pressure, and autonomic nervous system activation. 55 In addition, changes in hemodynamics can affect the functioning of the autonomic nervous system during respiratory events associated with arousal. 56 Existing evidence has revealed mechanisms related to cardiac and cerebral coupling.57,58 Researchers have observed that an increase in the heart rate and consistent increases in power in EKG signals often precede cortical activation and the occurrence of sleep arousal. These observations suggest a close association between EEG signal responses (i.e., sleep arousal) and the interplay between the central and autonomic nervous systems, subsequently affecting heart rate and its variability. Likewise, researchers have reported alterations in the RMSSD and HR between the start and end of the slow-wave sleep cycle. 59 One study used actigraphy to obtain HRV features in patients with insomnia and reported significant differences in HR, the SDNN, and the RMSSD between those patients’ awake and asleep states. 60
Taken together, HRV parameters may be helpful in predicting sleep cycle changes, namely sleep arousal, caused by brain–heart interaction. However, additional research is needed to explore the associations between HRV and sleep arousal in order to enhance the robustness of the established models.
Limitations
Several limitations of this study should be addressed in future research. First, the retrospective PSG data were collected from a single sleep center and comprised participants of a single ethnicity (a Taiwanese population). These features might have limited the generalizability of the established arousal prediction models to other ethnicities. 61 Although PSG is the gold standard for diagnosing sleep disorders, its scoring for outcome determination is required to be manually completed by multiple technicians. This factor may result in inconsistent PSG scoring results, which could further affect the accuracy of PSG. 62 To address this problem, the sleep center from which the data were extracted regularly conducted interscore workshops to ensure consistency in the PSG scoring outcomes; however, scoring variability may still partially interfere with the scoring results. The distribution of OSA severity in the dataset may affect the performance of the model. However, in the enrolled data, a high frequency of sleep arousal and severe sleep-disordered breathing were observed, indicating a potential imbalance. To improve the model, a dataset with a more evenly distributed range of OSA severities should be used. The first-night effect, as a result of a change in the sleep environment due to PSG examination, might also have limited the accuracy of the results. More specifically, the first-night effect may change an individual's sleep architecture and position and indirectly alter their breathing patterns and arousal responses. 63 These manifestations may result in misestimated PSG outcomes and therefore could affect the reliability of the established models. Thus, to reduce the data bias caused by the first-night effect, future studies could consider including taking PSG measurements over multiple nights. Moreover, the accuracy of our analysis may be affected by the occasional inclusion of physiological signals from different sleep stages within the employed time window of 60 s. The reliability of HRV features derived from short-term EKG signals, particularly those in the frequency domain, requires further robust confirmation. 64 Additionally, although we conducted further analyses by using independent testing datasets to simulate scenarios and compare predictive outcomes from the proposed machine learning methods with arousal scoring by licensed PSG technologists, further research into alterations in both EEG signals and these easily obtainable parameters during sleep arousal events can enhance the robustness of the proposed models and shed light on relationships between these physiological signals. Future research should consider the potential effects of the inclusion of different sleep stages within the same 60-s segment and investigate the effect of using various window lengths and alterations between EEG and HRV signals during arousal events.
Next, this retrospective study obtained only data for medication, not those related to lifestyle information (e.g., cigaret smoking or alcohol consumption, menopausal status, comorbidities) or other factors that could be associated with both OSA and the frequent occurrence of sleep arousal responses. 65 Therefore, future studies are encouraged to include more parameters in their models. Furthermore, in a previous study, a questionnaire was conducted to screen for the risk of sleep arousal disorder 66 ; the accuracy of arousal detection could be increased by employing the responses to that questionnaire as predictors. Other factors, such as self-documented clinical symptoms (e.g., frequent awakening, snoring awareness, frequency of respiratory events or breathing pauses, and other symptoms), may serve as additional metrics for sleep arousal occurrence prediction. Therefore, a dataset with comprehensive dimensional features—including lifestyle information, health background, and other subjective clinical symptoms—should be considered in the development of novel classification approaches to enhance the robustness of outcomes.
Conclusions
To overcome the limitations of time and labor in current arousal prediction methods through PSG, this study developed arousal prediction models based on machine learning by using HRV, body profiles, and oximetry parameters measured during sleep. The accuracy of the eight established models in predicting the training dataset ranged from 64.36 to 76.65, with the InceptionTime model exhibiting the highest accuracy and largest AUC. This model was then used to predict the testing dataset and achieved an accuracy level of 76.89% and an AUC of 84.76%. Regarding the contribution of each parameter to prediction, the SDNN was the highest contributor, and the RMSSD and HR-mean were the second- and third-highest contributors, respectively. The prediction models developed in this study require easily obtainable parameters rather than brainwave signals for prediction. Therefore, they are suitable for the screening of sleep arousal occurrence in home-based settings in combination with wearable devices.
Supplemental Material
sj-docx-1-dhj-10.1177_20552076231205744 - Supplemental material for Machine learning approaches for predicting sleep arousal response based on heart rate variability, oxygen saturation, and body profiles
Supplemental material, sj-docx-1-dhj-10.1177_20552076231205744 for Machine learning approaches for predicting sleep arousal response based on heart rate variability, oxygen saturation, and body profiles by Chih-Fan Kuo, Cheng-Yu Tsai, Wun-Hao Cheng, Wen-Hua Hs, Arnab Majumdar, Marc Stettler, Kang-Yun Lee, Yi-Chun Kuan, Po-Hao Feng, Chien-Hua Tseng, Kuan-Yuan Chen and Jiunn-Horng Kang, Hsin-Chien Lee, Cheng-Jung Wu, Wen-Te Liu in DIGITAL HEALTH
Footnotes
Acknowledgments
The authors thank all of the participants for their involvement with this study as well as the technologists in the sleep center of Shuang Ho Hospital for collecting the raw data.
Contributorship
CFK, CYU, and WTL designed and conceived the study. CFK, CYU, WHC, and WHH researched literature and drafted the article. WHH and YCK conducted data curation. AM, PHF, JHK, and WTL revised manuscript critically. MS, CHT, and KYC provided the suggestions. KYL and HCL administered the project. WHC and CJW gained ethical approval. KYL approved the version to be published.
Declaration of conflicting interests
The authors declared no potential conflicts of interest with respect to the research, authorship, and/or publication of this article.
Ethical approval
The protocol of this retrospective study was thoroughly reviewed and approved by the Ethics Committee of Taipei Medical University's Joint Institutional Review Board (No. N202212067). All study procedures—including data collection, analysis, and preservation—strictly adhered to the guidelines of the approved protocol. Given the retrospective nature of this study, obtaining patient consent was deemed unnecessary in accordance with the ethical guidelines of the same committee.
Funding
The authors disclosed receipt of the following financial support for the research, authorship, and/or publication of this article: This work was supported by Taiwan’s National Science and Technology Council, (grant number NSTC 111-2634-F-002-021).
Guarantor
Wen-Te Liu
Data availability
All the data of this study were collected at the Sleep Center of Taipei Medical University–Shuang Ho Hospital (New Taipei City, Taiwan) between September 2019 and September 2021. Because our data set contains personal information, it is not available in the supplement file. For access to the data set or relevant documents, please contact the corresponding author.
Supplemental material
Supplemental material for this article is available online.
References
Supplementary Material
Please find the following supplemental material available below.
For Open Access articles published under a Creative Commons License, all supplemental material carries the same license as the article it is associated with.
For non-Open Access articles published, all supplemental material carries a non-exclusive license, and permission requests for re-use of supplemental material or any part of supplemental material shall be sent directly to the copyright owner as specified in the copyright notice associated with the article.