
Abstract
Objective
Detection of early osteoarthritis (EOA) of the knee is crucial for effective management and improved outcomes. This study investigated the application of machine learning techniques to single-leg standing (SLS) kinematics to classify and predict EOA. (1) To identify distinct groups based on SLS kinematic patterns using unsupervised learning algorithms, (2) to develop supervised learning models to predict EOA status, and (3) to identify the most influential kinematic variables associated with EOA.
Methods
Total 43 manufacturing workers (86 legs) aged 40–70 years were evaluated. The participants were categorized using an Early Osteoarthritis Questionnaire. Single-leg standing kinematics was captured using 2D video analysis to assess the horizontal displacement of six key anatomical points (trunk, pelvis, femur, knee, lower leg, and ankle) in the frontal plane. K-means clustering was used for unsupervised learning, whereas six supervised machine learning algorithms were trained and validated for EOA classification.
Results
In our machine learning models, we used 258 data points derived from three repeated measurements per participant. K-means clustering revealed three distinct groups based on SLS kinematics and demographic characteristics. The random forest algorithm achieved the highest classification accuracy (area under the receiver operating characteristic curve = 1.000, accuracy = 1.000) in distinguishing between individuals with and without EOA. Pelvic and ankle horizontal displacements were identified as the most influential predictors of EOA classification.
Conclusions
Machine learning analysis of SLS kinematics shows significant potential for the early detection of knee osteoarthritis. Identification of key kinematic predictors, particularly pelvic and ankle movements, provides new insights into targeted interventions and screening protocols for rehabilitation.
Introduction
Knee osteoarthritis (OA) is a progressive joint disease that affects millions of people worldwide and causes pain, stiffness, and a reduced quality of life. 1 Early detection and intervention in the initial stages of OA, known as early OA (EOA), has gained significant attention in recent years.1,2 Early diagnosis of OA can lead to more effective management strategies, potentially slowing disease progression, and improving long-term outcomes.3–5 However, current diagnostic methods often fail to identify OA until significant joint damage occurs, highlighting the need for more sensitive and specific tools to detect EOA. 2 Traditional imaging methods like X-rays often detect changes only after substantial cartilage loss has occurred, while early molecular and cellular changes remain undetected.2,4 This diagnostic gap is particularly problematic as the early stages of OA represent a crucial window for interventions that could potentially modify disease progression. 3
The etiology of OA is multifactorial and involves genetic, environmental, and biomechanical factors.6,7 Traditional research has focused on static factors such as knee alignment, Kellgren–Lawrence grade, 8 and genetic predisposition as primary risk factors for OA development and progression. 9 Varus malalignment is associated with an increased risk of medial compartment OA progression. 10 Genetic studies have identified several loci associated with the susceptibility. 11 These static factors have dominated OA research and provided valuable insights into disease susceptibility and progression. However, an emerging body of evidence suggests that dynamic factors, particularly repetitive and unnecessary compensatory movements, play a crucial role in the development and progression of OA. 12 Altered movement patterns can lead to abnormal joint loading, which may contribute to cartilage degradation and OA onset. Increased knee adduction moment during gait has been associated with a higher risk of OA progression. 13 This shift in focus from static to dynamic factors represents a significant advancement in our understanding of the pathogenesis of OA.
The effect of altered joint kinematics on the development of OA is particularly significant. Abnormal movement patterns can change the load distribution across the joint surface, exposing areas of the cartilage to stresses that they are not adapted to withstand. 12 This can initiate a cycle of tissue damage and biomechanical alterations. In addition, these altered movement patterns can trigger inflammatory responses in cartilage and subchondral bone, potentially initiating or accelerating the OA process. 12 Furthermore, compensatory movements adopted to avoid pain can create a vicious cycle, leading to additional joint stress and accelerated disease progression. 7 These changes in joint kinematics can be subtle during the early stages of disease, making them difficult to detect using conventional clinical assessments. 4 The ability to identify these subtle alterations may provide a crucial window for early intervention. 4
Single-leg standing (SLS) is a valuable functional task to assess balance and postural control in patients with knee OA.14–16 Studies have used the SLS as an outcome measure in OA research, focusing on balance time and postural stability. Predictors of SLS balance in patients with knee OA include radiographic severity, isometric quadriceps peak torque, and pain intensity. 14 Individuals with knee OA demonstrated significantly shorter SLS times than those in healthy controls. 16 However, these studies primarily focused on balance outcomes rather than examining specific joint kinematics during tasks. 15 Recent research has explored joint kinematics during SLS in individuals with knee OA. Patterns of interjoint coordination during SLS, particularly between ankle and hip movements in the frontal and transverse planes, have been identified. 17 Contralateral pelvic drop and trunk leaning significantly increase the knee adduction moment during SLS, potentially contributing to increased medial compartment loading in individuals with knee OA. 18 These findings suggest that analyzing joint kinematics during SLS may provide valuable insights into the biomechanical alterations associated with EOA. The value of SLS assessment lies not only in its ability to reveal balance deficits but also in its potential to unmask compensatory movement strategies that may not be apparent during bilateral standing or walking. 14 Furthermore, SLS creates a challenging environment that may amplify subtle movement abnormalities that could be early indicators of joint dysfunction. 16
Utilizing kinematic data from SLS in combination with machine learning techniques offers a promising approach for more accurate and early detection of OA. Machine learning algorithms can identify subtle patterns and relationships in complex datasets that may not be apparent using traditional statistical methods. Applying these techniques to SLS kinematic data may enable the development of more sensitive diagnostic tools for EOA, potentially enabling earlier interventions and personalized treatment strategies. Thus, the purpose of this study was to investigate the use of kinematic data obtained during SLS to classify and predict EOA using machine learning techniques. Specifically, this study aims to (1) use unsupervised learning algorithms to identify distinct groups based on SLS kinematic patterns, (2) develop supervised learning models to predict the EOA status, and (3) identify the most influential kinematic variables associated with EOA.
Materials and methods
Participants
Before participation, all the participants were thoroughly briefed on the study procedures, following which they provided written informed consent. The study protocol was reviewed and approved by the Sangji University Institutional Review Board (1040782-230814-HR-09-117) to ensure adherence to ethical research standards. This study recruited 43 manufacturing workers, aged 40–70 years, who were considered susceptible to OA. Manufacturing worker's data generated from musculoskeletal screening tests for preventing industrial accidents were used by visiting a musculoskeletal health care center in cosmetic manufacture company from October 2023 to March 2024. The participating manufacturing workers were employed in cosmetic product manufacturing, where their duties typically involved prolonged standing while performing repetitive assembly line tasks. Their work activities included product inspection, packaging, and quality control, all of which required maintained standing postures with occasional walking between workstations. This occupational setting was particularly relevant for our study as prolonged standing has been associated with increased load on knee joints and potential risk for developing knee disorders. The participants were categorized using the Early Osteoarthritis Questionnaire (EOAQ). 19 The experimental group comprised individuals who responded “frequently” or “rarely” to the first two questions of the EOAQ, which assess the early degenerative arthritis symptoms. The control group consisted of those who answered “never” to these questions. The experimental group included 42 legs (25 male and 17 female), whereas the control group included 44 legs (21 male and 23 female). The detailed participant characteristics and flowcharts are presented in Table 1 and Figure 1. The exclusion criteria were established to ensure a focused study population. Individuals were not eligible if they had sustained a lower-extremity injury within the previous six months, a history of hip surgery, rheumatoid arthritis, diagnosed OA, or neurological conditions. These criteria were implemented to minimize confounding factors that could influence the study outcomes.

Flowchart of machine learning algorithm development.
Participants characteristics.
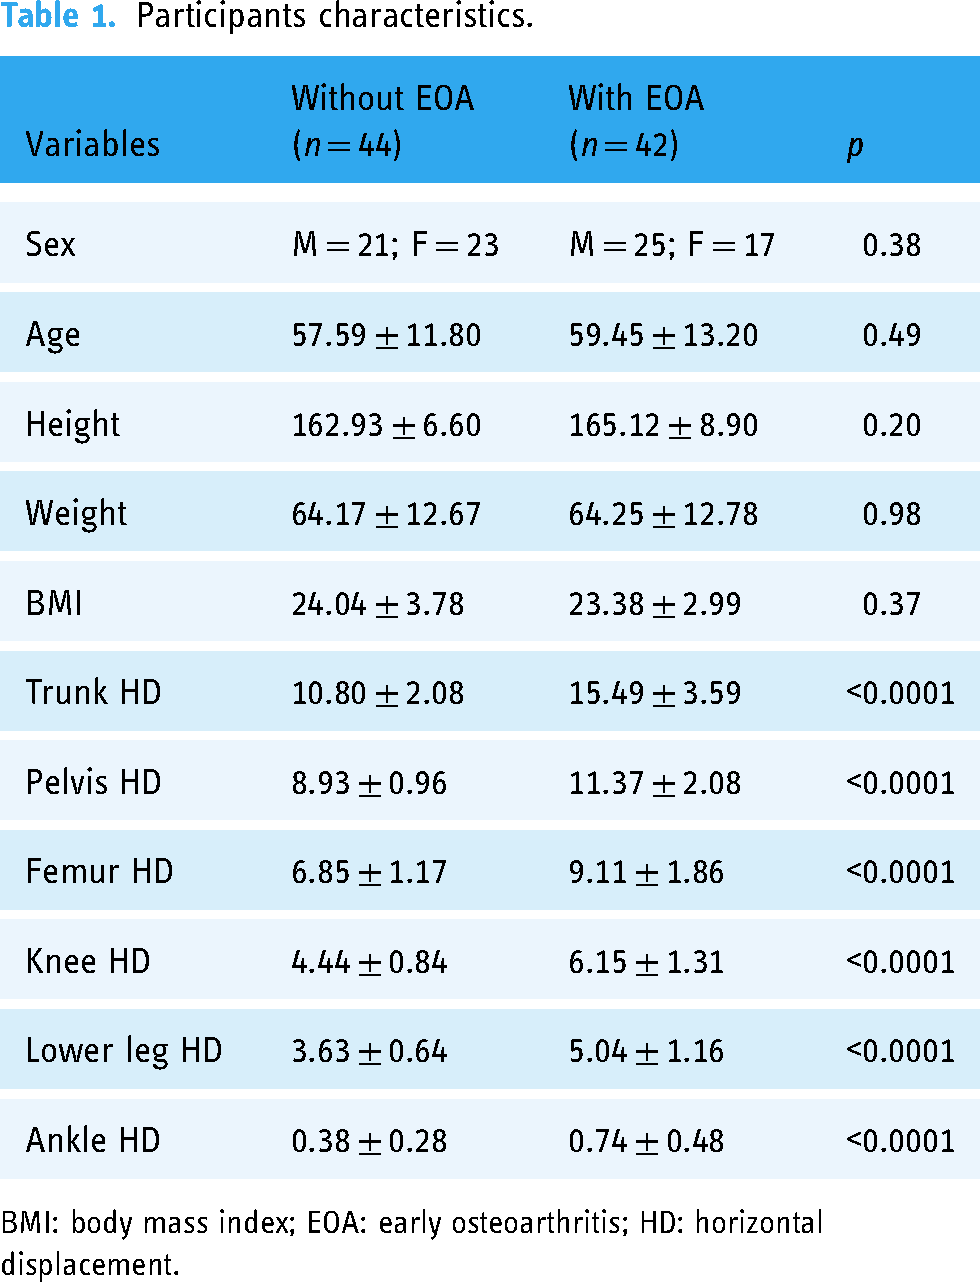
BMI: body mass index; EOA: early osteoarthritis; HD: horizontal displacement.
Early OA questionnaire
The EOAQ was used to categorize the participants into experimental and control groups. The EOAQ is a recently developed tool designed to assess knee OA in its initial stages and consists of 11 questions divided into two domains: clinical features (two questions) and patient-related outcomes (nine questions). Each question offers three response options based on the frequency of symptoms over the past six months: “Never,” “Rarely (1–3 episodes),” and “Frequently (more than 3 episodes).” This questionnaire aims to capture the subtle symptoms and functional limitations characteristic of early-stage knee OA, allowing for earlier identification and intervention in the disease process. 19
Kinematic measurements using two-dimensional video analysis
To capture kinematic data, we employed a high-resolution smartphone (iPhone 15; Apple Inc., USA) equipped with a 4 K video recording application (2556 × 1179 pixels at 240 fps). The device was securely mounted on a tripod positioned 60 cm above the ground and 250 cm in front of the participant. Following data collection, the video recordings were transferred to a specialized motion analysis software package (Kinovea® version 0.8.15; Kinovea, Bordeaux, France) for detailed examination.
Our study used two-dimensional video analysis to assess the horizontal displacement of six key anatomical points in the frontal plane during the SLS test (Figure 2). These points included the horizontal displacement of the trunk (THD), pelvis (PHD), femur (FHD), knee (KHD), lower leg (LHD), and ankle (AHD). Yellow spherical markers were strategically placed at the following anatomical landmarks: center of the sternum (for trunk), anterior superior iliac spine (for pelvis), midpoint of the femur's half-length (for femur), center of the patella (for knee), tibial tuberosity (for lower leg), and superior aspect of the navicular bone (for ankle). Using the Kinovea software, we tracked the movement of each marker throughout the 10-s SLS test. The software allowed us to quantify the maximum horizontal displacement of each marker during this period (Figure 2). This measurement provides crucial insights into joint stability because reduced horizontal movement is generally indicative of greater stability of the surrounding joint area. The magnitude and direction of the displacement values offer valuable information: larger positive values indicate greater lateral movement, while larger negative values signify greater medial movement. Values closer to zero suggest minimal joint movement and greater stability. Specifically, we analyzed THD, PHD, FHD, KHD, LHD, and AHD to comprehensively assess postural control and joint stability during the SLS task. By quantifying the maximum horizontal displacement of these key anatomical points, we aimed to provide a more comprehensive and precise understanding of the postural control strategies and potential compensatory mechanisms.
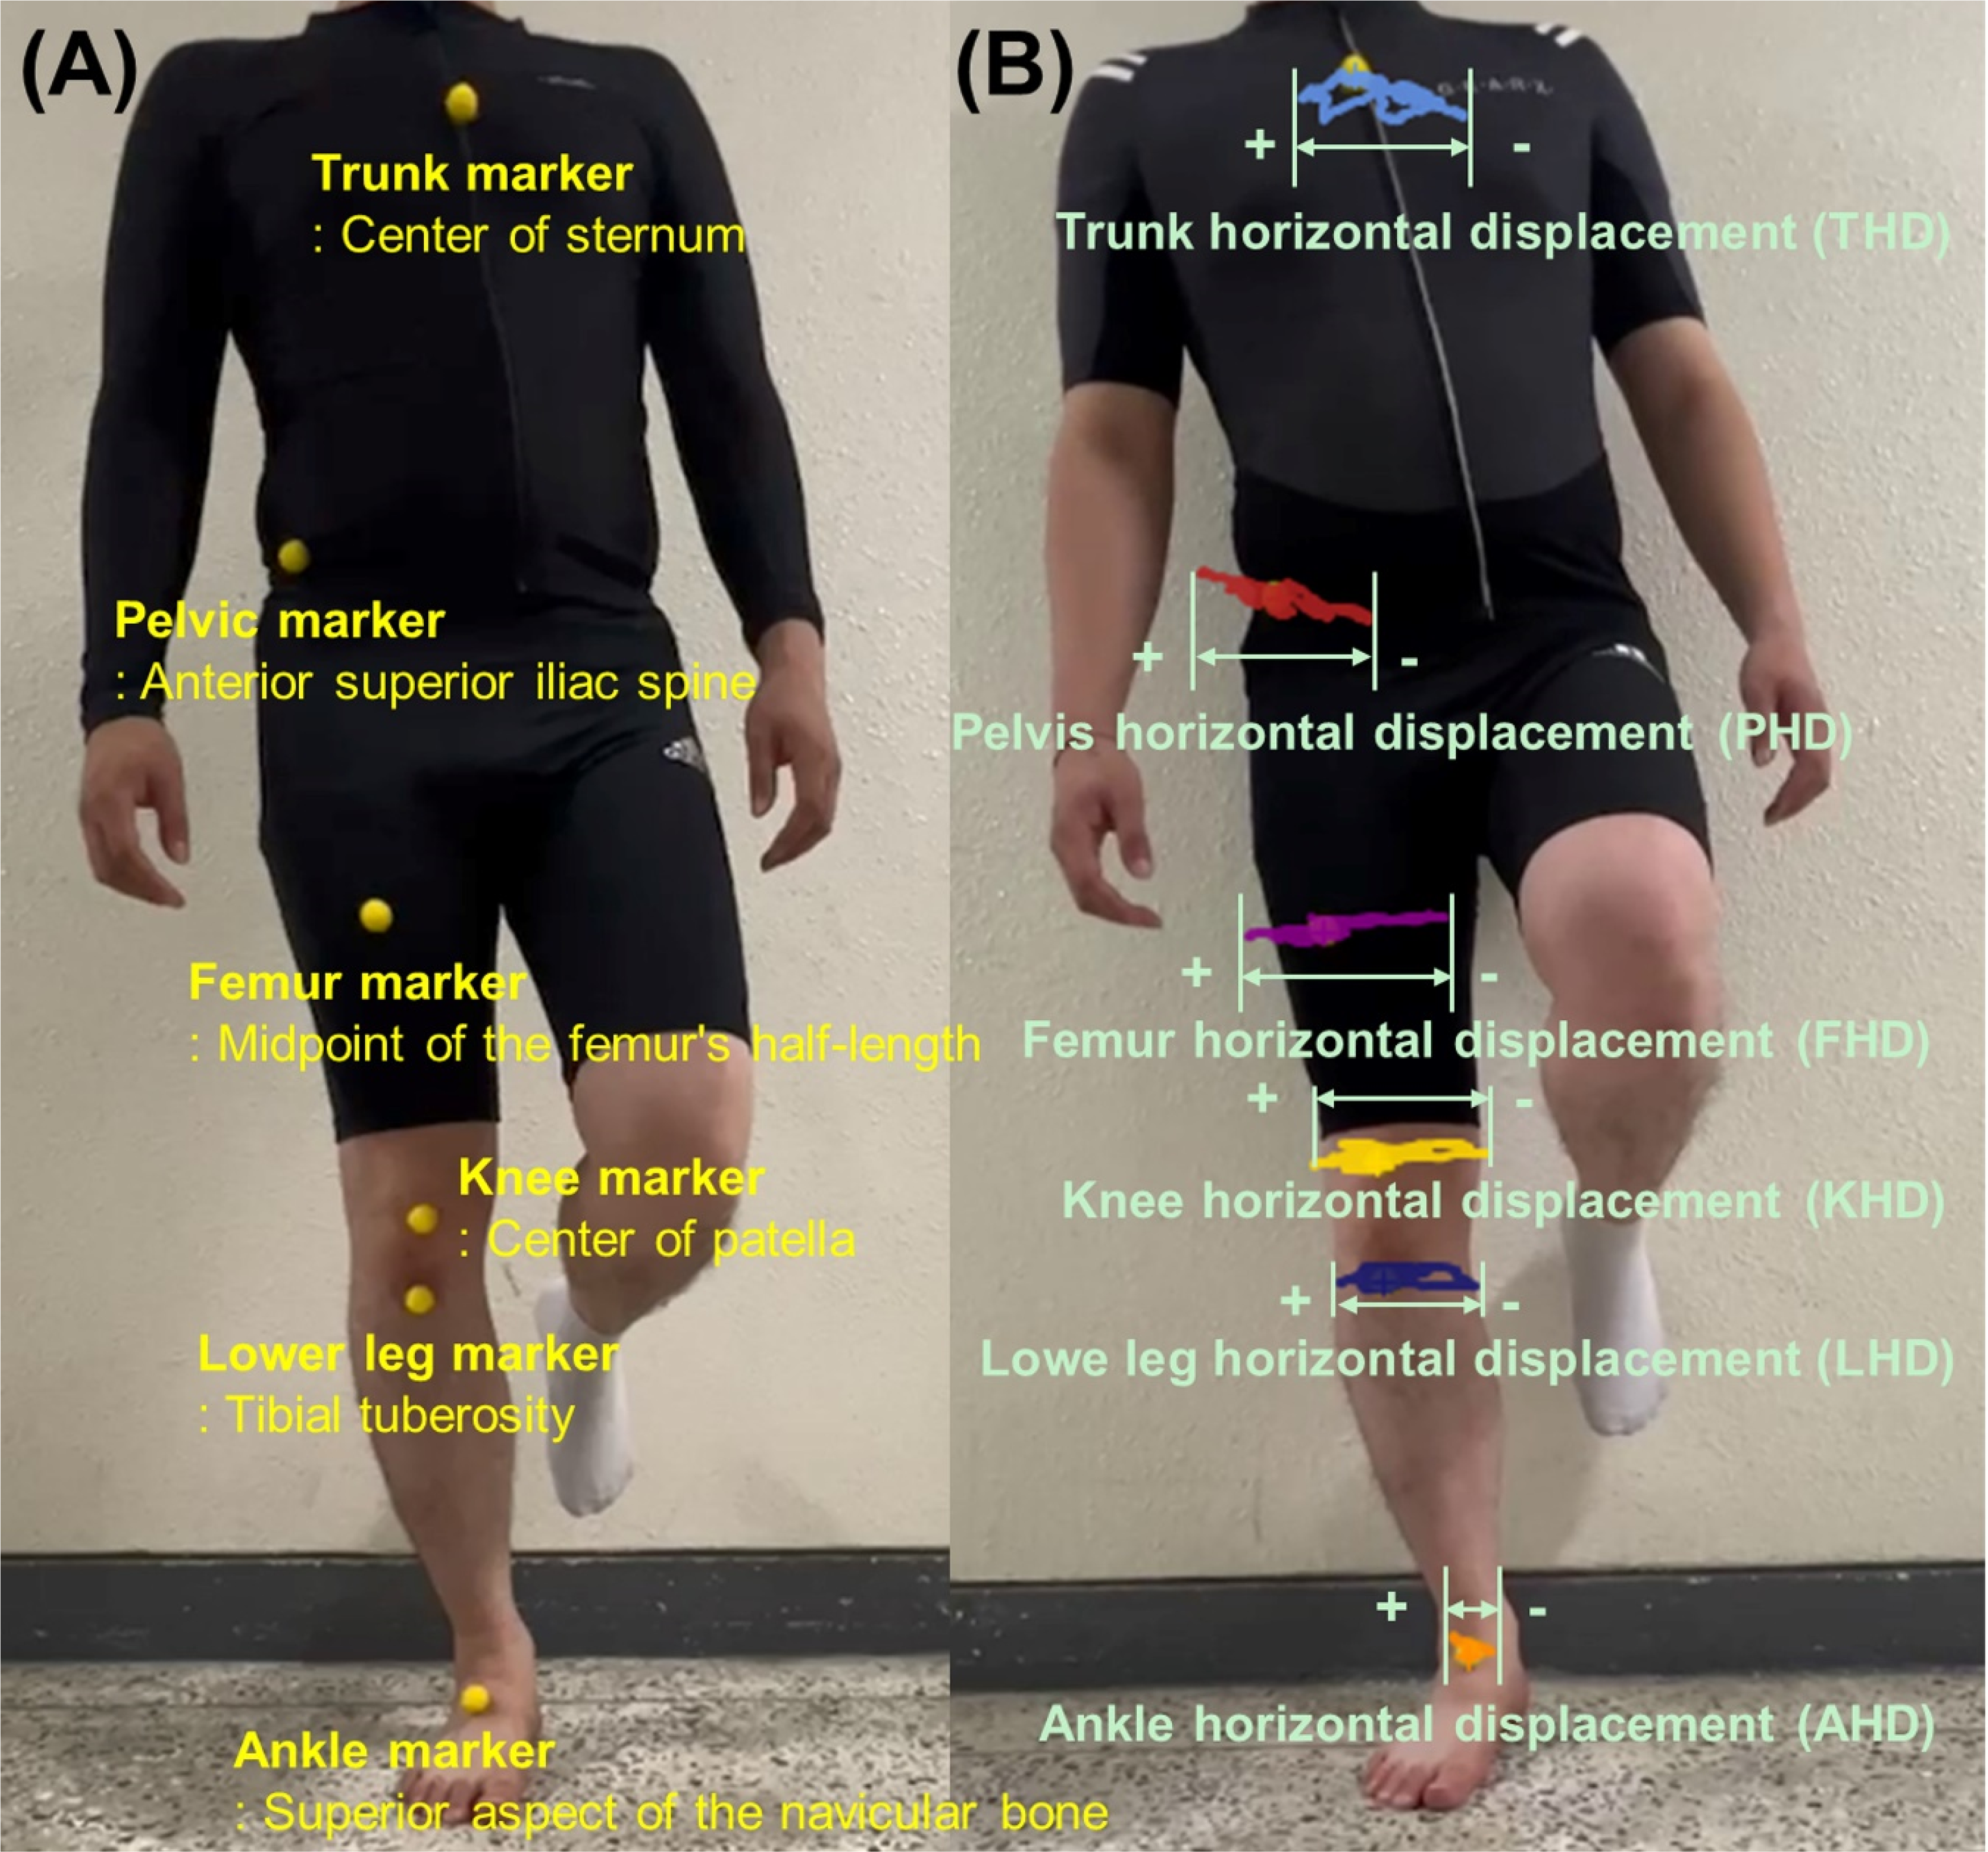
(A) Six yellow spherical markers in anatomical landmarks for single-leg standing (SLS) kinematic measurements using two-dimensional video analysis, (B) two-dimensional video analysis using Kinovea software to assess the horizontal displacement of six key anatomical points during the SLS test in the frontal plane.
Experimental protocol
The participants underwent a series of SLS tests, performing three trials for each leg (right and left). Prior to data collection, the participants were thoroughly familiarized with the testing protocol, received detailed instructions, and were allowed to practice attempts to ensure proper execution. To eliminate the potential variability from footwear, all participants performed the tests barefoot. The testing order of the legs was randomized to prevent order effects. The SLS test was conducted as follows: the participants were instructed to maintain a quiet, upright stance with their feet parallel to hip width. Upon a verbal cue, the participants lifted one leg, flexing the knee to approximately 90° while maintaining balance on the supporting leg for 10 s. The initial 2 s was designated as the transition period, and the subsequent 8 s was used for data analysis. Adequate rest periods were provided between trials to mitigate the effects of fatigue.
Statistical analysis
Unsupervised and supervised machine learning modeling and statistical analysis were performed using Orange data mining software (Orange 3.3.0, Ljubljana, Slovenia) and Python (Version 3.6.15; Python Software Foundation).
Descriptive statistics were calculated for all variables, with continuous variables presented as mean ± standard deviation. Between-group comparisons (EOA vs. non-EOA) for demographic and kinematic variables were performed using independent t-tests for continuous variables and chi-square tests for categorical variables, with statistical significance set at p < 0.05. For unsupervised machine learning, comparisons of features between K-means clusters were conducted using one-way ANOVA. For supervised machine learning model validation, performance metrics included area under the receiver operating characteristic curve (AUC), accuracy, precision, recall, and F1 score.
Pre-processing and missing data handling
Our analysis incorporated 11 features: sex, age, height, weight, body mass index (BMI), and six kinematic measures (THD, PHD, FHD, KHD, LHD, and AHD). In our machine learning models, we used 258 data points derived from three repeated measurements per participant. The EOAQ results were converted into binary outcomes indicating the presence or absence of EOA. We conducted exploratory data analysis to identify any missing values, which were subsequently addressed by eliminating incomplete cases.
We maintained our original kinematic variables without additional feature extraction or selection steps. This decision was made to preserve the clinical interpretability of our results, as each kinematic measure (THD, PHD, FHD, KHD, LHD, and AHD) represents a specific and clinically meaningful movement pattern during SLS. Understanding the relative importance of these specific anatomical point movements could directly inform clinical assessment and rehabilitation strategies. Our approach allows clinicians to easily translate our findings into practice by focusing on these readily observable movement patterns.
Unsupervised machine learning: k-means algorithm
To ensure model accuracy, we used boxplots to visualize the variable distributions and applied a local outlier factor method (parameters: 12% contamination, 20 neighbors, and Euclidean metric) for outlier removal. Subsequently, we developed an unsupervised clustering model for the SLS kinematic patterns using the K-means algorithm. Given the requirement of the algorithm for predefined cluster numbers, we explored a range of two to eight clusters. The model was initialized randomly with ten reruns and a maximum of 300 iterations per run. Determining the optimal number of clusters for partition clustering is challenging for single datasets. To address this issue, we utilized the average silhouette score as the optimization criterion. 20 This method evaluates both the intracluster similarity and intercluster distance for each data point. Silhouette scores ranged from 0 to 1, with higher scores indicating superior cluster categorization. We compared the 11 features across clusters using one-way ANOVA, with the statistical significance set at p < 0.05. For multiple comparisons, Bonferroni corrections were applied based on the number of clusters identified. This approach allowed us to rigorously assess the distinctiveness of the identified SLS kinematic patterns, while controlling for type I errors in our statistical analysis.
Supervised machine learning for classifying two groups
We used 11 features to classify the binary EOA outcomes. After excluding the missing data, we divided our dataset (n = 224) into training (80%, n = 180) and testing (20%, n = 44) sets. We trained six machine learning algorithms (k-nearest neighbors [kNN], decision tree, logistic regression, gradient boosting, random forest, and support vector machine) using 5-fold cross-validation.
Supervised machine learning model validation
Our primary performance metric was the AUC, which was computed for both the training and test sets and averaged across classes. Additionally, we considered secondary metrics, including precision, recall, and F1 score (the harmonic mean of precision and recall), and averaged across classes. We classified model performance based on AUC values as follows: excellent (≥0.9), good (0.8–0.9), fair (0.7–0.8), and poor (<0.7). 21
To determine the relative importance of the predictors, we employed two complementary techniques: feature permutation importance and the Shapley additive explanation (SHAP). For permutation importance, we assessed the impact on model performance (measured by the AUC change) by randomly shuffling the values of each feature. 21 The features that cause larger performance decrements upon permutation are considered more crucial. We also utilized SHAP values to provide a visual representation of the influence of each feature on the model predictions. We generated SHAP summary plots with predictors arranged on the y-axis in order of importance, with the most influential at the top. The x-axis displays the SHAP values, illustrating both the magnitude and direction of each feature's impact on the model output. This approach offers valuable insight into the specific ways in which different variables shape our predictions, thereby enhancing the interpretability of our machine learning models.
Results
Participants characteristics
A total of 86 participants were included in this study, with 44 and 42 individuals in the non-EOA and EOA groups, respectively (Table 1). No significant differences were noted between the groups in terms of sex distribution (p = 0.38), age (p = 0.49), height (p = 0.20), weight (p = 0.98), or BMI (p = 0.37). In addition, significant differences were observed in all the SLS kinematics. The EOA group demonstrated significantly higher THD (p < 0.0001), PHD (p < 0.0001), FHD (p < 0.0001), KHD (p < 0.0001), LHD (p < 0.0001), and AHD (p < 0.0001) values during the SLS test than that recorded in the non-EOA group.
Comparisons of features between k-means clusters
The silhouette score was highest when the number of clusters was three (silhouette score = 0.262), ranging from two to eight (range of silhouette score: 0.209–0.262). Consequently, the optimal number of clusters for k-means clustering was 3. The K-means clustering algorithm revealed three distinct clusters, each with unique characteristics and significant differences across all variables (p < 0.0001) (Table 2). Cluster 1 (n = 69) was predominantly composed of individuals with EOA (66 out of 69) and had the highest mean age (63.74 ± 8.40 years). This cluster exhibits the highest values for all SLS kinematics. Cluster 2 (n = 88) was characterized by the lowest mean values for most SLS kinematics and primarily consisted of individuals without EOA (69 out of 88). This cluster had a similar mean age (64.15 ± 8.20 years) to Cluster 1 but showed significantly lower SLS kinematics across all parameters. Cluster 3 (n = 43) presented a distinct profile with the youngest mean age (40.30 ± 9.30 years), highest mean height (172.84 ± 8.10 cm), weight (79.20 ± 7.87 kg), and BMI (26.49 ± 1.65). Interestingly, Cluster 3 was entirely composed of male participants and showed intermediate values for most SLS kinematics between Clusters 1 and 2. The distribution of EOA in Cluster 3 was nearly even (21 without OA, 22 with OA). Post hoc Tukey HSD tests revealed significant differences (p < 0.05) between most cluster pairs for most variables, with the exception of BMI comparisons between Clusters 1 and 2 and AHD comparisons between Clusters 2 and 3.
Comparisons of features between clusters classified by k-means unsupervised machine learning.

BMI: body mass index; EOA: early osteoarthritis; EOAQ: Early Osteoarthritis Questionnaire; HD: horizontal displacement.
Classifying models of machine learning
The performances of the six ML models in classifying groups with and without EOA during model training and testing are summarized in Table 3. The random forest (AUC, 0.997 [excellent]; Accuracy, 0.950), gradient boosting (AUC, 0.977 [excellent]; Accuracy, 0.944), logistic regression (AUC, 0.977 [excellent]; Accuracy, 0.928) and support vector machine (AUC, 0.973 [excellent]; Accuracy, 0.878) algorithms demonstrated excellent predictive performance, with AUC values exceeding 0.95 using the training dataset. Random forest algorithm model for classifying groups with and without EOA had the highest AUC using the test dataset (AUC, 1.000 [excellent]; accuracy, 1.000). Regarding the feature permutation importance, SHAP, PHD, and AHD were the top predictors for classifying groups with and without EOA in the random forest model (Figure 3).

(A) Feature permutation importance of random forest model in the training set for classifying groups between with and without EOA, (B) Shapley additive explanation analyses of random forest model in the training set for classifying groups between with and without EOA.
For classifying groups between with and without EOA, performance metrics of six machine learning algorithms in the training and test dataset.
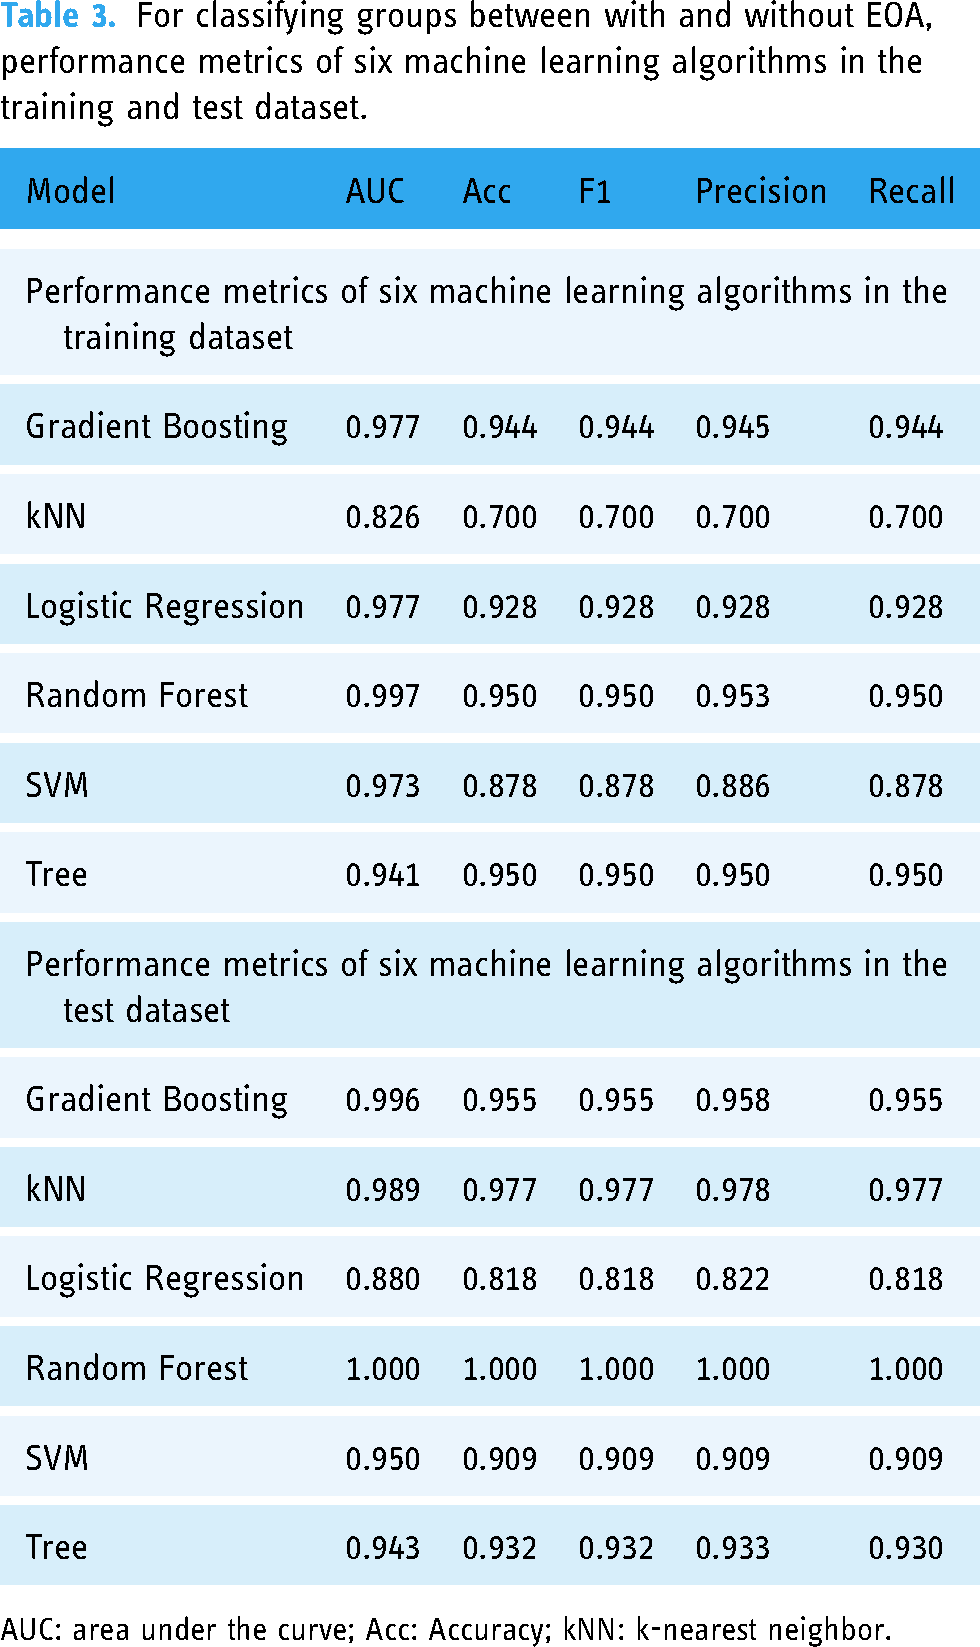
AUC: area under the curve; Acc: Accuracy; kNN: k-nearest neighbor.
Discussion
Our findings revealed distinct kinematic patterns associated with EOA and highlighted the predictive power of whole-body movement analysis for identifying early joint changes. The K-means clustering algorithm identified three distinct groups with unique kinematic and demographic characteristics, whereas our supervised machine learning models, particularly the random forest algorithm, achieved excellent classification accuracy (AUC = 1.000, accuracy = 1.000) in distinguishing between individuals with and without EOA. The application of machine learning to SLS kinematics extends beyond traditional balance assessments to provide a powerful predictive tool for EOA.1,16,22 This approach not only enhances early detection capabilities but also identifies key kinematic variables that can guide targeted rehabilitation strategies. The importance of pelvic and ankle kinematics in our models aligns with previous findings regarding their role in knee OA biomechanics, suggesting that rehabilitation programs should address these factors along with knee-specific interventions.23–25 Moreover, the high accuracy of our machine learning models indicates the potential for developing more sensitive screening tools for earlier and more personalized interventions in individuals at risk of or in the early stages of knee OA. 26
The unsupervised k-means clustering algorithm identified three distinct groups, each with unique kinematic and demographic characteristics, providing novel insights into the heterogeneity of EOA presentation. Cluster 1, predominantly composed of individuals with EOA, exhibited the highest values for all SLS kinematic parameters. This aligns with several previous studies that investigated postural control in individuals with knee OA. Individuals with early-stage knee OA demonstrated significantly greater trunk and hip sway during SLS than in healthy controls. 27 Similarly, increased mediolateral center of pressure displacement has been reported in individuals with mild-to-moderate knee OA compared to that in controls. 28 Our findings of increased movement across various joint segments not only corroborate these studies but also extend them by providing a more comprehensive view of whole-body kinematics in the EOA. These results suggest that rehabilitation programs for individuals with EOA should focus on improving multi-joint coordination and overall postural stability rather than solely targeting the knee joint.
The identification of Cluster 2, primarily consisting of individuals without EOA and showing the lowest mean values for most SLS kinematic parameters, is consistent with multiple studies on postural control in healthy individuals. Individuals with knee OA have been found to exhibit significantly greater center of pressure displacement in both the anterior–posterior and medial–lateral directions during SLS than in healthy controls. 16 Additionally, older adults with knee OA demonstrate greater postural sway in both eyes-open and eyes-closed conditions than that in healthy age-matched controls. 22 Our results not only confirm these findings but also suggest that individuals without EOA may have more efficient postural control strategies, requiring less compensatory movement during SLS.
Interestingly, Cluster 3 presented a distinct profile of younger male participants with intermediate SLS kinematic values. This mixed composition of EOA and non-EOA individuals aligns with the complex interplay between the risk factors for OA development. Genetic factors account for approximately 50% of the risk of knee OA; age and sex also play significant roles. 11 Furthermore, a systematic review highlighted the multifactorial nature of OA risk, including biomechanical, genetic, and demographic factors. 29 Our findings underscore the importance of considering these diverse factors in EOA assessment and highlight the potential of machine learning approaches to capture and analyze this complexity. This suggests the need for a more personalized approach to assessment and treatment that considers individual risk factors and movement patterns.
Our supervised machine learning models demonstrated excellent performance in classifying the EOA status, with the random forest algorithm achieving perfect accuracy on the test dataset (AUC = 1.000, accuracy = 1.000). This high predictive accuracy is comparable to, and in some cases, exceeds, that of previous studies that used machine learning for OA classification. An AUC of 0.88 was achieved using 3D convolutional neural networks on MRI data for knee OA classification. 26 A study using machine learning techniques on knee MRI data achieved an AUC of 0.88, predicting knee OA progression over 48 months. 30 The performance of our model, achieving perfect classification using only SLS kinematics, suggests that simple, clinically feasible tests, such as SLS, could provide powerful diagnostic tools when combined with advanced analytics for more accurate, and early identification of individuals at risk of OA progression.
While our machine learning approach to SLS kinematic analysis shows promise, it is important to explain its limitations compared to established methods. Traditional diagnostic approaches like radiographic imaging provide direct visualization of joint structures and remain the gold standard for confirming OA diagnosis. Our method, while potentially more sensitive to early changes, cannot directly visualize joint damage. Additionally, while clinical assessments such as pain scales and functional questionnaires provide immediate patient-reported outcomes, our kinematic analysis requires specific equipment setup and post-processing. However, our approach offers unique advantages in detecting subtle movement pattern changes that might precede structural damage, potentially enabling earlier intervention. Furthermore, unlike static imaging, our method captures dynamic functional deficits during a weight-bearing task, providing complementary information about joint function rather than just structure. Future research should focus on integrating these various approaches to provide a more comprehensive assessment of EOA.
Feature importance analysis consistently identified PHD and AHD as the most influential predictors across the different methods. This finding underscores the importance of whole-body kinematics in understanding the EOA, which extends beyond the knee joint. The significance of pelvic movement aligns with that reported in several other studies. A 10° increase in contralateral pelvic drop during SLS has been associated with a 7% increase in the external knee adduction moment (p < 0.001), a key factor in knee OA progression. 18 Moreover, altered pelvic kinematics in individuals with knee OA during gait have been reported, including increased pelvic tilt range of motion compared to controls. 24 These findings suggest that interventions for EOA should incorporate exercises targeting pelvic stability and control. The importance of ankle displacement in our models suggests that distal joint compensation plays a crucial role in the EOA. In addition, individuals with severe knee OA demonstrated a reduced ankle plantar flexion moment during late stance and reduced ankle power generation during push-off compared with those with moderate OA and asymptomatic controls. 23 Additionally, significant differences in ankle plantar flexion moments during gait among severe OA, moderate OA, and asymptomatic groups have been reported. 23 Our results extend these findings to SLS tasks and highlight the potential of ankle kinematics as a marker for EOA detection. This emphasizes the need for comprehensive lower limb assessments and interventions that address not only knee but also ankle function in individuals with or at risk of EOA.
The findings of this study have several important clinical implications. Our SLS kinematic analysis combined with machine learning could be implemented as a screening tool in occupational health settings, particularly for manufacturing workers who are at risk of developing knee OA. This method requires minimal equipment (a standard smartphone camera and basic markers), making it both cost-effective and accessible for clinical practice. The machine learning algorithms could provide clinicians with immediate, objective assessments of movement patterns, potentially enabling early identification of workers at risk for EOA. Moreover, the identification of key kinematic predictors (particularly pelvic and ankle movements) offers specific targets for preventive interventions and rehabilitation programs. Future developments could include integration with existing clinical assessment systems through mobile applications, making it easier for healthcare providers to incorporate this assessment into routine screenings.
Our study had several limitations. First, its cross-sectional design prevented us from establishing causal relationships between SLS kinematics and EOA development. Longitudinal studies are required to elucidate the evolution of these movement patterns over time and their predictive value in OA progression. Second, although our 2D video analysis provided valuable insights, future research using 3D motion capture could offer more comprehensive kinematic data. Third, while we used the EOAQ, we did not conduct a specific validation study of this questionnaire in our population of manufacturing workers. The lack of validated Korean version of EOAQ and the absence of pilot testing in our specific population should be considered when interpreting our results. Future studies should include formal validation of the EOAQ in different occupational populations and cultural contexts to ensure its reliability and validity across diverse settings. Finally, our sample size, which was sufficient for our analysis, could be expanded in future studies to enhance the generalizability and allow for more detailed and stratified subgroup analyses. Furthermore, our study did not include a formal a priori sample size calculation, which could potentially affect the statistical power of our findings. While our sample size (n = 43, 86 legs) was sufficient to demonstrate significant differences between groups and achieve high classification accuracy in our machine learning models, future studies should include power calculations to determine optimal sample sizes for similar analyses. While we implemented various measures to prevent overfitting in our machine learning models, our relatively modest sample size (n = 43 participants, 258 data points) may still present a risk of overfitting despite these preventive measures. Future studies with larger sample sizes would be valuable to further validate our findings and ensure robust generalization of the models.
Conclusions
Our study demonstrates the significant potential of machine learning analysis of SLS kinematics for the early detection of knee OA. The identification of key kinematic predictors, particularly pelvic and ankle movements, provides new avenues for targeted interventions and screening protocols. These findings build upon and extend the previous research in this field by offering a novel approach that combines simple clinical tests with advanced analytical techniques. This study underscores the importance of whole-body movement analysis for EOA assessment and treatment and suggests that rehabilitation programs should address knee joint function, pelvic stability, and ankle kinematics. Future research should focus on validating these findings in larger and more diverse populations, exploring the integration of kinematic analysis with other biomarkers for comprehensive EOA risk assessment, and developing specific physical therapy protocols based on individual movement patterns identified through machine learning analysis.
Supplemental Material
sj-xlsx-1-dhj-10.1177_20552076251326226 - Supplemental material for Machine learning for clustering and classification of early knee osteoarthritis using single-leg standing kinematics
Supplemental material, sj-xlsx-1-dhj-10.1177_20552076251326226 for Machine learning for clustering and classification of early knee osteoarthritis using single-leg standing kinematics by Ui-Jae Hwang, Kyu Sung Chung and Sung-Min Ha in DIGITAL HEALTH
Supplemental Material
sj-docx-2-dhj-10.1177_20552076251326226 - Supplemental material for Machine learning for clustering and classification of early knee osteoarthritis using single-leg standing kinematics
Supplemental material, sj-docx-2-dhj-10.1177_20552076251326226 for Machine learning for clustering and classification of early knee osteoarthritis using single-leg standing kinematics by Ui-Jae Hwang, Kyu Sung Chung and Sung-Min Ha in DIGITAL HEALTH
Footnotes
Acknowledgments
The authors would like to thank all participants in our study for their active participation and cooperation.
The datasets analyzed during the current study are available from the corresponding author on reasonable request.
Contributorship
UJH and SMH contributed to conceptualization, methodology, writing—original draft and visualization. KSC and SMH contributed to supervision and project administration. KSC contributed to data curation, validation, and software. UJH contributed to data curation and formal analysis.
Declaration of conflicting interests
The authors declared no potential conflicts of interest with respect to the research, authorship, and/or publication of this article.
Ethical approval
The present study conformed to the ethical guidelines of the 1975 Declarations of Helsinki. This study was approved by the Sangji University Institutional Review Board. Informed consent for publication of the images was obtained from the patient.
Funding
Sangji University Research Fund, (grant number 2023-29).
Guarantor
SMH.
Supplemental material
Supplemental material for this article is available online.
References
Supplementary Material
Please find the following supplemental material available below.
For Open Access articles published under a Creative Commons License, all supplemental material carries the same license as the article it is associated with.
For non-Open Access articles published, all supplemental material carries a non-exclusive license, and permission requests for re-use of supplemental material or any part of supplemental material shall be sent directly to the copyright owner as specified in the copyright notice associated with the article.