
Abstract
Introduction
Chronic diseases have become one of the main causes of premature death all around the world in recent years. The diagnosis of chronic diseases is time-consuming and costly. Therefore, timely diagnosis and prediction of chronic diseases are very necessary.
Methods
In this paper, a new method for chronic disease diagnosis is proposed by combining convolutional neural network (CNN) and ensemble learning. This method utilizes random forest (RF) as the base classifier to improve classification performance and diagnostic accuracy, and then combines AdaBoost to successfully replace the Softmax layer of CNN to generate multiple accurate base classifiers while determining their optimal attributes, achieving high-quality classification and prediction of chronic diseases.
Results
To verify the effectiveness of the proposed method, real-world Electronic Medical Records dataset (C-EMRs) was used for experimental analysis. The results show that compared with other traditional machine learning methods such as CNN, K-Nearest Neighbor, and RF, the proposed method can effectively improve the accuracy of diagnosis and reduce the occurrence of missed diagnosis and misdiagnosis.
Conclusions
This study will provide effective information for the diagnosis of chronic diseases, assist doctors in making clinical decisions, develop targeted intervention measures, and reduce the probability of misdiagnosis.
Introduction
Nowadays, the premature mortality rate of patients with chronic diseases such as cardiovascular disease, cerebrovascular disease, diabetes, and hypertension is gradually increasing.1,2 Timely diagnosis and treatment are crucial for reducing the mortality rate, prolonging life expectancy, and improving the living quality of patients with chronic diseases. 3 However, chronic diseases often have the characteristics of complex etiology, long course, and poor prognosis. 4 Therefore, it is of great significance to find appropriate methods to detect and predict chronic diseases in time and make effective treatment decisions.5,6
With the development of computer science and information technology, scholars have found that collecting data related to chronic diseases and using deep learning methods to extract data features and classify them is an effective method for diagnosing chronic diseases.7,8 Deep learning is a branch of machine learning that can be used to achieve more effective feature extraction and classification due to its ability in processing natural language, recognizing speech sounds and images, and many other areas. 9 Convolutional neural network (CNN) is a kind of deep feed-forward neural network including convolutional calculation, which is one of the representative algorithms of deep learning and is commonly used in image classification and natural language processing,10,11 and has achieved excellent results in many fields such as traffic sign recognition, medical image segmentation, video processing, object recognition, and speech recognition. 12 In addition, research has shown that combining CNN with other deep learning methods can effectively improve the accuracy of classification tasks.13,14 For example, Lu et al. 15 combined CNN algorithm with bi-directional long short-term memory (BiLSTM) and attention mechanism (AM) to achieve effective stock price prediction.
Some scholars have applied CNN for disease diagnosis and prediction. For example, Pai et al. 16 combined CNN and U-Net to identify the presence of acute respiratory distress syndrome. Mohammed and Al-ani 17 proposed a deep CNN method to enhance the quality of brain tumor diagnosis, thus improving the accuracy of feature learning, extraction and classification based on magnetic resonance imaging (MRI) images. Furthermore, some scholars have combined CNN with other deep learning methods to diagnose and predict diseases. For example, Wang et al. 18 combined CNN and BiLSTM to predict chronic diseases associated with a given Electronic Medical Record (EMR) and assist doctors in effective diagnosis. Sharifrazi et al. 19 used CNN and K-means clustering methods to cluster MRI images of myocarditis, and then classified the myocarditis data and extracted disease features.
Numerous studies and applications have shown that CNN has strong feature extraction and expression capabilities, and can automatically train weights without manual feature extraction. However, when dealing with categories with small feature differences, CNN's Softmax classifier will directly select the category with the highest classification results, without considering other categories, which will lead to other potentially correct disease diagnosis results being directly ignored by the classifier, increasing the possibility of misdiagnosis. In addition, when faced with imbalanced data, CNN has poor classification performance. 20
In recent years, as another common deep learning method, ensemble learning has gained popularity due to its excellent ability in model training and learning.21,22 In fact, the core idea of ensemble learning is to learn several weak classifiers and use these weak classifiers to form a strong classifier, thereby generating more accurate classification results than any single classifier.23,24,25 The most commonly used methods related to ensemble learning are Bagging 26 and Boosting, 27 , and AdaBoost is the mainstream algorithm of Boosting. 28 Scholars often apply these methods to many different fields, such as target prediction, 29 error detection, 30 image recognition, 31 and text classification.32,33 For example, Yang et al. 31 used the AdaBoost algorithm to achieve the classification of precipitation types using radar map data.
In the field of healthcare, scholars often use one or a combination of multiple ensemble learning methods to improve the effectiveness and accuracy of data classification, thus improving the credibility of disease diagnosis results. For example, Chen and Pan 34 used AdaBoost and LogitBoost algorithms of Boosting, respectively for their excellent ability in classification, to construct a diabetes diagnosis machine model for clinical trial data of diabetic patients. Omotosho et al. 35 combined the Bagging method and the AdaBoost method to achieve higher accuracy in heart disease diagnosis and prediction.
Previous studies have mainly focused on using a single CNN or ensemble learning method to identify a single chronic disease, while few studies have combined these two methods to classify and diagnose various common chronic diseases. In order to avoid the deficiencies caused by the use of a single method, some scholars have tried to combine CNN with the AdaBoost algorithm in ensemble learning.36,37 For example, Taherkhani et al. 38 proposed a new machine learning method called AdaBoost-CNN. Compared with traditional AdaBoost or CNN methods, their method not only reduced the calculation time and cost of the test, but also effectively improved the accuracy of test results.
When processing a large amount of training data, the combination of CNN and AdaBoost is conducive to improving training accuracy, reducing training time and improving classification performance. However, when dealing with imbalanced datasets, their classification accuracy may decrease. In fact, most of the existing studies on disease diagnosis use non-missing data, while a large amount of EMR data has missing attribute values, and the data amount is often extremely imbalanced. Therefore, it is difficult to process imbalanced and missing EMR datasets39,40 by using the previous methods, no matter using the algorithm alone or just combining CNN and AdaBoost.
Random forest (RF) is a variant of Bagging. 41 Like AdaBoost, it belongs to ensemble learning algorithms, but their difference is that AdaBoost is a sequential ensemble learning algorithm, 42 while RF is a parallel ensemble learning algorithm. 43 The research results indicate that the use of RF can effectively solve the problem of missing attributes and imbalance datasets, 44 and can also determine the importance of features and the mutual influence between different features, and minimize noise and redundant data by selecting critical features. 45 However, for data with attribute that have different values, attributes with more values divisions will have a greater impact on RF, so the attribute weights generated by RF on such data is not credible. 46
In summary, CNN, AdaBoost, and RF methods have been successfully applied in the field of healthcare. However, there are still the following problems in specific research: 1. When using CNN alone to handle categories with small feature differences, other potentially correct disease diagnosis results may be directly ignored by the classifier, thereby increasing the possibility of misdiagnosis. 2. During the experimental research process, the amount of data obtained from different diseases is prone to extreme imbalance, and the classification accuracy of CNN and AdaBoost in processing imbalanced datasets needs to be improved. 3. When using RF, the attribute weights of sample data have a significant impact on the effectiveness of classification. 4. Most of the existing studies focus on one or several chronic diseases, and are mostly based on English EMR. The application of Chinese EMR is currently limited by factors such as patient privacy, information security, storage methods, and data integration. Therefore, the research on Chinese EMR is still relatively few.
In response to these issues, we propose a chronic disease diagnosis model, namely CNN-ABRF, combining CNN, AdaBoost, and RF to improve the classification accuracy when processing imbalanced datasets, thereby achieving effective feature extraction and disease classification.
Specifically, the CNN-ABRF model can utilize the advantages of RF in processing imbalanced data to determine the impact and importance of features, solve the shortcomings of CNN and AdaBoost in processing imbalanced data, as well as the classification error of CNN when feature differences are small, and utilize the advantages of CNN and AdaBoost in automatically training attribute weights to reduce the impact of attribute weights on RF. And then, it is applied to the diagnosis of chronic diseases in a real-world EMRs dataset (C-EMRs) 47 with imbalanced characteristics. 48 The contribution of the paper lies in as follows: (a) build an RF-based AdaBoost ensemble learning algorithm, called ABRF, to replace the Softmax layer in the CNN algorithm and improve the classification performance of the model; (b) use EMR data to verify the model effectiveness and expand the application scope of Chinese EMR; and (c) classify and diagnose 10 common chronic diseases, effectively improving the diagnostic efficiency of chronic diseases and assisting doctors in diagnosis.
The rest of this paper is organized as follows. Section 2 describes the proposed method, and Section 3 shows the experimental evaluation index and results. Section 4 discusses the scope of future applications of the proposed method as well as the existing limitations. Finally, Section 5 features the paper's conclusion.
Methods
Design and dataset
The current evidence-based medicine research faces challenges such as clinical heterogeneity 49 and sample size and quality limitations, 50 leading to bias and limitations in research results. And, real-world medical data has been accumulated, but has not yet been fully and effectively utilized. In response to this situation, real-world research has begun to emerge and is rapidly developing. 51 And machine learning is an important method and tool for achieving real-world research, therefore, our proposed method mainly achieves real-world research through machine learning.
Design
The study is a real-world research; we propose a chronic disease diagnosis model based on CNN and ensemble learning algorithm to achieve precise and effective chronic disease diagnosis through feature extraction and classification, helping patients detect diseases and assisting physicians develop treatment plans promptly. And, we applied our model to the chronic disease EMRs dataset, and verified its positive role in improving the quality of chronic disease diagnosis.
In this model, we first combine the AdaBoost algorithm with RF, which is noted as ABRF, and then combine it with CNN. The overall analysis framework is divided into three steps as follows: feature extraction, feature classification, and diagnostic result generation, as shown in Figure 1. In the first step, we use CNN to extract the features of chronic disease symptoms from the word vectors generated after data preprocessing. In the second step, we take the features extracted in the first step as the input content of AdaBoost + random forest (ABRF), and use AdaBoost to integrate the learning of multiple RFs, to improve the classification performance and finally get the disease diagnosis results.

Analysis framework of disease diagnosis model based on CNN and ensemble learning method.
Dataset
We use the real EMRs dataset (C-EMRs) for verification. The dataset is imbalanced, with a wide variation in the number of EMRs labeled for different diseases. For example, there are 5642 diabetes records but only 289 urinary tract infections. To solve this problem, we use ABRF to alleviate the impact of data imbalance on the diagnostic results of the model.
The C-EMRs we used in the experiment were collected from 18,590 patients with chronic diseases in Huangshi Central Hospital, Hubei Province, China, covering the 10 most common chronic diseases as follows: hypertension, diabetes, chronic obstructive pulmonary disease, gout, cardiac arrhythmia, asthma, gastritis, stomach polyps, gastric ulcer, and urinary tract infection. The size of each disease dataset is: hypertension (3946), diabetes (5642), chronic obstructive pulmonary disease (3299), gout (657), cardiac arrhythmia (1451), astroma (1075), gastritis (1069), stomach polymers (729), gastric ulcer (436), and urinary tract infection (289), all of which are divided into training, validation, and testing sets in a 6:1:3 ratio. The entries in each EMR are as follows: first visit, chief complaint, surgery history, vital signs, special status, general status, allergy history, nutritional status, suicide ideation, specialty examination, surgical trauma history, complications, history of presenting complaint, childbearing history, assistant examinations, personal history, past medical history, and family history, and the basic content of specific entries are shown in Table 1. And, the data is represented in structured and unstructured free text.
Basic content of specific entries.

EMR: Electronic Medical Record.
In order to protect patient privacy, we removed personal information such as patient name, gender, age, work unit, or address from the EMRs in the dataset.
Process
Our method involves three steps: feature extraction based on CNN, feature classification based on ABRF, and output of disease diagnosis results.
The first step: feature extraction based on CNN
TextCNN 52 is a text classification model based on CNN proposed by Yoon Kim in 2014. Due to its extraordinary ability in extracting text-related regions and features from image components, 53 this model has been widely applied in many different research fields, such as feature extraction,54,55 classification, 56 program detection, 57 and etc. The TextCNN model performs convolutional operations on the word vectors by three convolutional kernels in the convolutional layer to generate feature vectors, performs maximum pooling of the convolved feature vectors in the pooling layer, and finally outputs the features in the fully connected layer. Figure 2 shows the specific operation process of the TextCNN architecture.
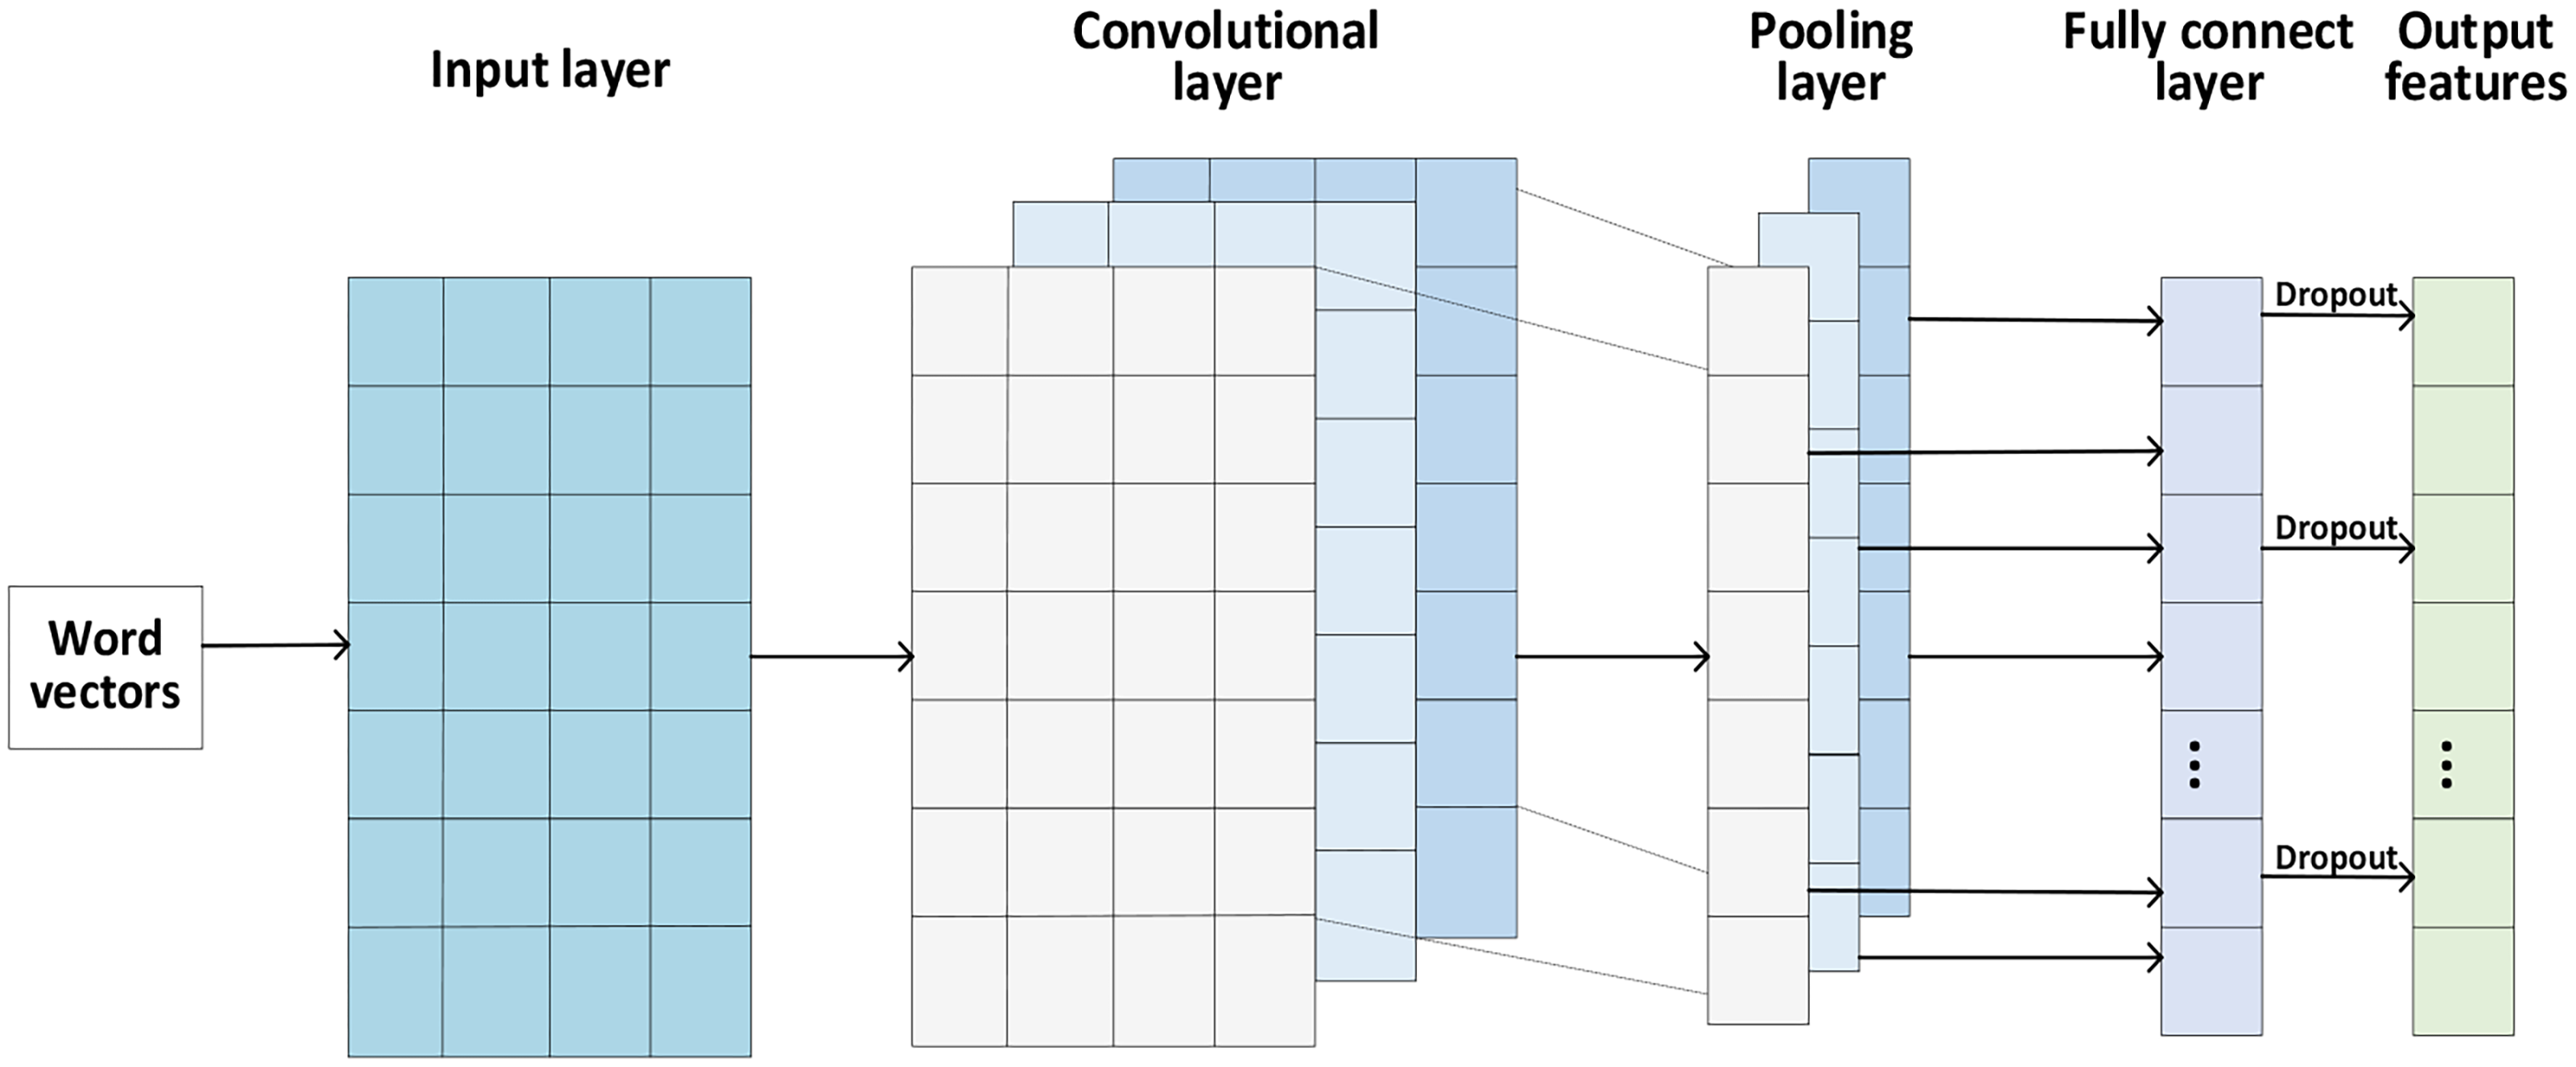
The TextCNN architecture.
The input layer
To obtain the word vector matrix for training, the model sequentially arranges and combines the preprocessed EMR word vector data in the input layer, and the structure graph is shown in Figure 3. In the word vector matrix, each row represents a word vector, the number of rows represents the number of words in a sentence (

The structure graph of the input layer.
The convolutional layer
The convolutional layer connects the input layers and performs feature extraction on the word vector matrix through three convolutional kernels contained inside. The convolution kernel can be regarded as a window that slides over the word vectors generated by all words of an EMR. The word vector captured by the first window is 


We apply the convolution kernel to each word vector 
Then, we combine the set of feature vectors of all sentences to obtain the features
The formula for calculating the length 

The pooling layer
After performing convolution operations on the input matrix, the dimensionality of the feature vector set is still high, so a pooling layer is required to perform down-sampling operation on the feature vector set T. The pooling mode adopted by the pooling layer is maximum pooling, that is, the largest feature value in the extracted window is taken as the value after the pooling of the window. This pooling method can select the features that best represent the meaning of the text and is suitable for classifying complex data such as EMRs. Moreover, the pooling layer can compress the dimensionality of the feature vectors output by the convolutional layer, which helps to extract key features.
The whole process of the maximum pooling operation
60
can be described as follows:
The fully connected layer
In the fully connected layer, we merge the outputs of the features from the pooling layer. We map the merged features to the sample tag space for feature integration through the fully connected layer to obtain the feature representation of EMR text. In order to enhance the generalization ability of the model and prevent overfitting, we set the Dropout layer after the fully connected layer to enhance the randomness of the model by randomly suppressing some of the fully connected layer neurons. Finally, we use the Dropout-processed feature representation T as the input of ABRF.
The operation formula of the fully connected layer
61
is as follows: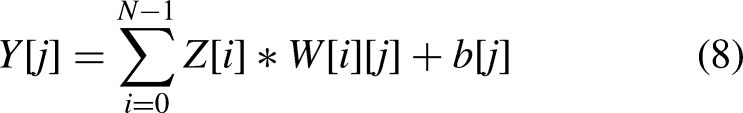
The second step: feature classification based on ABRF
In this subsection, we propose an ABRF-based classifier ensemble method to handle imbalanced medical datasets. This method is an AdaBoost ensemble learning algorithm based on RF classifier, which integrates Boosting algorithm and Bagging algorithm, and replaces the Softmax layer of CNN with it to improve the classification performance of the model. This algorithm is divided into two steps, namely RF-based classification and AdaBoost-based classification. Firstly, we use the Bootstrap sampling technique to generate a training set, and then use the RF-based classification algorithm to preliminarily classify the training set data, and update the sample weight distribution using the probability of classification errors. Then, we use the AdaBoost-based classification algorithm to combine all classifier results to get to the final classification result.
RF-based classification
RF is a combination algorithm of Bagging algorithm and decision tree classifier. When constructing RF, the number of features used to generate the tree at each node of the decision tree (here r is the dimensionality of the word vector) and the number of generated trees N are hyper-parameters. The steps for RF construction are as follows.
Firstly, we use the Bootstrap sampling technique to sample the features extracted by CNN for the same number of times as the decision tree, and extract two-thirds of the features each time as the training set, and then classify each training set.
Secondly, after the guided sampling, we generate N decision trees for each extracted training set. When generating a decision tree, we select the optimal attribute from several randomly selected attributes for classification. At each node, we select the best feature to split the node spanning tree and select the best feature in a way determined by the basic classifier type of RF. In order to classify new samples, we pass the classification of each sample to all nodes. All decision trees are unpruned.
Finally, we collect the prediction results of N decision trees and adopt a voting mechanism to determine the category of the new samples.62,63
The RF algorithm flow is shown in Figure 4.

RF algorithm flow.
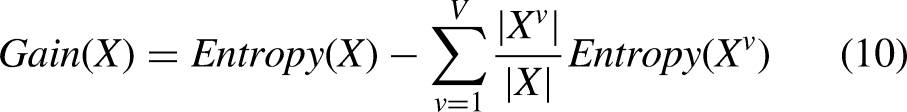
The commonly used decision tree models in existing studies include the ID3 decision tree, C4.5 decision tree, and CART decision tree. Considering the classification performance, we use ID3 decision tree as the base classifier of RF, and use information entropy as the criterion for selecting classification attributes, determine the decision tree nodes according to the size of information gain, and construct the decision tree in sequence. Suppose that the sample X needs to be divided into M classes, and the probability of the sample X belonging to each class is 
AdaBoost-based classification
A single RF is not sufficient to achieve better classification than Softmax. Therefore, in this subsection, we use the AdaBoost algorithm to combine multiple RFs as weak classifiers to form a stronger classifier than a single RF, to further optimize the classification effect. ABRF uses the SAMME.R algorithm to update the model, which is an improved AdaBoost algorithm and a variant of the SAMME algorithm. It uses the probability of samples being misclassified when iterating the classifier 65 to ensure that the classification accuracy of the base classifier is greater than that of the random classification.
We set the features to be classified extracted by CNN as the training set S, and the correct classification representation corresponding to each EMR as the label set Y, then the content of S is
In order to make the next base classifier pay more attention to the samples misclassified by the previous base classifier, it is necessary to assign weights to the samples. Initially, the weight of each sample is the same, which is
The base classifier (RF) classifies the samples in the training set into M classes. After one round of classification for all samples, the probability 
In order to construct a new classifier with a better classification effect than the base classifier, we update the sample weights 
After each round of classification, we sum the weights of the correctly classified and incorrectly classified samples in each type of sample. If the sum of the weights of the correctly classified samples is greater than that of the incorrectly classified samples, we will carry out the next round of classification. Otherwise, we will reconstruct the current round of classifiers. We combine the classification results of all base classifiers 
The third step: disease diagnosis results output
Based on the results of feature classification, identify the type of disease to which each EMR belongs.
CNN-ABRF classification algorithm.

Data analysis
The data were analyzed by Python version 3.7.4 for Windows 64 bit, and experiments were conducted based on the TensorFlow deep learning framework. The NVIDIA GeForce GTX 1050 Ti graphics card was used to accelerate the operation.
Firstly, we select 60% and 10% of the 18,590 EMRs randomly as the training and validation sets, respectively, and adjust the model parameters according to the performance of the model on the validation set, while setting the remaining 30% of the EMRs as the test set to test the performance of the model. The division of the dataset is shown in Table 2.
Partition of the dataset.

Secondly, we input the training set into CNN for convolution and pooling operations, extract the features used for classification and diagnosis from the training set, and finally output the features in the fully connected layer.
Thirdly, we take the features output from the fully connected layer of CNN as the input of ABRF and use the ABRF classification algorithm to classify the features. During the classification process, the model automatically adjusts the sample weights and classifier weights according to the error rate of the base classifier and finally synthesizes the classification results of all classifiers to output the classification results of all samples.
Finally, we use the validation set to adjust the model parameters and train the CNN model iteratively for 10 times to obtain the accuracy of the model after each training, and use the parameters and output characteristics of the CNN model when the accuracy is the highest for testing.
Statistical analysis
The scale of the C-EMR we used in the experiment was 18,590, covering the 10 most common chronic diseases. The total number of data items of each disease was as follows: hypertension (3946), diabetes (5642), chronic obstructive pulmonary disease (3299), gout (657), cardiac arrhythmia (1451), asthma (1075), gastritis (1069), stomach polyps (729), gastric ulcer (436), and urinary tract infection (289).
The results of data analysis were tested using
When the indicator value exceeds 90%, it indicates that the method application effect is very good. When the indicator value is between 80% and 90%, it indicates that the method application effect is good. When the indicator value is between 70% and 80%, it indicates that the method application effect is average. When the indicator value is below 70%, it indicates that the method application effect is poor.
By comparing with other methods, it was found that our method achieved the best results in all four indicators, reaching 89.28%, 88.89%, 91.32%, and 89.02%, respectively. In addition, for each disease, our method exceeded 90% in the diagnosis of chronic obstructive pulmonary disease, diabetes, gastric ulcer, and asthma, with very good application effect of our method. The diagnosis of hypertension, urinary tract infection, gout, stomach polyps, and cardiac arrhythmia are all between 80% and 90%, with good application effect of our method. The diagnosis of gastritis is between 70% and 80%, and the application effect of our method is average.
This study was conducted in Hunan University of Technology, Zhuzhou city, Hunan Province, China, and the time duration was about 12 hours of the program calculation in the experiment.
Results
In this section, we conduct simulation experiments based on real EMR data and analyze the experimental results.
Experimental evaluation setting
This experiment uses precision, recall, accuracy, and F1-score to evaluate the performance of the model.
Precision: Refers to the proportion of actual positive samples among all predicted positive samples. For example, among all EMRs classified as diabetes, the proportion of EMRs whose initial diagnosis result is actually diabetes. The calculation formula is as follows:


Results of hyper-parameter setting
CNN hyper-parameter setting
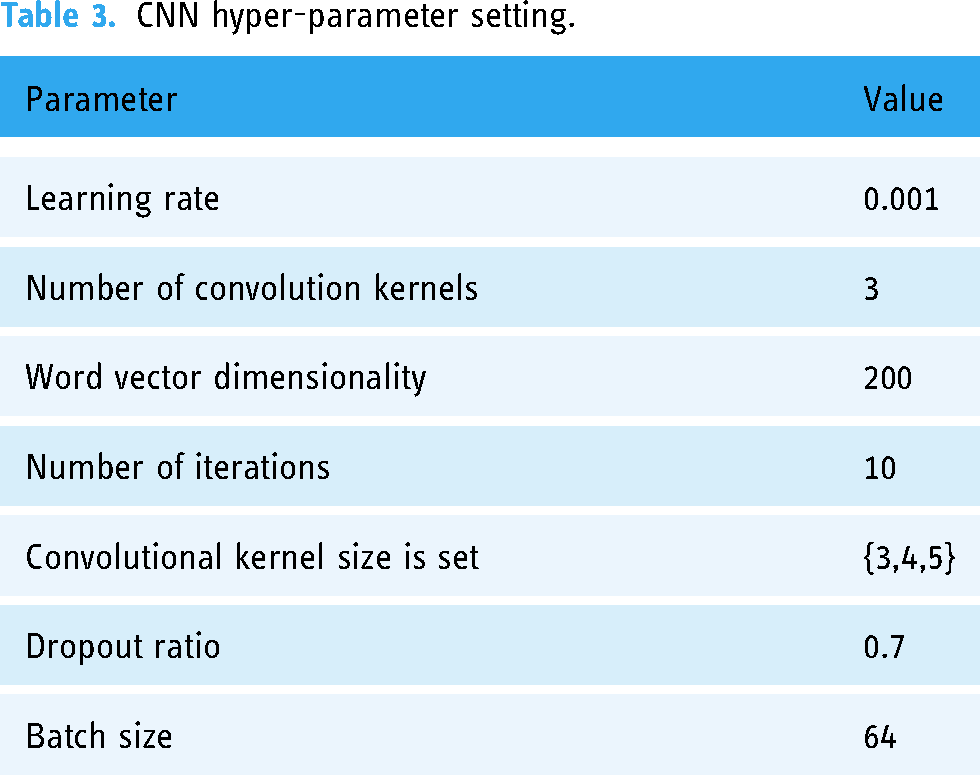
Through multiple experiments, we found that the best feature extraction effect is achieved when the learning rate is set to 0.001. The feature extraction effect is poor when the word vector dimensionality is set to 100; the best effect is when it is set to 200. However, the feature extraction effect is not significantly improved when it is set to 300, so we set the word vector dimensionality to 200. When the total number of iterations is 10, the effect is the best. When the number of iterations is greater than 10, the model performance is not significantly improved. Therefore, we set the number of iterations to 10. When the convolution kernel size is set to {3,4,5}, the effect is the best. The details are shown in Table 3.
CNN hyper-parameter setting.
ABRF hyper-parameter settings
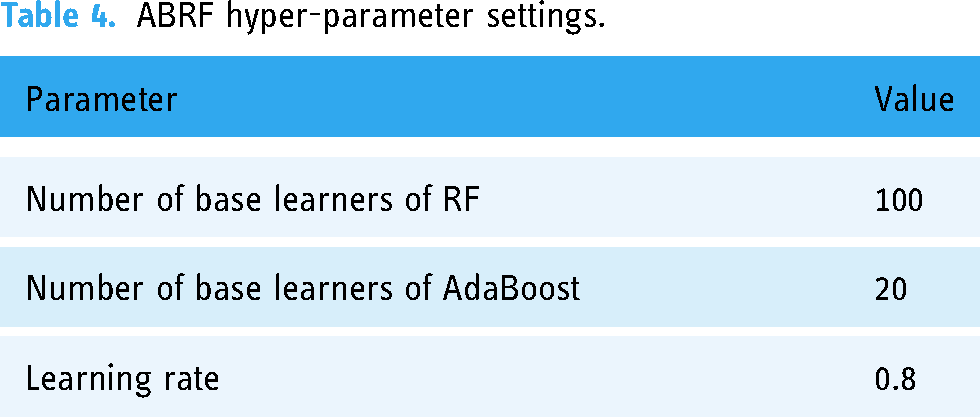
In order to select the best ensemble learning training parameters, we conduct a series of comparative experiments with the number of RF-based learners, the number of AdaBoost-based learners, and the learning rate. The final selected model hyper-parameter configuration is shown in Table 4.
ABRF hyper-parameter settings.
Results of experimental analysis
In this section, we conduct comparative experiments among CNN-ABRF and TextCNN that input the same word vector, RF that directly uses word vector features for classification, and the classical classification algorithm K-Nearest Neighbor (KNN). The results are shown in Table 5.
Comparative experimental results.

From the experimental results, we can see that the classification performance of CNN-ABRF proposed in this paper is significantly better than KNN and RF. Compared with RF, the Precision of CNN-ABRF is improved by 47.42%, Recall by 60.10%, Accuracy by 38.01%, and F1-score by 59.37%. This is due to the fact that CNN can learn vector representations of relevant disease texts from EMRs, which can more effectively consider the impact of different symptom features on disease classification. Compared with TextCNN, CNN-ABRF has also improved in classification quality indicators such as Precision, Recall, Accuracy, and F1-score. This may be because CNN-ABRF utilizes AdaBoost to reduce the error of RF algorithm through a weighted voting strategy, and RF performs better on the data with missing features. Therefore, replacing CNN's Softmax layer with AdaBoost layer for classification can effectively improve the classification performance of the model.
Results of diagnosis quality measurement
In this subsection, we use EMRs labeled with initial diagnosis results to train classification models for different diseases and extract representative EMRs to demonstrate the disease diagnosis results of multiple algorithms (see Table 6).
Representative diagnosis results.

By analyzing the results of disease diagnosis examples, we can find that:
KNN has the worst classification performance. In the five medical records displayed, it can only correctly classify one disease, and it is easy to identify diabetes as hypertension, chronic obstructive pulmonary disease as asthma, and hypertension as arrhythmia. The reason for this result may be that the clinical manifestations of these diseases are similar: diabetes and hypertension are common complications diseases, which are greatly affected by diet and living habits; both chronic obstructive pulmonary disease and asthma have respiratory symptoms, and therefore face differentiation issues in clinical practice; hypertensive patients often experience complications such as arrhythmia during the more severe stages of their condition, which can easily lead to misdiagnosis. In addition, when using KNN, gastritis is recognized as asthma, and the identified disease type differ greatly from the actual disease, which can have a significant adverse impact on the quality of doctors’ prescriptions and the health of patients. The classification effect of RF is also very poor, as it can only correctly classify two diseases. In addition to identifying diabetes as hypertension and chronic obstructive pulmonary disease as asthma, it is also easy to identify gastritis as gastric ulcer. This may be because the patients with these two diseases both have uncomfortable symptoms such as epigastrium discomfort, pain, flatulence, dyspepsia, and etc., and sometimes it is difficult to distinguish the symptoms, leading to misdiagnosis. CNN algorithm has a relatively good effect, but it also easy to identify gastritis as gastric polyps. The reason for this situation is also due to the similarity in clinical manifestations between symptoms: gastric polyp hyperplasia usually occurs after gastritis stimulation, which is a common complication in the medical field, and can easily lead to misdiagnosis.
Both RF and KNN algorithms have unsatisfactory diagnostic results for complications, and there are also cases of misdiagnosis results of the CNN algorithm. However, the CNN-ABRF algorithm proposed in this paper can diagnose complications correctly, fully proving the effectiveness of this algorithm in disease diagnosis. We also use CNN-ABRF to classify and diagnose 10 common diseases. Based on this, the classification accuracy, recall rate, and F1 value of each disease were calculated. The results are shown in Table 7.
Common disease diagnosis results.

The disease classification results show that CNN-ABRF has a very good classification effect on chronic obstructive pulmonary disease, diabetes, gastric ulcer, and asthma. The Precision, Recall, and F1-score of the classification results are all greater than or equal to 90%. It also has a good classification effect on hypertension, urinary tract infection, gout, gastric polyps, and cardiac arrhythmia. The classification results of Precision, Recall, and F1-score are all greater than 80%. The reason for achieving good classification results is that CNN-ABRF has better feature extraction and classification performance, and it can also accurately extract valid features from EMRs and perform diagnostic classification when dealing with conditions with similar features to other diseases. However, the classification results of gastritis are worse than that of other diseases, which may be because the clinical symptoms of chronic gastritis are not specific, and a large number of patients with chronic gastritis do not have obvious clinical symptoms. Meanwhile, gastritis is more closely related to other diseases, such as functional dyspepsia or helicobacter pylori infection, which can easily be classified as gastritis. In this regard, in addition to collecting EMR data for experiments, more knowledge base data in the field of chronic diseases should be further collected for a more accurate classification diagnosis of chronic diseases.
Discussion
Aiming at the problem that traditional machine learning methods are not effective in clinically assisted diagnosis, we propose a chronic disease diagnosis model based on CNN and ensemble learning, namely the CNN-ABRF model, to improve the performance of chronic disease diagnosis. We use the CNN algorithm to extract disease features and combine the AdaBoost algorithm with the RF algorithm to improve the classification effect of chronic disease by replacing the Softmax layer in CNN. Considering the classification performance, we use the training set to generate a decision tree, set the information entropy as the criterion for attribute classification, and set the ID3 decision tree as the base classifier of RF, and then use the AdaBoost algorithm to combine multiple RFs to further construct a strong classifier to obtain more accurate disease diagnosis results.
By comparing with other similar methods, we find that whether it is RF, KNN, or CNN algorithm, the diagnosis results are prone to be inconsistent with the initial diagnosis results. With the performance of high-precision feature extraction and classification, the results obtained by the proposed method are highly consistent with the initial diagnosis results of the hospital, as verified by Tables 5, 6, and 7. Therefore, compared to other methods, the proposed method can improve the effectiveness of chronic disease diagnosis and provide a reference for the diagnosis of other diseases.
Although the proposed method has good performance, there are still some parts that can be expanded and improved. Firstly, the EMR we use only stores the reports of patients during hospitalization, excluding the tests completed by patients before surgery, which may affect the efficiency of the diagnosis. Secondly, we did not use some unstructured data in EMR in the experiment, such as images and videos, which made us impossible to fully detect chronic diseases and easily led to inaccurate diagnosis results. Finally, we only obtained the dataset of chronic disease patients without the data from the non-diseased population for experimentation, making it difficult to judge the severity of the disease. In the future, we plan to improve the applicability of the method from the above three aspects.
Conclusion
Chronic diseases have become one of the most important factors threatening people's health. The classification and prediction of chronic diseases are crucial for assisting physicians in diagnosing and optimizing the health status of patients. However, existing classification algorithms, such as CNN, KNN, RF, are still not accurate enough in classification diseases, and combining CNN, AdaBoost and RF can improve this situation. Therefore, we integrate the above three algorithms to fully utilize them and compensate for the deficiencies of individual algorithms, improve the accuracy of chronic disease classification and prediction, which is important for helping physicians develop relevant clinical strategies. In addition, this study can also provide reference for the diagnosis of other types of diseases.
Footnotes
Acknowledgments
The authors thank the editors and anonymous reviewers for their very helpful comments and suggestions.
Contributorship
HZ: work concept or design. P-YZ: drafting papers. XZ: approve the final paper to be published. JL: make important revisions to the paper. W-JW: data collection.
Declaration of Conflicting Interests
The authors declared no potential conflicts of interest with respect to the research, authorship, and/or publication of this article.
Ethical approval
The study did not involve ethical issues.
Funding
The authors disclosed receipt of the following financial support for the research, authorship, and/or publication of this article: This work was supported by the National Natural Science Foundation of China (Nos. 71801090), Hunan Provincial Natural Science Foundation of China (Nos. 2023JJ30220) and Youth Project of Hunan Provincial Department of Education (Nos. 21B0553).
Guarantor
XZ
Informed Consent
Our study used publicly available medical dataset data on the internet, so patient consent is not required.