
Abstract
Objective
Autism spectrum disorder (ASD) is a complex neurodevelopmental condition influenced by various genetic and environmental factors. Currently, there is no definitive clinical test, such as a blood analysis or brain scan, for early diagnosis. The objective of this study is to develop a computational model that predicts ASD driver genes in the early stages using genomic data, aiming to enhance early diagnosis and intervention.
Methods
This study utilized a benchmark genomic dataset, which was processed using feature extraction techniques to identify relevant genetic patterns. Several ensemble classification methods, including Extreme Gradient Boosting, Random Forest, Light Gradient Boosting Machine, ExtraTrees, and a stacked ensemble of classifiers, were applied to assess the predictive power of the genomic features. TheEnsemble Model Predictor for Autism Spectrum Disorder (eNSMBL-PASD) model was rigorously validated using multiple performance metrics such as accuracy, sensitivity, specificity, and Mathew's correlation coefficient.
Results
The proposed model demonstrated superior performance across various validation techniques. The self-consistency test achieved 100% accuracy, while the independent set and cross-validation tests yielded 91% and 87% accuracy, respectively. These results highlight the model's robustness and reliability in predicting ASD-related genes.
Conclusion
The eNSMBL-PASD model provides a promising tool for the early detection of ASD by identifying genetic markers associated with the disorder. In the future, this model has the potential to assist healthcare professionals, particularly doctors and psychologists, in diagnosing and formulating treatment plans for ASD at its earliest stages.
Keywords
Introduction
Autism spectrum disorder (ASD) is a neurodevelopmental disorder characterized by early-onset difficulties in communication, social-interaction, and persistent behavioral abnormalities.1–3 ASD is diagnosed in approximately 1 in 58 children in the USA. Both inherited and de novo4–6 genetic variations can contribute to its development. As a result, ASD is an active field of research, with numerous studies ongoing to understand its causes. Environmental, social, and genetic factors may all play a role in the neurological differences associated with ASD. 7
The process of screening and diagnosing ASD is currently a complex and often imprecise one. Currently, there is no definitive medical test available to diagnose ASD at an early stage. Nevertheless, multiple studies are presently being conducted to explore the viability of employing magnetic resonance imaging (MRI) of the brain, eye tracking, and speech analysis as possible means of identification.8–11 Electroencephalography has also been explored for detection of ASD by analyzing brainwave patterns.12,13 The signs of ASD typically emerge between 12 and 18 months of age, though parents often may not recognize these signs initially. Most children do not receive a definitive diagnosis in early childhood, consequently missing out on essential support and interventions during a crucial developmental period.14,15 Global research indicates that ASD is four times more prevalent in males than females. This paper proposes a computational diagnostic model for the early identification of biomarkers associated with neurotransmission delays. These delays contribute to the cognitive development differences and neuropathological changes seen in ASD, particularly during early childhood.16,17 Several genetic variants and functional mutations can increase the risk of neurodevelopmental disorders. These include rare conditions like Giedion syndrome, Schinzel-Giedion syndrome, 18 and Opitz syndrome, 19 as well as more common disorders such as ASDs, Fragile X syndrome, Down’s syndrome, 20 and epilepsy.21–23 Additionally, mutations can contribute to psychiatric conditions like schizophrenia and bipolar disorder.
De novo mutations may have evolved mechanisms to increase the likelihood that their variants contribute to genetic conditions. Heritability variants tend to have more severe effects on average than de novo mutations, making them a significant susceptibility biomarker for ASD.24,25 Research suggests that a combination of inherited and de novo mutations may play a significant role in neural developmental deficits.26,27 These mutations can introduce insertions or deletions (indels) within genomic sequences, potentially leading to molecular changes in genetic characteristics associated with the development of intellectual disabilities. 28 Single nucleotide polymorphisms (SNPs) are common genetic variations abundant in nature. They are widely used as biomarkers for cognitive disorders. 29 An SNP refers to a single-nucleotide change in a DNA sequence occurring in at least 1% of the population. SNPs can exist in coding (exonic) and non-coding (intronic) regions, and SNPs within exons may be promising biomarkers for the genetic diagnosis of neurodevelopmental disorders. Autism-associated genes often involve SNPs, de novo mutations (arising spontaneously in an individual), or copy number variations (CNVs; duplications or deletions of the genetic material).30–33 Such genes, contributing to the development of autism, are termed autism driver genes. Conversely, passenger mutations, which do not directly influence the development of autism, may also be present.
In previous studies, various machine learning algorithms such as support vector machine (SVM), decision tree, and Gaussian naive Bayes (NB) have been used for the identification of ASD.34–36 Most of these studies utilized supervised learning methods where the algorithm learns from labeled data. Heinsfeld's model 37 achieved better classification accuracy (70%) than SVM and Random Forest (RF) algorithms and 38 achieved an accuracy of 90.39%. However, it is important to note that these studies used relatively small sample sizes and are based on imaging data, and further validation is needed to assess the generalizability of these findings. Previous research, such as CORR39, utilized neural network (NN) models trained on gene expression microarray data for ASD classification. Although it presented an optimized framework, it achieved a maximum accuracy of only 78.6%, limited by the dimensionality reduction techniques employed to handle the vast number of gene expression features. Similarly, Resnik40 applied machine learning classifiers on semantic similarity matrices of ASD and non-ASD genes, achieving an area under the curve (AUC) of 80%, but its classifier was constrained by the size and quality of available data. Additionally, Brainspan41 proposed an autoencoder-based approach for ASD risk gene prediction, focusing on long non-coding RNAs (lncRNAs), but reported accuracy levels of only 81%–82% depending on the model used (logistic regression (LR), SVM, or RF). Despite these efforts, the existing models often suffer from limited sample sizes, insufficient classifier diversity, and the inability to fully exploit the genetic sequence data available for ASD.
This study aims to identify autism-susceptibility genes from genetic sequences. Researchers are developing personalized ASD treatments focused on targeting the specific genes contributing to autistic behavior. These efforts involve modulating the expression or function of those genes. Consequently, there is a need for tools to efficiently and accurately pinpoint ASD driver genes. The ability to identify these genes would facilitate disease intervention and provide a valuable foundation for advancements in ASD therapies. To address this, the paper proposes Ensemble Model Predictor for Autism Spectrum Disorder (eNSMBL-PASD). It is a computational model designed to predict ASD driver genes using genomic sequences. By leveraging ensemble methods, including Extreme Gradient Boosting (XGB), RF, Light Gradient Boosting Machine (LGBM), and Stacking of classifiers, the model aims to enhance early diagnosis of ASD through accurate gene identification. The novelty of our research lies in the development of eNSMBL-PASD, an ensemble-based computational model that integrates advanced feature extraction techniques and diverse ensemble classifiers to predict ASD driver genes. The following steps can be considered while planning a systematic and valuable sequence-based methodology: (1) determining or developing a substantial benchmark dataset that may serve as a merit for testing and training the prediction model; (2) using a viable numerical expression for defining the organic arrangement tests, which helps in reflecting their correspondence with the concerned targets; (3) writing a computational algorithm that predicts effectively; (4) using the outcomes that are valid enough for evaluating the expected precision; and (5) forming a framework based upon a robust model that is publicly available. This work proposes a computational prediction model specifically trained on datasets containing both autism driver genes (successor genes) and non-driver genes (passenger genes). The computational model will be further tested and evaluated through different tests for its authentication and validation.
Materials and methods
This section (refer to Figure 1) provides a detailed description of the computational processes employed in this study. The fundamental steps encompass the selection of a benchmark dataset, sourced from ncbi.org. The autism-related genes are verified from literature review and downloaded. Further, in data processing, the Cluster Database at High Identity with Tolerance (CD-HIT) is applied to get the finalized list of FASTA sequences. Subsequently, feature vectors are extracted to delineate the principal characteristics of the dataset by utilizing techniques such as Position Relative Incidence Matrix (PRIM), Reverse Position Relative Incidence Matrix (RPRIM), Accumulative Absolute Position Incidence Vector (AAPIV), and Reverse Accumulative Absolute Position Incidence Vector (RAAPIV). The development phase entails training a robust prediction model using diverse classifiers, including RF, XGB, Light Gradient, Extra Tree, and Stacking. Finally, the validation process involves testing the model using various methodologies, including independent testing, self-consistency, and cross-validation using both five-fold and 10-fold approaches. The experiments were conducted using Python programming language, employing widely-used libraries such as scikit-learn, XGBoost, LightGBM, Random Forest, Extra Tree, Stacking and TensorFlow for model development, training, and evaluation. All experiments were executed using two platforms: Google Colab and Jupyter Notebook. The hardware for local execution included an Intel Core i7 processor and 16GB RAM, which handled the feature extraction and training of models.

Steps towards the construction of a robust prediction model.
Benchmark dataset collection
A dataset typically serves as a benchmark in scientific research, consisting of carefully curated samples obtained through experimental procedures. The careful selection of these samples is crucial, requiring clarity and specificity to ensure they are suitable for testing and training purposes. The experimental findings are rigorously validated through various tests, including cross-validation and independent set tests. This methodological approach provides strong evidence supporting the results.
The primary aim is to develop a robust computational model. To achieve this, a dataset comprising autism-related genes was meticulously collected from the National Center for Biotechnology Information (NCBI), the latest version that was publicly available (https://www.ncbi.nlm.nih.gov/). 42 This dataset serves as the foundation for the subsequent computational processes. In Figure 2, the detailed flowchart of the entire process is shown.

Flow chart of the process.
The fundamental steps began with selecting and mapping a benchmark dataset sourced from NCBI. Each gene was carefully reviewed against the available literature to ensure its relevance to ASD. The inclusion criteria focused on selecting autism driver genes that were either experimentally validated or strongly associated with ASD, while passenger mutations not linked to the disorder were excluded. Only genes with complete and sufficient sequence data were included to ensure accuracy and robustness in the analysis. This processed dataset then served as the foundation for the subsequent feature vector formulation, where relevant genetic patterns were extracted and used to train predictive models. Hyperparameter tuning was then applied, followed by the validation of the model.
Data processing
All mutation cases in human genes are listed in this benchmark dataset. Mostly there are passenger mutation cases, which are not responsible for causing autism. Around autism-causing mutations, 3144 autism driver genes are responsible for causing it. This gathered data is subsequently used in formulating a dataset that can serve as a benchmark for the previously mentioned problem. Within the current study, G is used to denote the benchmark dataset and is represented as

When formulating the sample, we can articulate the sequence of DNA as


Scientific advancements have opened doors to explore the remarkable potential of biotechnology. However, a pressing challenge lies in developing computational and predictive models that efficiently transform sequence data into well-defined, measurable models. This process critically requires preserving the inherent groupings within the data, ensuring these groupings remain consistent with the original information they represent. These designs provide features and data that play an instrumental part in intelligent target analysis. Machine algorithms, for example, “support vector machine” (SVM), “RF,” and “XGB,” are best for evaluating vector detailing obtained from the exposure of proteomic or genomic arrangements. These machine algorithms are designed in a way that they easily receive vector input. In a discrete model, the entire sequence-related data must be renovated into a vector of definite size, while ensuring that no crucial information is lost.
This information determines the features of the given sequence. Pseudo Amino Acid Composition (PseAAC)
43
is anticipated to address the limitations of traditional protein data representation methods. In almost every computational proteomics background, Chou's PseAAC
44
has been deployed.
45
It was incorporated into a computer application named “PseAAC-General”
46
because of its importance and ubiquity in computational proteomics. The efficiency of PseAAC and its success in analyzing protein/peptide sequences indicate that it could yield similarly useful results if applied to DNA/RNA sequence analysis within computational genomics.
47
Transformation of genomic data in a general and well-constructed numerical encoding is possible, as shown by R in equation (3) as

Feature vector formulation
Statistical moments
An empirical method is used for characterizing the measurements and components of equation (4). To obtain fixed-size data from genomic data, statistical moments are applied. Some unique information is described by each moment that results in designating the nature of data. The study of moments across various distributions is an active area of research for mathematicians and analysts. The genomic data's Hahn, central, and raw moments are presented in the feature set. For the predictor, these moments constitute a principal integrant of a vector. The moments incorporating the scale and area of variance serve for deciphering among sequences that function distinctively. In addition to these moments, other asymmetry-related moments and those characterizing data sources prove valuable in constructing classifiers for labeled datasets. Research demonstrates that the properties of proteomic and genomic sequences are influenced by the relative arrangement and composition of their constituent bases. Consequently, the most suitable computational and mathematical models for feature vector generation are those characterized by sensitivity to the specific arrangement of nucleotide bases within genomic sequences. This positioning must be within genomic sequences. It is an essential feature in developing assiduous and effective feature sets.48,49 As 2D data is required by the Hahn moments, a two-dimensional notation S’ is obtained from the genomic sequences. This S’ of size k*k is capable of storing the same information as S, but now this information is stored in a two-dimensional form, that is


For computing the raw moments of order a + b, the operations performed are described in equation (6).


Mostly, the obtained Hahn coefficient is normalized in equation (8).52,53

Formation of PRIM
These specific computational predictors facilitate gene attribute prediction, supporting gene classification and uncovering essential characteristics. To examine the relative positioning of nucleotide bases, the PRIM54,55 is used. Within a sequence, NPRIM captures the arrangement of a single nucleotide (Np) at position “p” relative to other nucleotides (equation (9)).


Formation of RPRIM
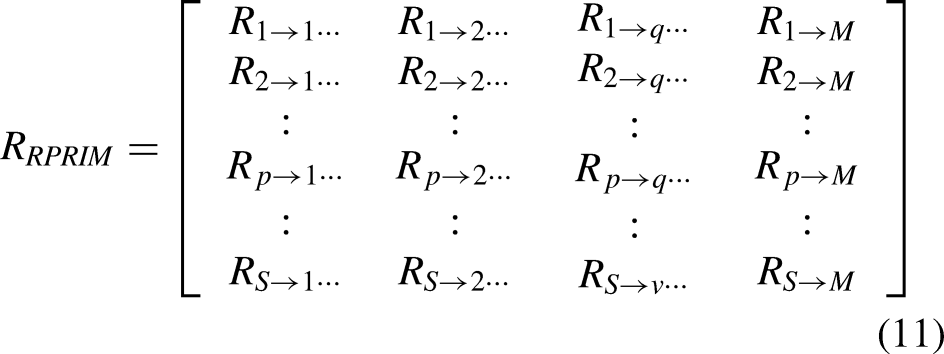
Identifying the underlying patterns, embedded within gene sequences, is the ultimate goal of feature extraction. There exists the need to analyze the gene sequences from different perspectives to draw the related information that corresponds to their behavior. Experimental findings indicate that analyzing a gene or protein's reversed sequence can yield valuable insights. Consequently, the RPRIM is constructed to leverage this principle. The resulting matrix is derived by first reversing the original sequence, followed by processing the reversed sequence, and the PRIM is computed as described in references.48,49,56,57 RPRIM was calculated using a similar methodology to PRIM matrices, incorporating mononucleotide, dinucleotide, and trinucleotide combinations. On RPRIM, an arbitrary element, Rr→j, holds information about the relative positioning of the rth base, unlike the jth nucleotide base. The representation of the RRPRIM matrix is given by equation (11):
Frequency vector (FV) determination
The composition and sequential arrangement of nucleotides within a chain influence the development of a feature set. As discussed, both matrices, the PRIM and RPRIM, help in extracting the nucleotide bases’ sequence-related correlations. The gene's composition-related information is summarized in the form of a FV. Within the gene sequence, the number of times the nucleotide occurs is provided by every element of this vector. The vector is represented as shown in equation (12):

Formation of AAPIV
This feature extraction process extracts every compositional aspect of a gene. The FV indicates about the occurrence of each nucleotide base. Similarly, for each specific nucleotide base, the cumulative information related to the occurrence of their position is given by the AAPIV. Here, three distinct AAPIVs, representing varying levels of granularity, were generated and named KAAPIV4 (equation (13)), KAAPIV16 (equation (14)), and KAAPIV64 (equation (15)). Each vector signifies a different resolution: KAAPIV4 holds data on four nucleotides, KAAPIV16 on sixteen, and KAAPIV64 on 64, which are represented as follows:


RAAPIV generation
The reverse sequence provides a deeper perspective on the hidden patterns within the gene sequence. The RAAPIV analysis examined three types of nucleotide combinations: single nucleotides, dinucleotides, and trinucleotides. Each combination has a unique vector length: 4 for single nucleotides, 16 for dinucleotides, and 64 for trinucleotides. For the gene's reverse sequence, the computation of AAPIV is termed RAAPIV and is given as⋏


The arbitrary element ni within the RAAPIV contains the total count of occurrence positions for the ith nucleotide in the reverse sequence.
Final feature vector formulation
A fixed scale notation is obtained from each primary sequence of equation (4). Large matrices PRIM, RPRIM, and G’ are changed into a succinct form, and moments are computed by computing Hahn, raw and central moments, as also referred in diverse studies.58–62 Henceforth, these moments are merged into a feature vector with RAAPIV, AAPIV, and FV. In this feature vector, coefficients are in correspondence to a sequence of arbitrary length. For all the samples, an encyclopedic set of feature vectors is computed. The final feature vector contains 522 columns, determined through an iterative process of feature selection and optimization.
Training classifiers
An optimal feature selection approach utilizes iterative probing techniques to identify the most relevant features for model training. We began with a core set of features and incrementally expanded the feature space by systematically adding additional features based on their relevance and contribution to model performance. 53 This refinement process helped in selecting top-performing classifiers, such as RF, XGB, LGBM, and Extra Tree are selected for further training and evaluation.
RF
Random decision forests, also known as RFs, are an ensemble learning method applied for classification, regression, and various other tasks. During training, a RF algorithm constructs multiple decision trees, and the final output is aggregated from the outputs of these individual trees.63,64 The class's output is represented in Figure 3.

Random Forest Classifier.
XGB
It is a structure developed through supervised machine learning, decision trees, and boosting models. This model extracts patterns and features from the dataset, which are then used to train a predictor. The model is based on a decision tree having a combination of if/else (true/false) conditions and analyzing the least number of questions to evaluate the probability of a correct decision. Next, for classification and regression, it used the same ensemble learning algorithm as in RF, but these are differently combined and built decision trees. In the end, it iteratively trains the ensemble decision tree, and in the final output prediction, the weighted sum of all predictions is taken.
Extra Tree
The Extra Tree Classifier is a machine learning algorithm designed for classification tasks. It is an extension of the RF algorithm and operates by constructing multiple decision trees during training. However, unlike RF, the Extra Tree Classifier introduces additional randomness by selecting random split points for features, making it less prone to overfitting. During the prediction phase, each decision tree in the ensemble independently classifies the input data, and the final classification is determined by aggregating the results through majority voting. This ensemble approach improves the model's accuracy and generalization capability, even with high-dimensional datasets. The algorithm is computationally efficient because of its random feature selection and split points, making it suitable for large datasets. It can handle numerical and categorical features and does not require feature scaling. Moreover, the Extra Tree Classifier can handle missing data, making it robust for real-world datasets.
LGBM
The LGBM Classifier is a powerful machine learning algorithm based on gradient boosting. It is known for its speed, efficiency, and ability to handle large datasets. Unlike many other tree-based algorithms, it builds trees leaf-wise and utilizes histogram-based techniques to improve training efficiency. It can handle numerical and categorical features, supports early stopping to prevent overfitting, and provides feature importance for better interpretability. With customizable evaluation metrics and class imbalance handling, LGBM is versatile for various classification tasks. Its memory efficiency and multi-threading support make it a popular choice for real-world applications in domains such as finance, healthcare, and marketing.
Stacking
Stacking a machine learning algorithm is a technique that combines multiple base models into a single model by training a meta-model on their predictions.65–67 The core concept of Stacking involves using the predictions from multiple base models as input for a meta-model. This meta-model learns to combine the base model predictions in a way that optimizes overall system performance. The Stacking process typically involves several steps. First, the training data is split into several subsets. Then, each base model is trained on a different subset of the training data, and its predictions are computed on the remaining subset of the data. These predicted values are then combined into a new dataset and used as input features for the meta-model. Finally, the meta-model is trained on this new dataset and used to generate predictions on new data. This study employs a stacked ensemble consisting of XGBClassifier, ExtraTreesClassifier, LabelPropagation, BaggingClassifier, and LGBMClassifier. One of the advantages of Stacking is that it can capture more complex relationships in the data by combining the strengths of several models. Stacking can also reduce the risk of overfitting by using a separate dataset to train the meta-model.
Table 1 outlines the hyperparameters used for optimizing each machine learning classifier, including RF, ExtraTrees (ET), XGB, LGBM, and the Stacking approach
Hyperparameter of machine learning classifiers.

Note. XGBoost: Extreme Gradient Boosting.
Validation of models
The assessment of prediction algorithm performance is critical for validating its efficacy. Researchers have developed a wide range of quantitative metrics to facilitate this assessment. These matrices are based on certain validated tests and experiments and these will be used for comparative analysis among different models.
Accuracy metrics
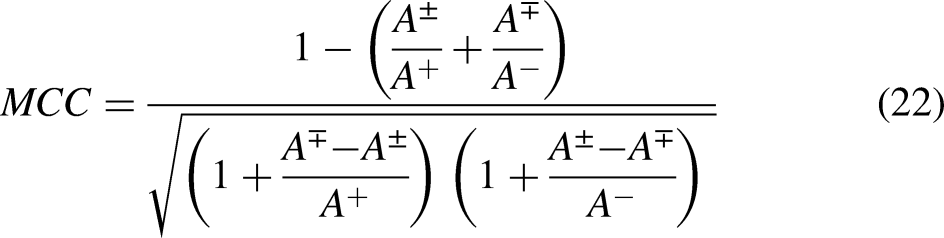
Mostly, four interconnected metrics are used to evaluate the performance of a computational predictor. The accuracy of metrics is defined as Acc, it is for inclusive prediction accuracy. The next one is sensitivity denoted by Sn, which reflects the accuracy in predicting positive samples. The specificity, denoted as Sp, is also a quantitative measure for predicting accuracy in negative samples. 68 The last one Mathew's correlation coefficient (MCC) is a measure to analyze the accuracy when negative and positive samples are unhinged.
W. Chen, Feng and Lin
69
defined and formulated the metrics in the following narration that is more readable and simple to conceive:


Self-consistency validation
The most basic evaluation of a predictor's accuracy is often performed through self-consistency validation. A dataset of feature vectors, comprising both positive and negative samples, is initially generated and subsequently used for further training. Validation is the next step after substantial training of the model, and self-consistency would be the first test for assessing its validity. This test indicates that the predictor is being tested using the same data on which it was trained.
Table 2 presents a comparative analysis of several classifiers, including RF, LGBM, XGB, ET, and Stacking methods, evaluated on a standard benchmark dataset.
Self-consistency experimental results of RF, LGBM, ExtraTree, XGB, and Stacking.

Note. RF: Random Forest; LGBM: Light Gradient Boosting Machine; XGB: Extreme Gradient Boosting; MCC: Mathew's correlation coefficient.
Comparative analysis has revealed that RF, ExtraTree, and Stacking models demonstrate remarkable performance compared to XGB and LGBM. Referring to Figure 4, the AUC suggests that the RF model achieves superior accuracy. These results have indicated that the predicted rule is aligned with the initially proposed computational method.
Self-consistency ROC curves for RF, ET, LGBM, Stacking, and XGB.
In our study, self-consistency validation uses the same dataset for both training and testing, which helps evaluate the model's performance on the entire dataset. However, to prevent over-fitting, we also employ independent testing and 5-fold and 10-fold cross-validation, where the dataset is split into 70% for training and 30% for testing, ensuring the model is evaluated on completely unseen data for robust validation.
Independent dataset test
Independent set tests have been renowned for determining performance for unknown datasets. Typically, a dataset is divided into two unequal parts: a larger portion for training the predictor and a smaller portion for testing its accuracy. This process is repeated multiple times with varying dataset divisions to ensure the predictor's accuracy. In this test, the extracted benchmark data samples are used as input. Normally, the division is based on a 70–30 ratio, 70% is for training of the predictor and 30% is for testing. The whole process is repeated 10 times with different chunk sizes.
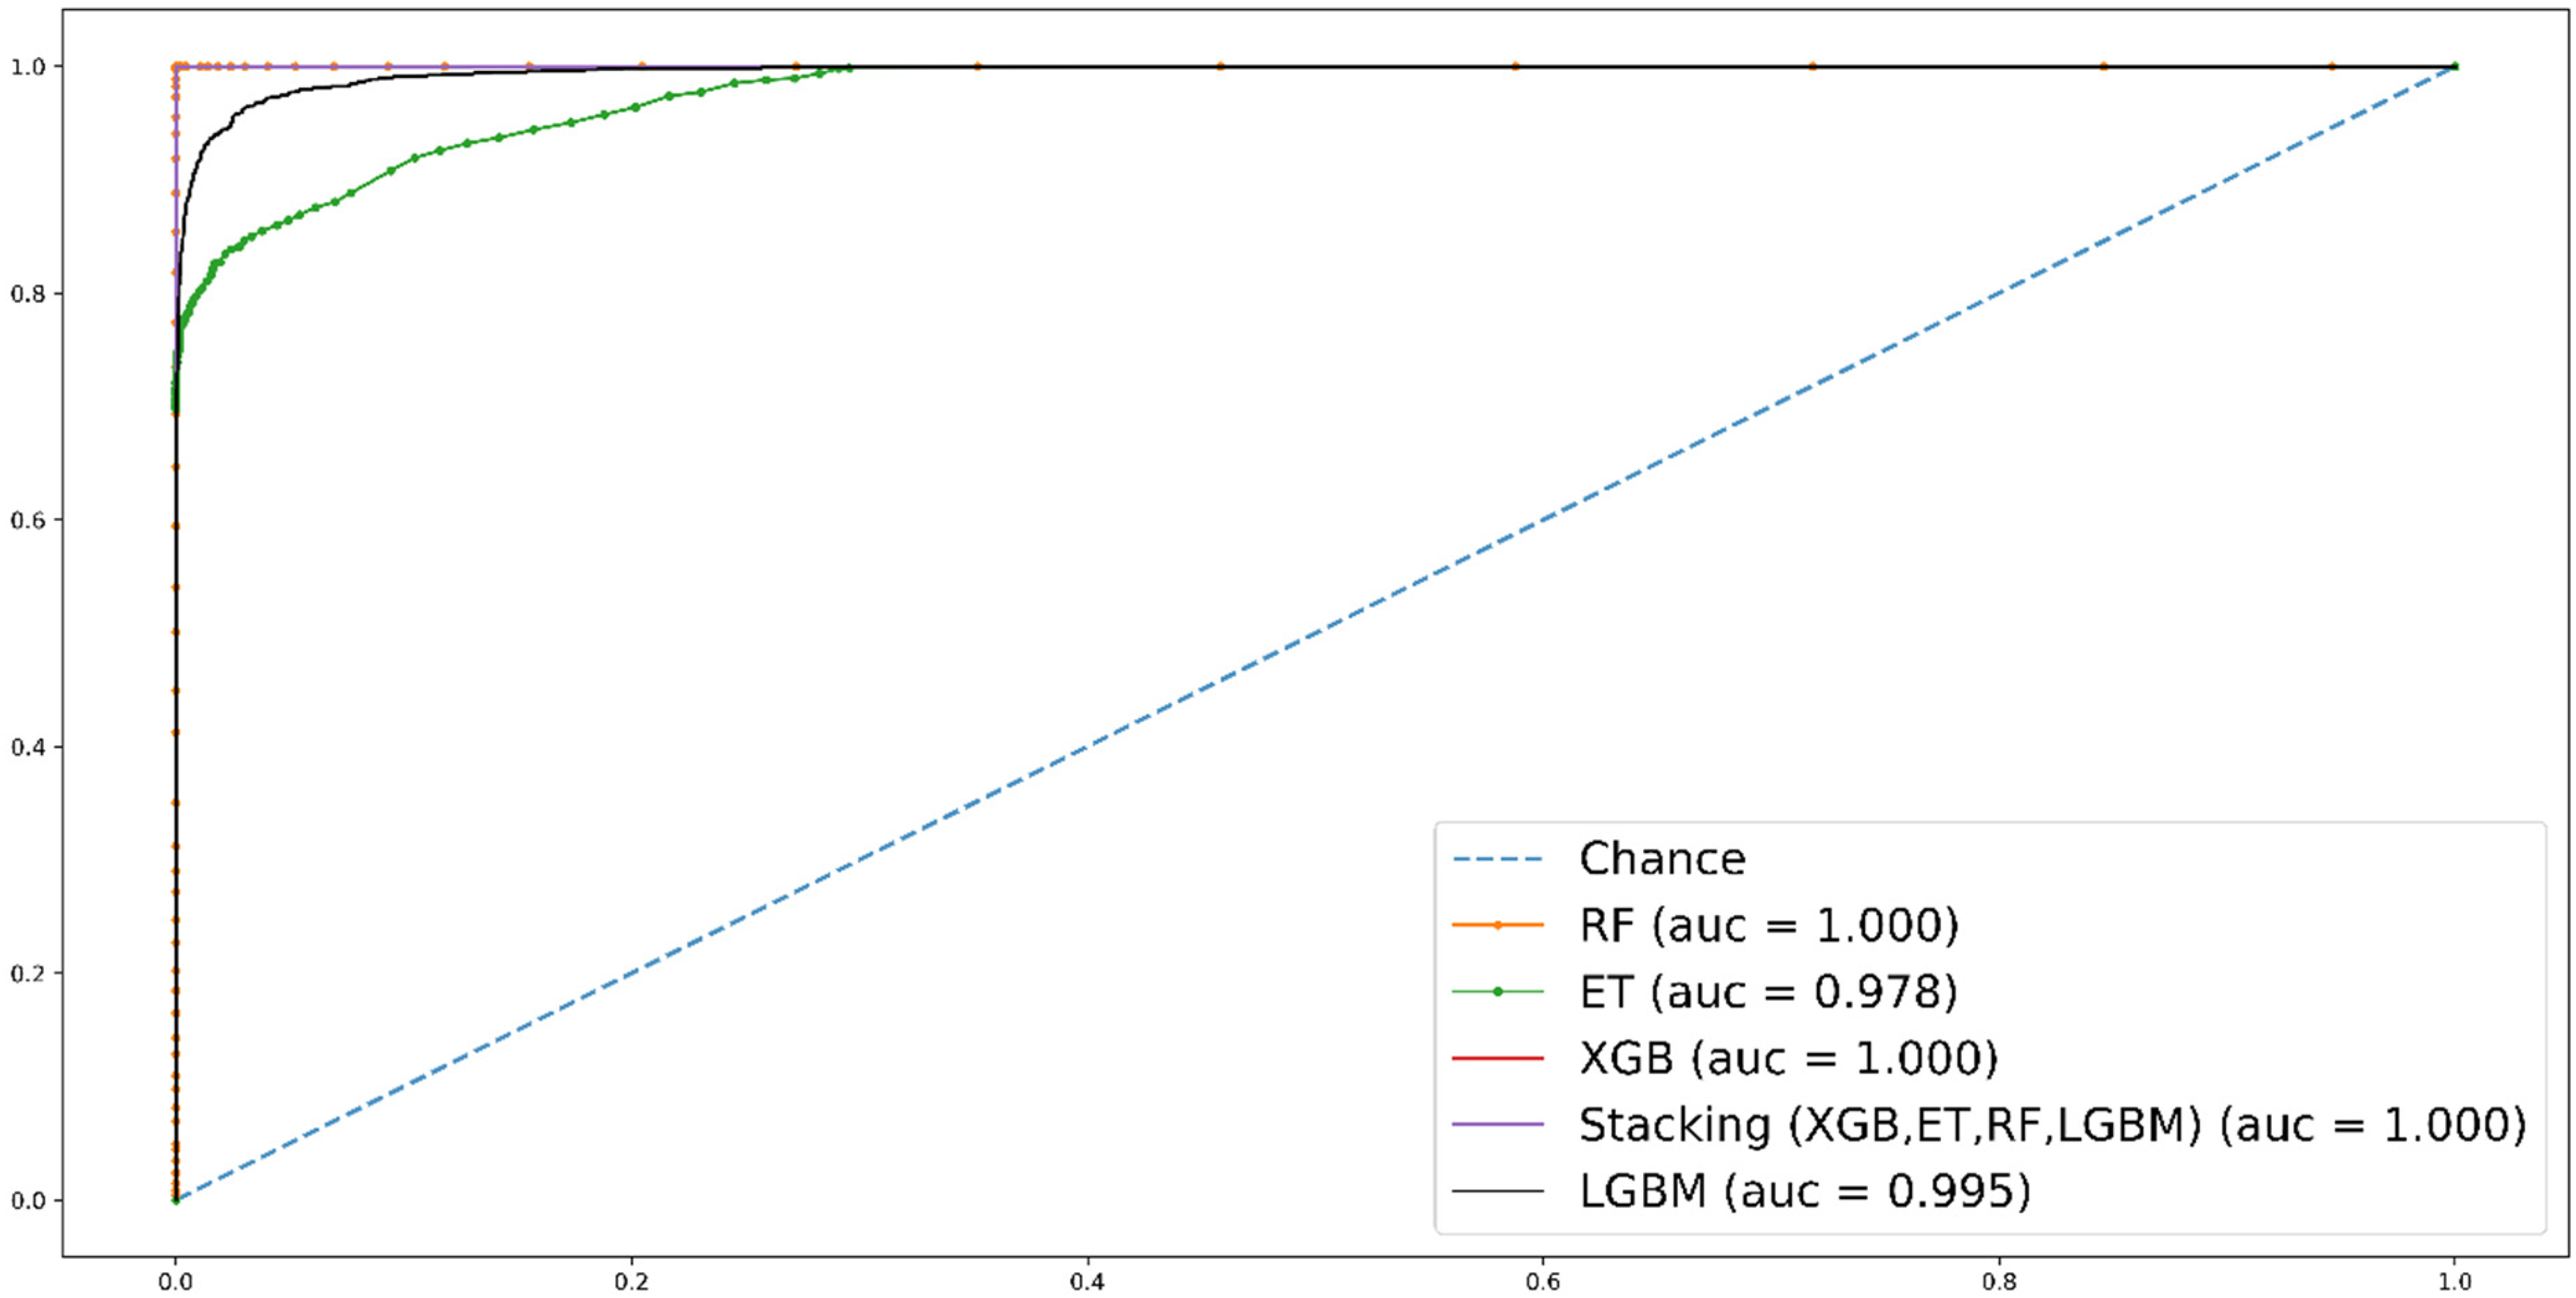
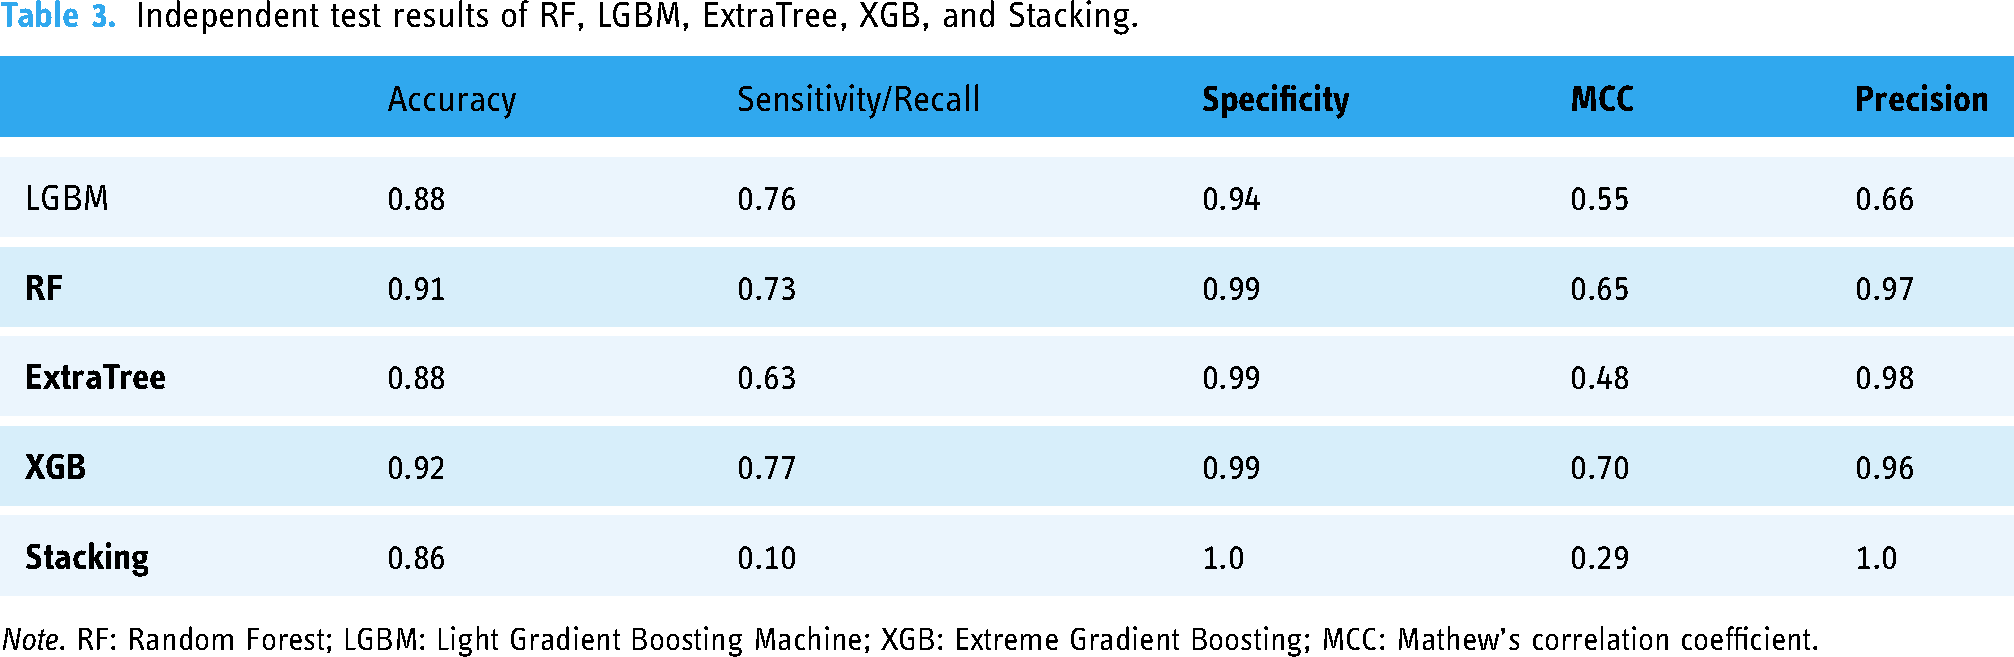
Table 3 presents the average accuracy for each predictor. Consistent with the self-consistency results, RF and XGB outperform LGBM, ET, and Stacking in independent testing. A graph in Figure 5 reflects that RF has the highest accuracy (0.91) and specificity (0.99), indicating it performs well in correctly classifying both positive and negative instances. XGB has the highest sensitivity (0.77) and MCC (0.70), indicating it performs well in correctly identifying positive instances and has a strong overall correlation between observed and predicted classifications.

Independent test ROC for eNSMBL-PASD-RF, eNSMBL-PASD-XGB, eNSMBL-PASD-ET, eNSMBL-PASD-LGBM & eNSMBL-PASD Stacking.
Independent test results of RF, LGBM, ExtraTree, XGB, and Stacking.
Note. RF: Random Forest; LGBM: Light Gradient Boosting Machine; XGB: Extreme Gradient Boosting; MCC: Mathew's correlation coefficient.
Cross-validation
The computational findings of self-consistency are based on comparative analysis of different models, i.e. RF, XGB, LGBM, Extra Tree, and Stacking. Its performance is not evaluated for unknown data samples. While independent tests offer some insight into a predictor's performance on unknown data samples, they do not account for all possible cases. It could be possible that major chunks would be neglected during permutations or random partitions. It is important to perform more efficient tests like cross-validation to authenticate the predictor's correctness. The best part about cross-validation is that it iterates all available dataset samples. The dataset is divided into k disjoint folds and the test is repeated k times. The test is iterated to randomly assigned partitions and training is done for k‒1 partition.
The predictor's accuracy is determined by calculating the average across multiple repetitions of the test (k-times). It has been proven to be an efficient approach for readily unavailable test data. Through this strategy, no dataset is left out for testing, so it provides a substantial representation of predictor accuracy for unavailable data. All predictors are tested on 10-fold cross-validation where all the datasets are divided into 10 disjoint folds. In each iteration, one fold is designated for testing while the remaining folds are used for training. This process repeats until every fold has served as the testing set. The average performance of each classifier (LGBM, XGB, RF, ET, and Stacking) across 10-fold cross-validation is summarized in Tables 4‒8, respectively (Table 4 refers to LGBM, Table 5 refers to XGB, Table 6 refers to RF, Table 7 refers to ET, and Table 8 refers to Stacking). It has been observed that the accuracy level is high in the case of RF, which proves the validity of the results as mentioned in previous tests.
Cross-validation ten-fold test for LGBM.

Note. LGBM: Light Gradient Boosting Machine; MCC: Mathew's correlation coefficient.
Cross-validation 10-fold test for XGB.
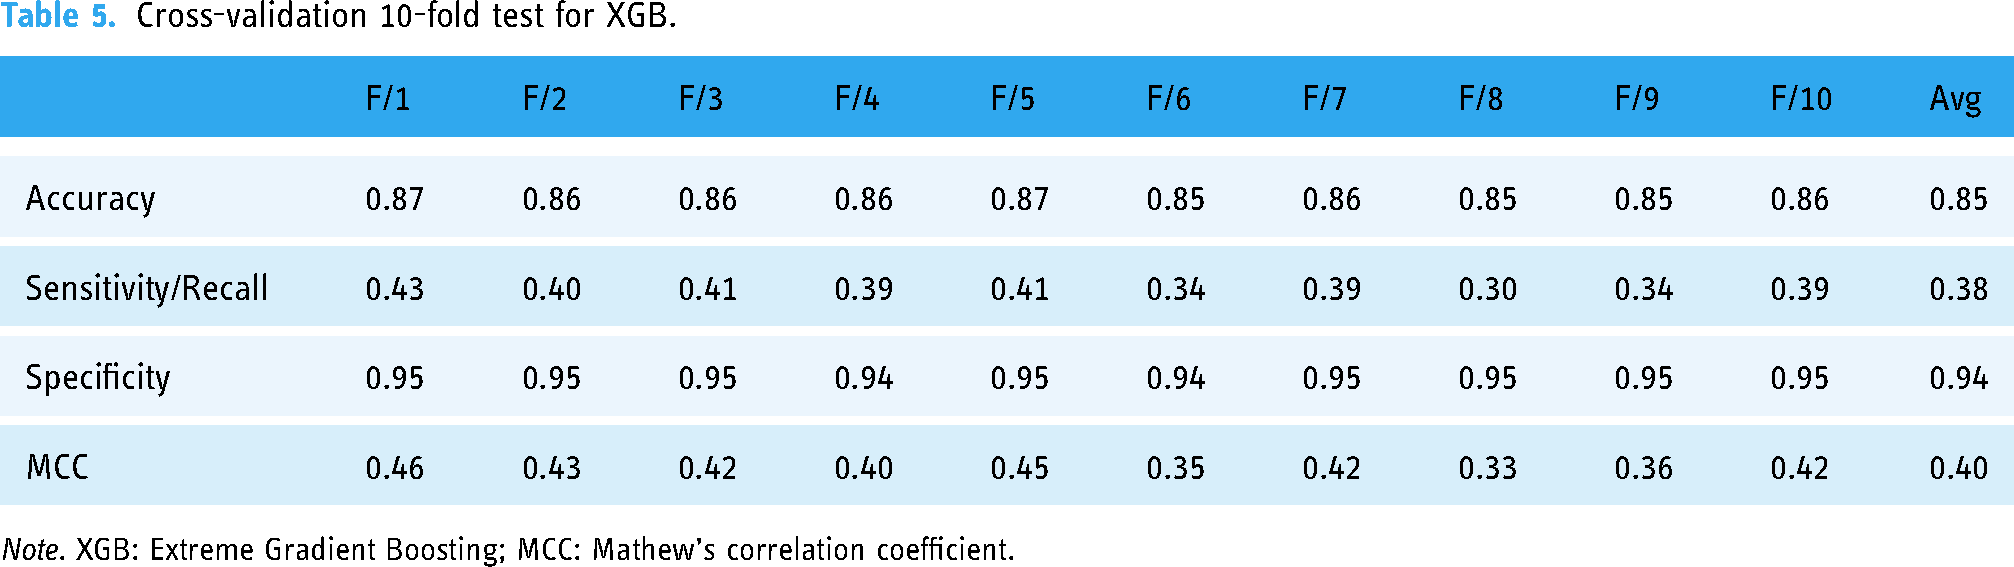
Note. XGB: Extreme Gradient Boosting; MCC: Mathew's correlation coefficient.
Cross-validation 10-fold test for Random Forest.

Note. MCC: Mathew's correlation coefficient.
Cross-validation 10-fold test for Extra Tree.

Note. MCC: Mathew's correlation coefficient.
Cross-validation 10-fold test for Stacking.

Note. MCC: Mathew's correlation coefficient.
Based on the averaged five-fold cross-validation results, RF demonstrates the highest accuracy with an 87% advantage, as depicted in Figure 6.

Average accuracy chart for eNSMBL-PASD-XGB, eNSMBL-PASD-LGBM, eNSMBL-PASD-ExtraTree, eNSMBL-PASD-Stacking, eNSMBL-PASD-RF.
In addition to the previously mentioned tests, a five-fold cross-validation was performed on the data to assess the predictor’s accuracy. Results are available in Table 9 for all predictors (LGBM, XGB, RF, Extra Tree, and Stacking).
Cross-validation 5-fold comparison (LGBM, XGB, RF, Stacking and Extra Tree).

Note. LGBM: Light Gradient Boosting Machine; XGB: Extreme Gradient Boosting; RF: Random Forest; MCC: Mathew's correlation coefficient.
Results and analysis
It is important to diagnose autism driver genes in an early stage for timely treatment and therapy. Nowadays, such bioinformatics tools have gained significant importance and demand. The proposed computational predictor is systematically designed by amassing benchmark datasets, applying feature extraction and training through robust machine learning algorithms. Finally, the prediction model is tested on multiple validators utilizing various validation techniques. The test results revealed that eNSMBL-PASD-RF demonstrated the best performance by acquiring 91%, 100%, 87%, and 87% in independent testing, self-consistency, five-fold, and 10fold cross-validation, respectively. Similarly, eNSMBL-PASD-XGB demonstrated excellent performance, achieving 92%, 99%, 85%, and 85% accuracy in independent testing, self-consistency, five-fold, and 10-fold cross-validation, respectively. The other algorithm eNSMBL-PASD-ET has shown its accuracy as 88%, 100%, 86%, and 86% in independent testing, self-consistency, five-fold, and 10-fold cross-validation, respectively. The eNSMBL-PASD-LGBM has shown its accuracy as 88%, 94%, 83%, and 83% in independent testing, self-consistency, five-fold, and 10-fold cross-validation, respectively. The eNSMBL-PASD-Stacking has shown its accuracy as 91%, 100%, 85%, and 85% in independent testing, self-consistency, five-fold, and 10-fold cross-validation, respectively.
In comparison to prior research (CORR39, Resnik40, and Brainspan41) efforts, our study demonstrates a notable advancement in gene classification. CORR used a dataset of 146 autism samples and 54,613 gene expression features and employed four feature selection methods to reduce the dimensionality of the gene expression features to 100 prominent genes. Resnik40 utilized 588 ASD candidate genes and 1189 non-ASD genes and used semantic similarity measures from Gene Ontology (GO) for functional similarities of ASD and non-ASD genes. Brainspan41 used 604 positive ASD genes and 1594 non-ASD genes from developmental brain gene expression profiles and RNA transcript sequences and Applied an autoencoder network for dimensionality reduction and representation learning of developmental brain gene expression data.
CORR39 used a NN model with 10-fold cross-validation, achieving 78.6% accuracy. The NN model was optimized with hyperparameters such as learning rate and number of layers. Resnik40 applied RF, SVM (linear and radial kernels), and NB classifiers. RF achieved an AUC of 0.80 with 500 trees, square root feature selection at each split, and equal class weights. Brainspan41 used LR, SVM, and RF. Hyperparameters included an autoencoder for dimensionality reduction and feature selection, resulting in a receiver-operating characteristic curve (ROC) AUC of 0.78 with k-mer frequency features for RNA transcript sequences.
We systematically gathered a substantial dataset of positive genes, obtaining 3144 entries from NCBI, whereas restricted genes have been examined in previous studies. Diversity in classifier selection is a key strength of our work. We employed a comprehensive ensemble of RF, LGBM, XGB, ET, and the Stacking model. This diverse set of classifiers allowed for a comprehensive exploration of the gene classification landscape, surpassing the singular NN model used in Reference 39 and the limited set of classifiers (RF, NB, linear-SVM, and radial-SVM) in Reference. 40 Our ensemble approach, in particular, achieved remarkable success, reaching the highest accuracy of 91% in an independent dataset and 87% in a 10-fold cross-validation setup, outperforming the highest accuracy of 80% reported in reference39 80% in Resnik40, and 81% for LR and 82% for SVM in reference 41 under different conditions.
Additional verification and comparison of our proposed model involved rigorous testing against existing models from CORR39. Resnik, Brainspan41, and an Autoencoder (as shown in Figure 7).

Performance of the proposed predictor along with existing predictors.
Boundary and feature space visualization comparisons
The efficiency of RF representations is discussed in this section using boundary visualization and feature space visualization comparisons.
Figure 8 demonstrates how different classifiers use distinct decision boundaries to separate positive and negative classes. There were samples from both classes in the input data. Every classifier created an area of its own for classification. The ET and Stacking classifier demonstrated superior class separation, as it resulted in the fewest misclassified samples. The first row of samples highlights the challenges posed to the classifier due to non-linearity. These samples are not linearly separated, which is why ensemble methods like RF, ET, and XGB perform well, while LGBM struggles. The second row illustrates samples that require computational models capable of handling more complex decision boundaries, which are well-handled by ensemble classifiers, while LGBM again performs poorly. In the third row, all the samples have been depicted for each of the classifier, and the simplicity of the dataset allows even LGBM to perform well, as expected.

Boundary visualization for all classifiers.
The t-SNE algorithm converts both deep and human crafted feature representations into two-dimensional visualizations for analytical purposes. It minimizes the tendency for points to cluster at the center of the map by applying a stochastic neighborhood embedding variant to create 2D representations of complex, high-dimensional data.
The t-SNE visualization reveals a clearer boundary among the positive samples and the negative one with deep representations. This distinct separation suggests that a learning model could more easily classify these samples independently. In contrast, human-engineered representations exhibit significant overlap between the two classes, implying greater difficulty for a learning algorithm to achieve accurate separation. The t-SNE plots provided in Figure 9 represent a lower-dimensional mapping of high-dimensional feature spaces (522 features). These plots are designed to capture local and global structures in the data. However, t-SNE visualizations do not guarantee clear decision boundaries, especially when dealing with high-dimensional biological datasets, such as gene expressions related to ASD. These types of data often involve complex, non-linear relationships that may not always result in easily separable clusters in a 2D space.

Feature space visualization t-SNE on n_components 1, 2, 3, 4, and 5.
Discussion
The success of RF as the standout classifier in our work is closely intertwined with the pivotal role of feature extraction techniques in distilling essential genetic patterns from the benchmark dataset. Before applying the classifiers, feature extraction techniques such as PRIM (PRIM4, PRIM16, PRIM64), RPRIM (RPRIM4, RPRIM16, RPRIM64), FV determination, AAPIV (AAPIV4, AAPIV16, AAPIV64,) generation, RAAPIV (RAAPIV4, RAAPIV16, RAAPIV64) were employed, all these matrices based on mononucleotide, dinucleotide, and trinucleotide combinations. These techniques played a crucial role in capturing nuanced relationships between genetic sequences and identifying key genetic markers associated with autism. The distilled feature vectors served as the foundation for the subsequent classification process. Among the classifiers evaluated, RF consistently demonstrated high accuracy across various test scenarios, with an average accuracy of 0.87 in both 10-fold and five-fold cross-validations and 0.91 in independent tests. Its robustness was evident in accurately classifying both positive and negative instances, as reflected in commendable sensitivity/recall and specificity scores. With a well-balanced MCC score of approximately 0.41, RF showcased strong overall performance in classification tasks. While XGB also emerged as a strong contender, particularly excelling in specificity with an average specificity of 0.94 in both cross-validation tests, its slightly lower sensitivity/recall and MCC scores compared to RF indicated a marginally less robust performance across metrics. In contrast, although LGBM showcased competitive accuracy and specificity, its comparatively lower sensitivity/recall and MCC scores suggested areas for potential improvement. Among the remaining classifiers, Extra Tree and Stacking exhibited mixed results, with lower sensitivity/recall and MCC scores despite Extra Tree's high specificity and Stacking's perfect specificity. These findings align with the primary research objective of identifying an optimal classifier for autism-related genetic markers, supporting the hypothesis that ensemble methods, particularly RF, would outperform other classifiers in terms of accuracy and robustness. The high accuracy and balanced sensitivity/specificity scores confirm the hypothesis that RF's ability to handle complex genetic data would result in superior performance compared to other models.
Compared to previous studies, such as CORR39, Resnik40, and Brainspan41, which utilized NNs, RFs, and SVMs with limited datasets, our study demonstrates a significant advancement in terms of data diversity and classifier selection. By assembling a comprehensive dataset of 3144 genes from NCBI, our model surpassed the accuracy benchmarks of earlier efforts, achieving up to 91% accuracy in independent tests and outperforming CORR39's 80% accuracy and Resnik40’s 81%–82% accuracy. Our approach uniquely incorporates a diverse ensemble of classifiers, including RF, XGB, LGBM, ET, and Stacking, allowing for a broader exploration of gene classification possibilities, unlike the single-model focus seen in Reference 39 and limited classifiers used in Resnik40.
As a result, the success of RF as the best-suited classifier underscores the importance of feature extraction techniques in facilitating accurate predictive models for various machine learning applications, particularly in genetic sequence analysis and autism research. Our study does, however, have certain limitations. Even though the ensemble strategy performed well, the model's MCC and sensitivity scores in some classifiers were still lower than those in others. Furthermore, even though our dataset of 3144 genes is bigger than that of earlier research, more validation and expansion using a wider range of genetic data from different populations is necessary to increase the model's generalizability. Furthermore, since our model mainly uses feature extraction methods, future study could improve the model's performance by investigating different feature engineering strategies or deeper learning models.
Conclusion
Unlike other genetic disorders, autism cannot be diagnosed through blood tests, brain scans, or other medical examinations. Instead, doctors and psychologists rely on assessing the patient's history and observing their behavior to diagnose ASD. This is usually diagnosed when the patient is 18 months old or older. As the investigation is a curial issue, a predictor has been proposed using genetic sequences to diagnose autistic genetic disorders. The proposed machine learning model offers a more precise diagnostic tool for ASD, enhancing the accuracy of predictions and guiding tailored medical treatment plans effectively. Early identification through this method addresses the current diagnostic complexity, ensuring timely interventions crucial for optimizing developmental outcomes. In this work, different techniques have been triggered and utilized to evaluate the strength of predictors. In benchmark datasets, autism-suspected genes and passenger genes are categorized depending on their characteristics. Our work employs a thorough preprocessing methodology for the benchmark dataset, involving feature extraction techniques using PRIM (PRIM4, PRIM16, PRIM64), RPRIM (RPRIM4, RPRIM16, RPRIM64), FV determination, AAPIV (AAPIV4, AAPIV16, AAPIV64,) generation, and RAAPIV (RAAPIV4, RAAPIV16, RAAPIV64) based on single nucleotide combinations, dinucleotide combinations, and trinucleotide combinations. The eNSMBL-PASD model was trained on a diverse array of classification techniques, including Ensemble methods, XGB, RF, LGBM, and ET. The model was also observed through a rigorous validation process for its authentication. It has been analyzed that a RF predictor has shown marvelous results by accruing ∼91% accuracy in independent datasets and 87% in cross-validation (five-fold and 10-fold) tests. The benchmark dataset was compiled from the latest records at ncbi.org. Rigorous validation tests demonstrated that the RF model achieves superior accuracy and suitability compared to LGBM, ExtraTree, XGB, and Stacking. The current research will help in early diagnosis and treatment of autism by predicting using the genomic profile.
In this work, a novel, intelligent computational model for early-stage autism diagnosis is introduced. The model demonstrates superior accuracy (∼91%) in the analysis of genomic sequences, offering the potential to significantly improve early diagnosis.
In addition to its use by therapists, doctors, and other professionals for early ASD diagnosis, the model can be further enhanced to support personalized treatment plans by identifying specific gene variants linked to different ASD symptoms. Future research could also explore integrating the model with real-time genetic data and expanding its application to other neurodevelopmental disorders, improving overall diagnostic accuracy and treatment outcomes.
Supplemental Material
sj-csv-1-dhj-10.1177_20552076241313407 - Supplemental material for eNSMBL-PASD: Spearheading early autism spectrum disorder detection through advanced genomic computational frameworks utilizing ensemble learning models
Supplemental material, sj-csv-1-dhj-10.1177_20552076241313407 for eNSMBL-PASD: Spearheading early autism spectrum disorder detection through advanced genomic computational frameworks utilizing ensemble learning models by Ayesha Karim, Nashwan Alromema, Sharaf J Malebary, Faisal Binzagr, Amir Ahmed and Yaser Daanial Khan in DIGITAL HEALTH
Supplemental Material
sj-fasta-2-dhj-10.1177_20552076241313407 - Supplemental material for eNSMBL-PASD: Spearheading early autism spectrum disorder detection through advanced genomic computational frameworks utilizing ensemble learning models
Supplemental material, sj-fasta-2-dhj-10.1177_20552076241313407 for eNSMBL-PASD: Spearheading early autism spectrum disorder detection through advanced genomic computational frameworks utilizing ensemble learning models by Ayesha Karim, Nashwan Alromema, Sharaf J Malebary, Faisal Binzagr, Amir Ahmed and Yaser Daanial Khan in DIGITAL HEALTH
Supplemental Material
sj-fasta-3-dhj-10.1177_20552076241313407 - Supplemental material for eNSMBL-PASD: Spearheading early autism spectrum disorder detection through advanced genomic computational frameworks utilizing ensemble learning models
Supplemental material, sj-fasta-3-dhj-10.1177_20552076241313407 for eNSMBL-PASD: Spearheading early autism spectrum disorder detection through advanced genomic computational frameworks utilizing ensemble learning models by Ayesha Karim, Nashwan Alromema, Sharaf J Malebary, Faisal Binzagr, Amir Ahmed and Yaser Daanial Khan in DIGITAL HEALTH
Footnotes
Acknowledgements
This Project was funded by Deanship of Scientific Research (DSR) at King Abdulaziz University, Jeddah, under grant no. (GPIP: 1334-830-2024). The authors, therefore, acknowledge with thanks DSR for technical and financial support.
Contributorship
AK, NA, and YDK conducted the literature review and conceived the study. AK, NA, SJM, YDK and AA were involved in protocol development, data collection, and data analysis. AK, NA, and YDK wrote the first draft of the manuscript. AK and FB worked on the finalized draft. All authors reviewed and edited the manuscript and approved the final version of the manuscript.
Declaration of conflicting interests
The authors declared no potential conflicts of interest with respect to the research, authorship, and/or publication of this article.
Ethical approval and patient consent
This study utilized publicly available genomic sequences from open-access repositories (NCBI). As no new data were collected from human participants, informed consent and ethics approval were not required.
Funding
The authors disclosed receipt of the following financial support for the research, authorship, and/or publication of this article: This work was supported by the Deanship of Scientific Research (DSR) at King Abdulaziz University, Jeddah (grant number GPIP: 1334-830-2024).
Guarantor
Sharaf J. Malebary
References
Supplementary Material
Please find the following supplemental material available below.
For Open Access articles published under a Creative Commons License, all supplemental material carries the same license as the article it is associated with.
For non-Open Access articles published, all supplemental material carries a non-exclusive license, and permission requests for re-use of supplemental material or any part of supplemental material shall be sent directly to the copyright owner as specified in the copyright notice associated with the article.