
Abstract
Objectives
Neonatal early onset sepsis (EOS), bacterial infection during the first seven days of life, is difficult to diagnose because presenting signs are non-specific, but early diagnosis before birth can direct life-saving treatment for mother and baby. Specifically, maternal fever during labor from placental infection is the strongest predictor of EOS. Alterations in maternal heart rate variability (HRV) may precede development of intrapartum fever, enabling incipient EOS detection. The objective of this work was to build a predictive model for intrapartum fever.
Methods
Continuously measured temperature, heart rate, and beat-to-beat RR intervals were obtained from wireless sensors on women (n = 141) in labor; traditional manual vital signs were taken every 3–6 hours. Validated measures of HRV were calculated in moving 5-minute windows of RR intervals: standard deviation of normal-to-normal intervals (SDNN) and root mean square of successive differences (RMSSD) between normal heartbeats.
Results
Fever (>38.0 °C) was detected by manual or continuous measurements in 48 women. Compared to afebrile mothers, average SDNN and RMSSD in febrile mothers decreased significantly (p < 0.001) at 2 and 3 hours before fever onset, respectively. This observed HRV divergence and raw recorded vitals were applied to a logistic regression model at various time horizons, up to 4–5 hours before fever onset. Model performance increased with decreasing time horizons, and a model built using continuous vital signs as input variables consistently outperformed a model built from episodic vital signs.
Conclusions
HRV-based predictive models could identify mothers at risk for fever and infants at risk for EOS, guiding maternal antibiotic prophylaxis and neonatal monitoring.
Keywords
Introduction
Neonatal early onset sepsis (EOS), defined as invasive bacterial infection during the first seven days after birth, is a major public health problem. Despite recent advances, it still poses a significant threat of morbidity and mortality to newborns. The incidence of EOS is 1–2 per 1000 live births for infants born at ≥37 weeks gestation1,2 and 4.4 per 1000 live births for late preterm neonates born at 34–36 weeks gestation. 3
Early diagnosis of affected newborns by EOS is critical since timely treatment with antibiotics and hemodynamic support can be life-saving. 4 However, it is difficult to diagnose EOS in newborns because the presenting signs are non-specific. Mild respiratory distress or tachypnea can be attributed to normal neonatal cardiopulmonary adaptation but then progress rapidly to hemodynamic collapse. The general response of clinicians to this dilemma has been to over-diagnose EOS in any infant with trivial risk factors or mild symptoms, resulting in unnecessary neonatal intensive care unit (NICU) admissions for invasive testing and treatment. NICU admissions to rule out EOS also cause separation of babies from their mothers, interfering with breastfeeding and bonding.
A better approach to early diagnosis of EOS would be to define maternal risk factors that are known before birth and can predict EOS in the infant with high sensitivity and specificity. EOS usually results from ascending colonization of the maternal genital tract and uterine compartment during labor, leading to infection of the infant by maternal gastrointestinal and genitourinary microflora. Prenatal factors such as length of ruptured membranes and colonization with group B streptococci increase the risk of placental infection, which can progress to fetal infection. Consequently, maternal fever during labor is the strongest predictor of EOS. 5 Therefore, the most important intervention to ameliorate EOS is administration of intravenous antibiotics to mothers at risk, because treating the mother decreases both the likelihood of transmission of infection to the baby and the progression and severity of disease in infants who are infected. 6 Real-time dynamic monitoring of maternal vital signs during labor could potentially identify infants with EOS before birth, reducing unnecessary NICU admission and decreasing health costs. 7 However, adequate technology and predictive algorithms have not yet been validated.
Emerging technologies now support continuous streaming of vital sign measurements using relatively inexpensive wearable devices, a capability that was previously restricted to specialized telemetry and critical care units.8–11 These devices improve detection of subtle changes in vital signs and improve outcomes.12,13 We have shown that they can detect dynamic physiological changes during labor in real time, while correlating well with manual assessments. 14 Of note, we found that continuous measurements often detect fevers earlier than routine manual measurements by nurses. In addition, continuous measurements detect transient fevers that are missed by episodic measurements. Earlier detection of maternal fever can facilitate the identification of infants with impending EOS, enabling both prenatal antibiotic prophylaxis of the mother and timely treatment of infants before they are symptomatic. The degree of protection of the infant is proportionate to the number of hours before delivery the antibiotic treatment is started 15 ; therefore, treating mothers up to 5 hours earlier decreases the risk of transmission of infection to the infant.
The accuracy of predicting EOS using continuous wireless monitoring can likely be improved by building more sophisticated models incorporating multiple maternal vital signs. Continuous vital sign measurements using wearable sensors enable the accumulation of large datasets for building predictive models. Data science and machine learning algorithms, in conjunction with continuous vital sign monitoring, can be used to extract indicative patterns from patient medical information and provide support for early clinical decision-making. These models can objectively quantify risk and predict disease progression.16–29 While these algorithms do not provide a substitute for clinical experience, accurate models provide objective information about risk and avoid biases in clinical decision-making. Among many modeling approaches, logistic regression (LR) is a statistical model that allows for multivariable analysis of a binary dependent variable with parameters that scale linearly with the number of independent variables, reducing the amount of data needed to properly fit the model.30,31 It is commonly used to predict binary outcomes such as mortality32,33 or disease diagnosis.34–36
Heart rate variability (HRV) may be predictive of intrapartum fever and infection, potentially providing an early indicator of neonatal EOS. HRV represents the beat-to-beat fluctuations in heart rate. Different time-domain indices have been linked to short-term metrics of sympathetic nervous system (SNS) or parasympathetic nervous system (PNS) activity. In particular, standard deviation of normal-to-normal intervals (SDNN, ms) shows how the interbeat intervals of normal sinus beats vary over time, while root mean square of successive differences (RMSSD, ms) reflects beat-to-beat changes in consecutive heartbeats. Both SDNN and RMSSD have been shown to be reliable measures of short-term HRV.37–39 Importantly, HRV can be used as a biomarker for early diagnosis of infection40–44 and development of risk prediction models for sepsis,45–50 and ICU outcomes.51–53 However, no studies have measured its predictive ability for intrapartum fever.
Our objective was to develop a model using HRV to predict intrapartum fever. We computed two time-domain HRV indices from RR intervals and compared their temporal progression among febrile and afebrile groups relative to fever onset. We developed and compared the performance of models that relied on continuously or episodically measured vital signs, while also assessing multiple time horizons. These models could assist with early identification of mothers at risk of fever and guide maternal antibiotic prophylaxis to avoid neonatal EOS and facilitate postnatal treatment of infants at risk.
Methods
This study was approved by the Institutional Review Board at Northwell Health. Women were recruited at the time of admission to the Labor and Delivery Suite at Katz Women's Hospital of Long Island Jewish Hospital, in labor at >35 weeks gestational age and <6 cm cervical dilation, and written informed consent was obtained from all participants prior to study initiation, signed at the time of enrollment. Lifetemp (Isansys Ltd, Abingdon, UK) sensors were affixed in the axilla by a silicone gel adhesive, providing minute-by-minute measurements of temperature, minute-by-minute measurements of heart rate, and beat-to-beat RR intervals. Data were transmitted via Bluetooth to a dedicated tablet mounted to a mobile unit within 3 m of the bedside. Sensors were replaced as needed until delivery of the infant. Along with continuous vital signs, conventional (intermittent) vital signs were measured by nurses every 3–6 hours per routine.
Of 336 patients recruited, 141 had >4 hours of continuous data, >2 manual vital measurements, and sufficient reliable RR interval collection to be included for analysis (Figure 1(a)). Fevers (>38.0 °C) were identified, either by manual, continuous, or both measurement methods. Any temperatures below 35.5 °C and any heart rates over 220 beats per minute were excluded as invalid. Continuous recordings were then cropped from the first valid vital measurement to the final valid vital recording to exclude time periods when the sensor was off. Dropped data between these values remained within the analysis, as excluding these data can insert unforeseen bias into the model. Additionally, an imputation step to estimate missing values may incorrectly adjust the variance of the data.

Data and modeling summary schematics. (a) Patient recruitment and data refinement flowchart. (b) Logistic regression (LR) model development. Two LR models were developed to classify intrapartum fever and non-fever cases and to compare the value of continuous versus discrete vital sign data collection. Variables for the continuous LR model were temperature (T), heart rate (HR), standard deviation of normal-to-normal intervals (SDNN), and root mean square of successive differences (RMSSD) data averaged over the last 30 minutes before a specific timepoint, while the discrete LR model applied the most recent manually measured T and HR only, for the same timepoint. Four prediction time horizons were tested: 4–5, 3–4, 2–3, and 1–2 hours before fever onset. The LR models were validated by a four-fold leave-one-out cross-validation. All patients were shuffled, and each fold had approximately the same of number febrile and afebrile cases. Model performance was evaluated by calculated area under the curve (AUC) for receiver operating characteristic (ROC) and precision-recall (PR) curves.
Raw beat-to-beat RR intervals were calculated by taking the difference between timestamps for QRS intervals detected by the Lifetemp sensor. From RR intervals, SDNN and RMSSD were calculated by taking the standard deviation and RMSSD, respectively, of all RR values within a 5-minute moving window through each participant's recorded data. HRVs were averaged over all patients in febrile (n = 48) and afebrile (n = 93) groups. All time values in the febrile group were normalized to the time of fever onset as t = 0, while time values in the afebrile group were normalized to t = 0 as the mean time of fever onset in the febrile group, or 2.4 hours prior to delivery. Prior work details the validation of the continuously measured vital signs, compared to the corresponding episodically measured vital signs, and also quantifies the number fevers detected by either or both vital measurement methods.
14
Data analysis and model development were completed using MATLAB (MathWorks, Natick, MA, USA). Two LR models were developed to classify intrapartum fever and non-fever cases and to compare the value of continuous versus discrete vital sign data collection. The LR model is shown in equation (1), where P is the probability that the dependent variable is in a particular category, either fever or nonfever in this case, x is a vector of independent variables, and
Statistical analysis
The LR models were validated by a four-fold leave-one-out cross-validation. All patients were shuffled, and each fold had approximately the same of number febrile and afebrile cases. Model performance was evaluated by calculated area under the curve (AUC) for receiver operating characteristic (ROC) and precision-recall (PR) curves.
Results
Fevers were detected in 48 of 141 subjects included in the analysis (Table 1). Raw recorded vital signs (T and HR), along with calculated HRV features (SDNN and RMSSD), were applied to an LR model (Figure 1(b)) to predict the probability of intrapartum fever at various time horizons, from up to 4–5 hours before fever onset.
Data summary statistics.

An example of patient vital sign data and corresponding calculated HRV is displayed in Figure 2. As shown by the first row, fever was detected by both continuous and manual measurement methods; however, fever was detected nearly 40 minutes earlier by the continuous measurement, shown by the dotted vertical line. The second row displays the minute-by-minute heart rate changes, while the third and fourth rows show SDNN and RMSSD, respectively, calculated from the recorded R–R intervals. Birth is denoted by the solid vertical line at t = 0.

Example of recorded and calculated data. Shown is an example of all data corresponding to one patient. From top, temperature, heart rate, standard deviation of normal-to-normal intervals (SDNN), and root mean square of successive differences (RMSSD) were tracked during maternal labor, with t = 0 (vertical black solid line). Fever onset occurs approximately 128 minutes before delivery (vertical black dotted line). The blue traces for temperature and heart rate represent continuous data recorded by the wireless vital sign monitoring device, while the red trace shows manually taken temperatures. The yellow and purple traces for SDNN and RMSSD, respectively, are calculated from RR interval data recorded by the wireless vital sign monitoring device.
HRV was averaged over all patients in febrile and afebrile groups (Figure 3). Compared to non-fever cases, the average SDNN and RMSSD in fever cases show a significant decrease (ANOVA, p < 0.001) approximately 2 and 3 hours before fever onset (t = 0), respectively. The divergence in these indices between non-fever and fever cases suggests an underlying separation in HRV features that could be used to build a predictive model for maternal fever onset during labor. There was no significant difference between non-fever and fever cases in frequency-domain indices for HRV, as shown by the average LF/HF ratio.
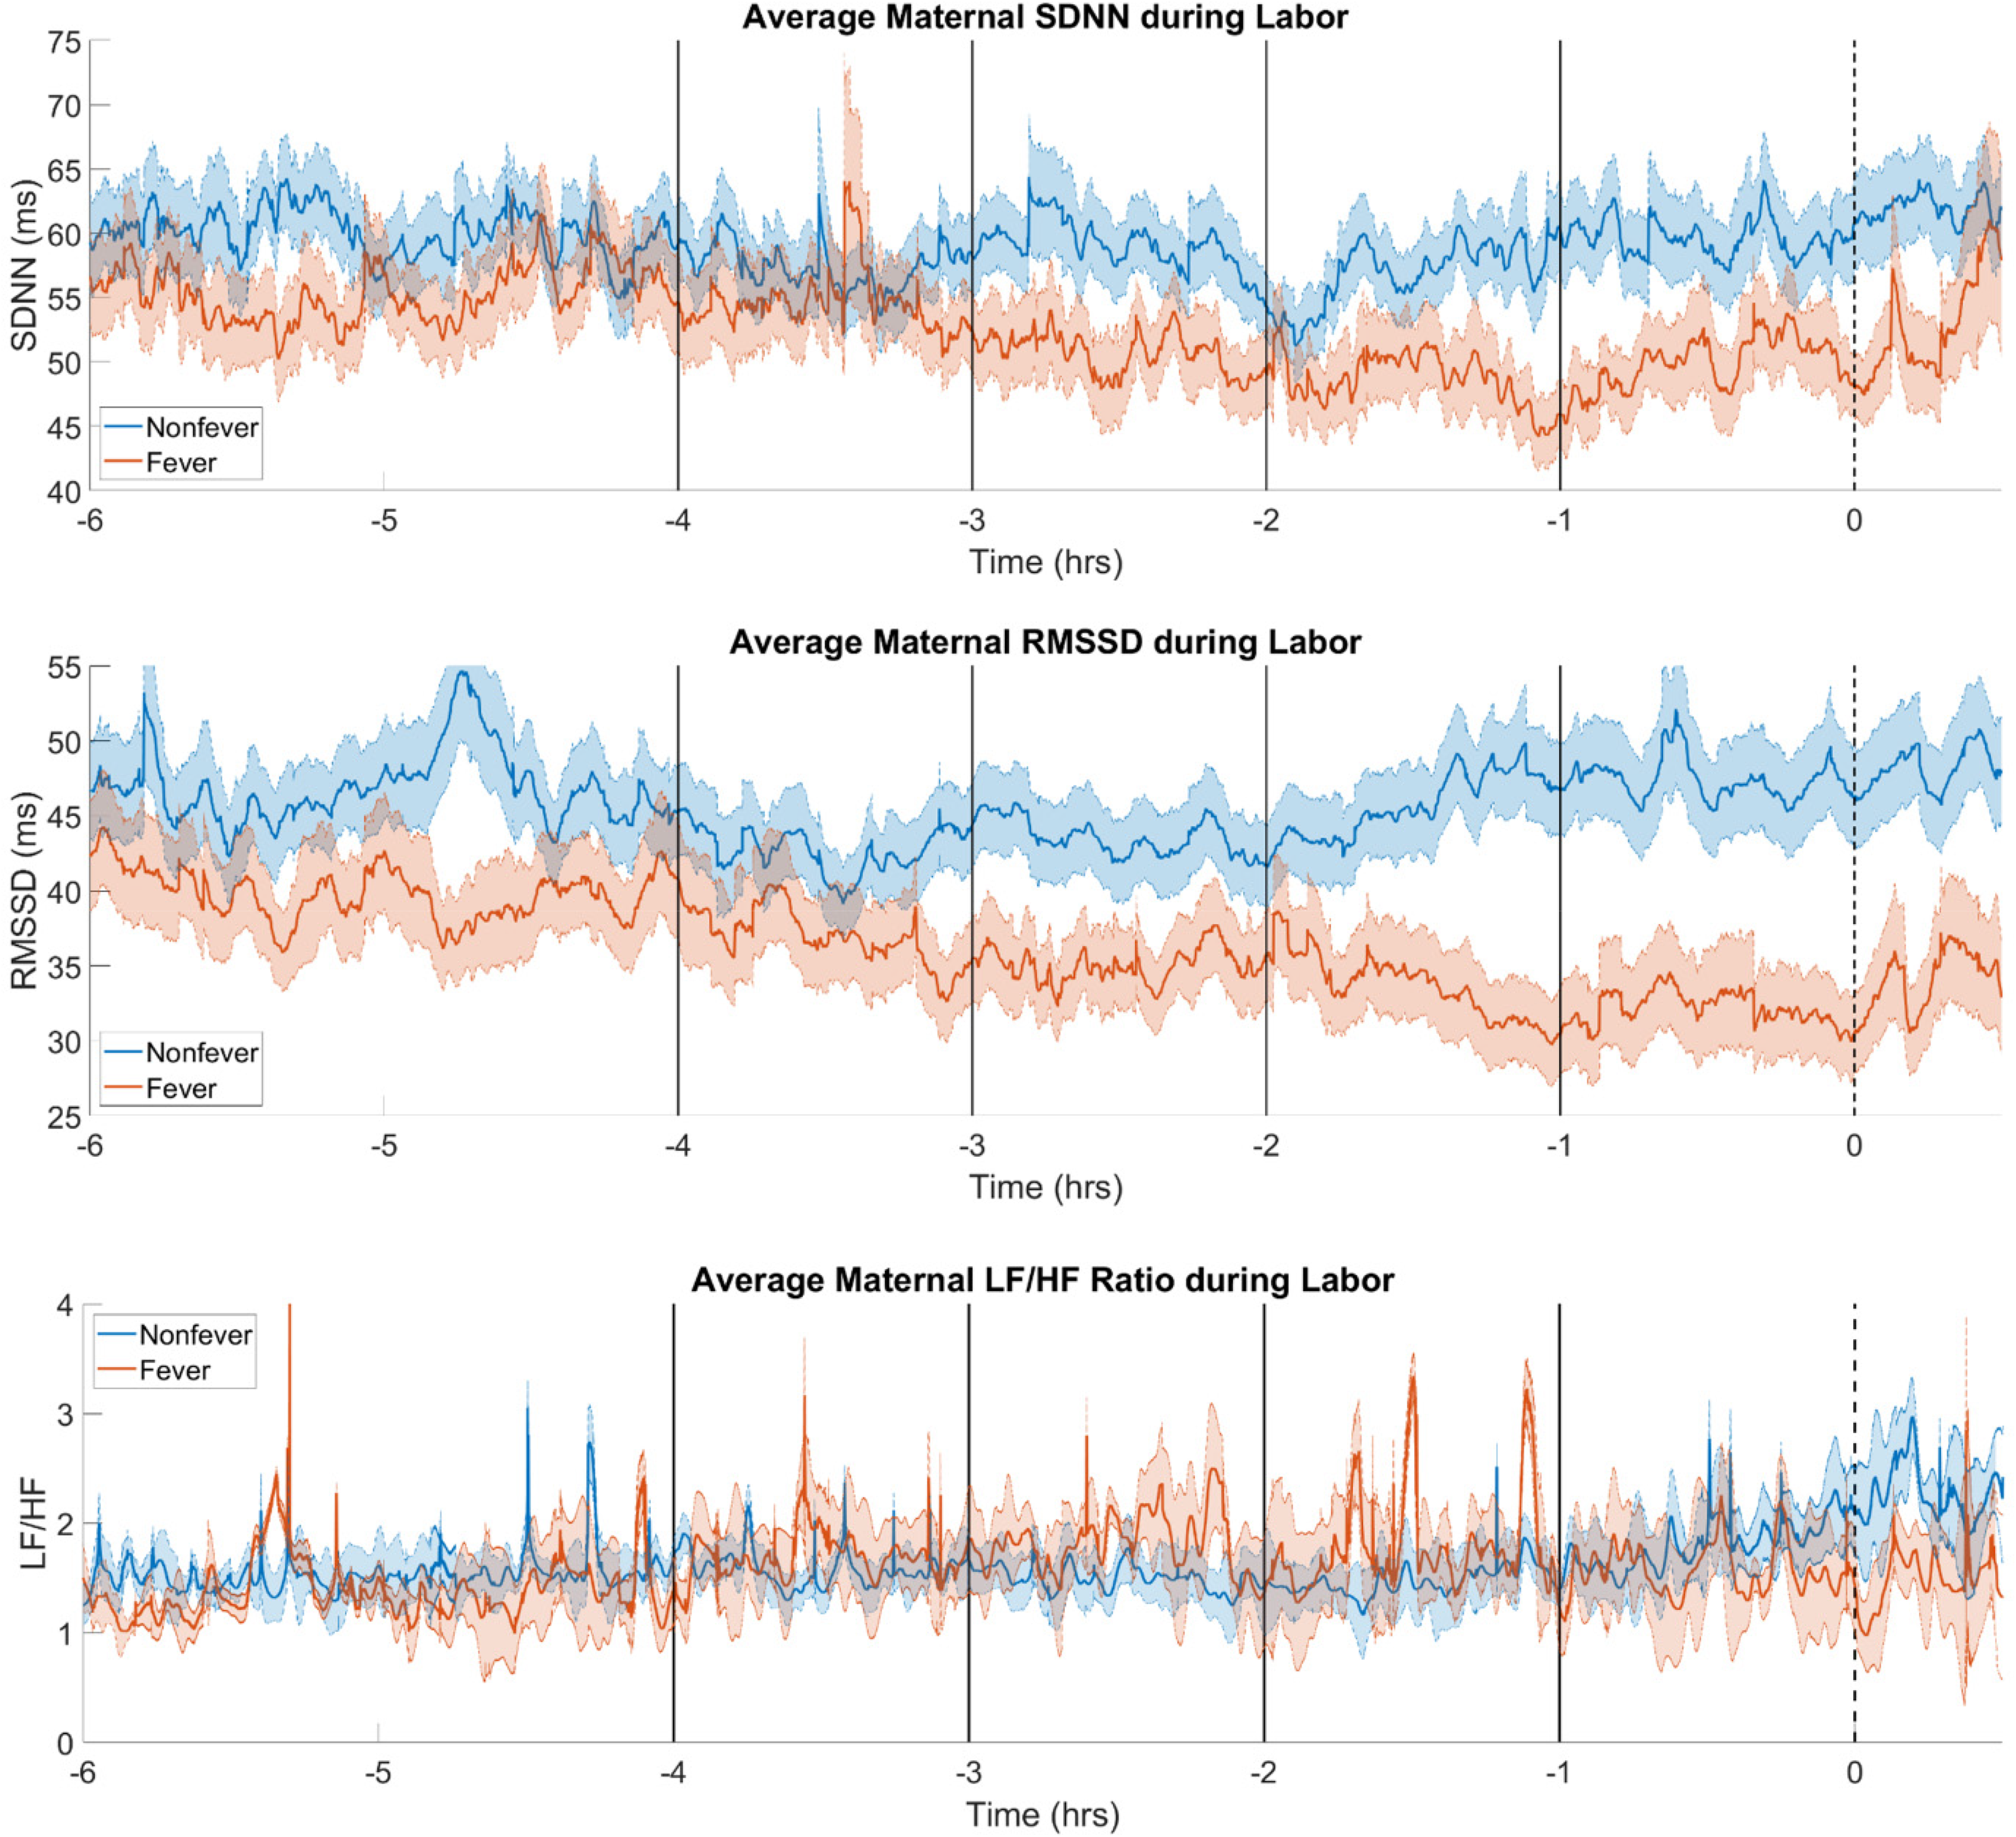
Average heart rate variability (HRV) during labor. HRVs were averaged over all patients in afebrile (blue) and febrile (red) groups. For the febrile group, t = 0 was defined as onset of fever. For afebrile group, t = 0 was defined 2.4 hours prior to delivery, corresponding to the mean time of fever onset in the febrile group. Average maternal standard deviation of normal-to-normal intervals (SDNN) and root mean square of successive differences (RMSSD) showed significant separation between febrile and afebrile cohorts at 2 and 3 hours prior to fever onset, respectively. Average maternal LF/HF ratio did not show a significant difference between afebrile and febrile groups.
Two sets of variables, continuous and discrete, served as predictors for LR models to classify intrapartum fever and non-fever cases. With a time horizon of 4–5 hours, the continuous model achieved an ROC AUC of 0.645 while the discrete model had an ROC AUC of 0.470 (Figure 4(a)). These values both increased at the time horizon of 2–3 hours, with the ROC AUC of the continuous and discrete models of 0.748 and 0.639, respectively (Figure 4(b)). As expected, the average AUC increased with decreasing time horizon values, and the model built with continuous variables always outperformed that built with discrete variables (Figure 4(c)).

Model performance illustrated by receiver operating characteristic (ROC) curves. ROC curves for predicting intrapartum fever at time horizon of (a) 4–5 hours and (b) 2–3 hours are shown. Dotted lines show performance evaluated for individual folds, and the solid line shows the average performance of the model with continuous (red) and discrete (blue) input variables. (c) The area under the curve (AUC) increases with decreasing time horizon values. Empty markers show AUC of individual folds, and filled markers show the average performance of the model with continuous (red) and discrete (blue) input variables.
Model performance was also evaluated by comparing PR AUC values at various time horizons. At 4–5 hours before fever onset, the continuous model had a PR AUC of 0.448 while the discrete model produced a PR AUC of 0.311 (Figure 5(a)). The continuous model achieved a PR AUC of 0.565 at the 2- to 3-hour horizon, while the PR AUC of the discrete model was 0.374 (Figure 5(b)). As with the ROC performance, PR AUC values increased with smaller time horizons (Figure 5(c)).

Model performance illustrated by precision-recall (PR) curves. PR curves for predicting intrapartum fever at time horizon of (a) 4–5 hours and (b) 2–3 hours are shown. Dotted lines show performance evaluated for individual folds, and the solid line shows the average performance of the model with continuous (red) and discrete (blue) input variables. (c) The area under the curve (AUC) increases with decreasing time horizon values. Empty markers show AUC of individual folds, and filled markers show the average performance of the model with continuous (red) and discrete (blue) input variables.
Discussion
We developed an LR model that predicts intrapartum fever using raw and calculated biomarkers from continuous vital sign monitoring during labor. Temperature and heart rate measurements were augmented with calculated HRV metrics, and the model was evaluated for predictive performance out to 4–5 hours before potential fever onset. Our previously published work has shown that episodes of fever are often unrecognized or missed by manual data collection, and using continuous vital sign data during labor allows detection of those cases, justifying the relatively high incidence of low-grade fevers in this randomly enrolled cohort. 14 In this work, we demonstrate the use of HRV to augment this fever detection further, for up to 5 hours before the continuous temperature measurements alone. This model can facilitate early identification of newborns at risk for EOS, because maternal fever during labor is the strongest known predictor of EOS. Early identification of incipient fever by HRV before delivery can identify infants who were exposed to uteroplacental infection but whose mothers did not yet develop a fever; this can guide appropriate monitoring of infants at elevated risk after birth. Conversely, identification of infants at low risk of EOS can prevent unnecessary postnatal testing, monitoring, and maternal-infant separation. Lengthening maternal antibiotic treatment, which would decrease the risk score from sepsis risk calculators, can allow infants to stay with their mothers after delivery, rather than be admitted to NICU observation or treatment. 7 Earlier assessment of risk for EOS will enable earlier antibiotic treatment of both mother and infant. 4
HRV indices reflect heart–brain interactions and autonomic nervous system processes that regulate heart rate, blood pressure, respiration, digestion, and, importantly for this work, body temperature. Time-domain, frequency-domain, and nonlinear HRV metrics over varying monitoring periods, from 2 minutes to 24 hours, can quantify autonomic nervous system function and its implications on clinical health.39,54,55 SDNN and RMSSD are time-domain indices of HRV reliable at a short-term recording period of 5 minutes.56,57 SDNN reflects both SNS and PNS nervous system activity and is also highly correlated with multiple frequency-domain HRV metrics. 58 Meanwhile, RMSSD is linked to the contribution of the PNS towards regulation of heart rate, which can indicate vagal tone.59,60 Decreased SDNN and RMSSD are consistent with PNS dysfunction 39 ; SNS hyperactivity, in response to PNS impairment, could contribute to fever development. 61 A healthy PNS also acts as an anti-inflammatory neural circuit, and any dysfunction can contribute to inflammation and, subsequently, fever.62,63
Therefore, maternal HRV could be useful for building predictive models for intrapartum fever. As shown in other studies, HRV can be predictive of infections40,41 that are usually accompanied by fever episodes.42,43 In our data, average maternal SDNN and RMSSD showed significant separation between febrile and afebrile cohorts at 2 and 3 hours prior to fever onset, respectively. Even before a patient's body temperature increases above the threshold for fever classification, there is a decrease in these time-domain HRV metrics, showing the importance of including such indices in any model for fever prediction.
The significant changes in HRV align with the increase in predictive performance from the time horizon of 4–5 and 3–4 hours before fever to that of 2–3 hours before fever onset. Although this performance increased further into 1–2 hours before fever, this marginal improvement can be attributed to the contribution of increasing temperature towards the fever threshold of 38 °C. Further, the model built with continuous vital sign measurements consistently outperformed the model using discrete inputs from conventional manual vital signs. This emphasizes the safety and accuracy of continuous vital sign monitoring during maternal labor, as these future mothers persevere through vigorous and dynamic biological changes while giving birth. Infrequent vital sign measurements may miss or belatedly capture biomarker variations that are crucial for optimizing the outcome of the mother–baby dyad.
This study has several limitations. The total number of patients, particularly the number of fever cases, is not particularly high, reflecting the difficulties of the collection of such data in the specific setting. Similarly, only LR modeling was evaluated for this dataset. Because of the small cohort, LR modeling provided a parsimonious method of multivariate analysis to prevent overfitting and assess the value of only a few preselected predictors. More data would allow the deployment of models with increased complexity to analyze and evaluate interactions between variables, as well as cover nonlinearities in the data. Other input variables may include pregnancy complications, such as hypertension, gestational diabetes, and existing infections, to forecast probabilities of labor and delivery complications like postpartum hemorrhage and abnormal fetal heart rate; however, inclusion of more inputs to predictive models would require a larger dataset.
Conclusions
Leveraging minute-by-minute vital signs data, we built and validated a simple statistical model to identify patients who may develop fever during labor and present risk for EOS for their newborns. This model is another example of how continuous vital sign data can be used to build machine learning models that can objectively quantify risk for clinical application and treatment optimization. By using non-invasive and real-time monitoring, this model can prevent NICU admissions and decrease health costs associated with treatment of newborns for sepsis.
Footnotes
Acknowledgements
We wish to thank the labor and delivery nursing staff at Katz Women's Hospital for their valuable support on this project.
Contributorship
SD, RK, BW, and TPZ researched literature and conceived the study. RK, NS, and DP were involved in protocol development, ethical approval, patient recruitment, and data acquisition. SD and TPZ derived the model framework, and SD analyzed the data and prepared all figures. SD, RK, BW, and TPZ wrote the manuscript. All authors discussed results, provided critical feedback, and edited and approved the final version of the manuscript.
Declaration of conflicting interests
The author(s) declared no potential conflicts of interest with respect to the research, authorship, and/or publication of this article.
Ethical approval
This study was approved by the Institutional Review Board at Northwell Health, and informed consent was obtained from all participants.
Funding
The author(s) disclosed receipt of the following financial support for the research, authorship, and/or publication of this article: This study was funded by a Stacey and Steven Hoffman Clinical Care Innovations Grant from the Katz Institute for Women's Health Innovation Grants Program.
Guarantor
TZ.