
Abstract
Background
Computer vision syndrome (CVS) is a growing occupational health concern linked to extensive digital device use, yet robust predictive models for risk identification remain scarce. This study aimed to evaluate and compare traditional and machine learning-based predictive models for CVS by assessing their accuracy in identifying CVS cases as defined by the CVS-Q© questionnaire, which served as the gold standard.
Methods
A cross-sectional study was conducted among 90 Portuguese workers regularly exposed to digital display devices. Data were collected via a self-administered questionnaire covering age, sex, refractive errors, daily screen time, and symptoms assessed with the validated CVS-Q©. Participants were classified as symptomatic or non-symptomatic (CVS-Q© score ≥6). Predictive models were developed using logistic regression and four machine learning algorithms: random forest (RF), Gradient Boosting Machine (GBM), eXtreme Gradient Boosting (XGBoost), and Support Vector Machine (SVM), with Synthetic Minority Over-sampling Technique (SMOTE) augmentation and repeated 5-fold cross-validation.
Results
Logistic regression and XGBoost demonstrated the highest accuracy (70.6%) and strong discriminative ability (AUC = 0.773 and 0.758, respectively). All models exhibited high sensitivity (≥72.7%), though specificity varied from 16.7% (random forest) to 50% (SVM, XGBoost). Calibration was acceptable across models (Brier scores 0.21–0.25). Female sex was the only statistically significant predictor in logistic regression (OR = 5.14, p = 0.012), while sex, screen time, and age were consistently the most influential variables in machine learning models. Refractive errors contributed minimally.
Conclusions
Our results indicate that predictive modeling shows promise for CVS risk identification in occupational settings, particularly using demographic and behavioral variables. However, the limited and unrepresentative sample warrants caution, and further research with larger cohorts is needed to confirm these preliminary findings and assess their scalability.
Keywords
Introduction
The widespread integration of digital technologies into work, education, and leisure has profoundly transformed modern life. Computers, tablets, and smartphones are now indispensable, but their excessive use has been linked to a range of visual and musculoskeletal problems.1–3 Among these, computer vision syndrome (CVS), also known as digital eye strain, is one of the most prevalent conditions.1,4
CVS is characterized by blurred vision, dry eyes, headaches, and musculoskeletal discomfort, which collectively reduce quality of life and affect work and learning efficiency.1,2,4–6
Epidemiological evidence suggests that CVS affects a large share of digital screen users worldwide, with prevalence estimates ranging from 50%7,8 to over 90% 9 in certain populations, including students and healthcare professionals.10,11 The condition is driven by multiple, interacting risk factors such as uncorrected visual errors, prolonged screen exposure, poor ergonomics, and demographic influences.12,13 Beyond its ocular symptoms, CVS has been associated with sleep disturbances, circadian rhythm disruption, and psychological distress, further underscoring its public health relevance.14–17
Artificial intelligence (AI) and its subset, machine learning (ML), are increasingly revolutionizing diverse areas of healthcare. For instance, advanced ML techniques are being applied to hematology and hematopathology, shaping the future of blood disorder management through improved pattern recognition and data analysis. 18 In diagnostic imaging, Porkar et al. 19 demonstrated how ML, specifically self-organizing map neural networks, can significantly enhance the segmentation and diagnosis of cancer zones in MRI images, even in the presence of image noise and variability. In drug discovery, AI methodologies, including deep learning and language models, are accelerating the identification of novel antimicrobial agents, optimizing drug design, and predicting mechanisms of antimicrobial resistance (AMR), thereby addressing urgent global health threats such as AMR. 20 Together, these examples underscore the transformative impact of AI across multiple domains in medicine, from diagnostic imaging and disease management to drug development and personalized therapy.
Despite the high prevalence and impact of CVS, most existing research has been limited to cross-sectional studies with descriptive or simple statistical analyses. While these studies provide estimates of prevalence and associations with risk factors, they fall short in predicting which individuals are most at risk.4,21–23 Currently, there is a lack of validated predictive models that integrate demographic, clinical, and behavioral variables, and only a few studies have compared traditional regression methods with advanced ML techniques in this context.7,8,24,25
Developing and validating predictive models for CVS has implications that extend beyond the scope of clinical optometry. In occupational health, these tools can guide the implementation of targeted preventive measures such as personalized ergonomic adjustments, scheduled screen breaks, and visual hygiene education.4,26 From a public health perspective, predictive models can contribute to policymaking by identifying vulnerable subgroups, estimating the burden of disease, and guiding resource allocation.8,27 Additionally, within educational and remote work environments, especially post-pandemic, automated risk assessment tools may support institutional health policies and promote effective well-being strategies.28,29
The present study aims to address this gap by developing and evaluating predictive models for CVS risk using the CVS-Q© questionnaire as the gold standard for case identification. By comparing logistic regression with ML algorithms, including random forest, Gradient Boosting, XGBoost, and Support Vector Machines (SVM), we assessed and contrasted their precision in predicting CVS as defined by the CVS-Q©. The objective was to determine which methods provide the most accurate, interpretable, and generalizable predictions relative to this reference standard. Beyond its methodological contribution, this work has practical implications for occupational health, education, and public health policy, where predictive tools could support early identification, preventive strategies, and resource allocation.
Methods
Study design and population
A cross-sectional exploratory observational study was conducted between January and March 2025 among Portuguese adults who regularly use digital display devices (DDDs), such as computers, tablets, or smartphones in their occupational settings. Eligible participants were aged 18 years or older and reported using DDDs for at least 4 h per workday as part of their occupational activities. This inclusion criterion is consistent with previous CVS studies, which typically define regular use as exposure to screens for at least 3–4 h per day.2,30 Individuals with less than 4 h of daily screen exposure or incomplete data were excluded from the analysis. The study followed the ethical standards of the Declaration of Helsinki and was approved by the Ethics Committee of the Higher Institute of Education and Sciences of Lisbon (ISEC Lisbon) on 10 October 2024 (approval ID: CE/2024/10/10). All participants received detailed information about the study and provided written informed consent prior to inclusion.
Sample size and participant selection
A total of 100 adults were initially recruited during the period January–March 2025. Of these, 10 participants were excluded (6 due to incomplete questionnaire data and 4 for not meeting the minimum daily screen exposure criterion of 4 h per workday). All remaining eligible adults were included, resulting in a final sample of 90 participants. Recruitment aimed to maximize occupational diversity, including administrative, healthcare, education, and technical staff. A post-hoc statistical power analysis was conducted to assess the adequacy of the sample size for detecting the association between sex and CVS status. A chi-square test of independence applied to the 2 × 2 contingency table (sex × CVS status) yielded a statistically significant result (χ² = 7.83, df = 1, p = 0.005). The effect size was calculated using Cohen's w, defined as:

Data collection and variables
Data were collected through a self-administered online questionnaire distributed via digital platforms, such as Google Forms, WhatsApp, Facebook, and email. The questionnaire captured a range of variables:
Sociodemographic data: age (continuous, in years) and sex (binary: male or female); Occupational factors: average daily screen time during the workday (continuous, in hours) and regular contact lens use (binary: yes or no); Clinical history: self-reported refractive errors, including myopia, hyperopia, and astigmatism.
Symptom assessment was conducted using the Computer Vision Syndrome Questionnaire (CVS-Q©), originally validated by Seguí et al. 30 and recently translated and culturally adapted into Portuguese (CVS-Q PT©). 33 The Portuguese version was translated, back-translated, pre-tested, and validated in a sample of 280 workers, showing good internal consistency (α = 0.793), temporal stability (ICC = 0.847), sensitivity of 78.5%, specificity of 70.7%, and a discriminative ability AUC of 0.832. In the validation study, more than 96% of participants reported no difficulties completing the questionnaire, and 84% considered it clear and easy to understand. The CVS-Q© includes 16 symptoms commonly associated with prolonged digital screen use, such as eye burning, dry eyes, blurred vision, headaches, and difficulty focusing, among others. Each symptom is rated along two dimensions: frequency (never, occasionally, or frequently/always) and intensity (moderate or severe). If a symptom is reported as “never,” it automatically receives a score of zero for intensity. The final score is calculated by multiplying frequency by intensity for each symptom and then summing the values across all items. According to the criteria established in the original validation, a participant is considered to have CVS symptoms if they score six or more points. Consistent with the original and Portuguese validation studies, a total score of ≥6 was used to classify participants as symptomatic, indicating clinically relevant CVS.
Statistical analysis
Data analysis was conducted using R software (version 4.3.1). Descriptive statistics were used to characterize the sample. Group comparisons (with and without CVS) were performed using Student's t-tests for continuous variables and chi-square tests for categorical variables, with a significance level of p < 0.05.
To evaluate the predictive capacity of the variable set, a binary logistic regression model was fitted. This model included age, sex, refractive errors, and daily screen exposure time as predictors. Subsequently, ML algorithms (random forest, Gradient Boosting Machine (GBM), XGBoost, and SVM) were trained and evaluated to compare their performance with the traditional model.
All models were trained on 80% of the data and validated on the remaining 20%. To address class imbalance (presence/absence of CVS), the Synthetic Minority Over-sampling Technique (SMOTE) was applied, and 5-fold cross-validation repeated three times was used. For each predictive model, the following performance metrics were calculated and reported: accuracy (overall correct classification rate), sensitivity (true positive rate), specificity (true negative rate), and area under the receiver operating characteristic curve (AUC). Models were evaluated based on accuracy, sensitivity, specificity, AUC, calibration (calibration curves and Brier score), and variable importance analysis.
Logistic regression, random forest, GBM, eXtreme Gradient Boosting (XGBoost), and SVM were selected as widely used, well-established approaches for binary classification in health research. Other, more complex algorithms were not applied due to the relatively small sample size.
Results
Sample characteristics
A total of 90 valid records were analyzed after excluding entries with missing values in the variables selected for the predictive models. The sample included 59 participants who were classified as symptomatic for CVS, while 31 were non-symptomatic.
The mean age in the CVS group was 41.5 ± 10.2 years, compared to 40.4 ± 11.7 years in the non-CVS group, with no statistically significant differences (t = –0.42; p = 0.673). However, a significantly higher proportion of women was observed in the CVS group (84.7%) compared to the non-CVS group (58.1%) (χ² = 6.46, p = 0.011).
Regarding refractive errors, myopia was reported by 51% of participants with CVS and 68% of those without, though the difference was not statistically significant (χ² = 1.72; p = 0.189). Hyperopia was more frequent in the CVS group (31%) than in the group without symptoms (13%), although this difference was not statistically significant (χ² = 2.52; p = 0.112). Astigmatism was observed in 66% of the CVS group and 71% of the non-CVS group, with no significant differences (χ² = 0.05; p = 0.817). Finally, participants with CVS reported longer daily screen exposure time (6.5 ± 2.9 h) compared to the group without symptoms (5.5 ± 2.9 h), although this difference also did not reach statistical significance (t = –1.73; p = 0.089).
Logistic regression model
A binary logistic regression model was applied to predict the presence of CVS based on age, sex, refractive errors (myopia, hyperopia, astigmatism), and daily screen time. The model demonstrated an acceptable overall fit (AIC = 94.4; residual deviance = 80.4, df = 66), with an AUC of 0.77, indicating moderate discriminative performance (Figure 1). The logistic regression model was trained on a subset of 73 participants (80%) and validated on an independent test set of 17 participants (20%).

ROC curve of the logistic regression model.
Among the predictors included in the logistic regression model, sex emerged as the only statistically significant predictor (OR = 5.14, 95% CI: 1.42–18.56, p = 0.012), indicating that female participants had approximately five times higher odds of reporting CVS symptoms compared to males. The other predictors were not statistically significant but were retained in the model due to their theoretical relevance in the context of CVS risk. The confusion matrix revealed an overall accuracy of 64.7%, sensitivity of 33.3%, and specificity of 81.8%.
Random forest model
A random forest classification model comprising 500 decision trees was implemented to evaluate the performance of a ML approach compared to traditional logistic regression. The model achieved an AUC of 0.71 (Figure 2), indicating moderate discriminatory performance.

ROC curve of the random forest model.
The confusion matrix revealed an accuracy of 70.6%, with a sensitivity of 16.7%, specificity of 100%, and balanced accuracy of 58.3%. The model correctly classified nearly all negative cases (high specificity) but performed poorly in identifying positive cases (low sensitivity). The positive predictive value was 100%, while the negative predictive value was 68.8%. The Cohen's Kappa coefficient was 0.21, suggesting slight agreement beyond chance. The analysis of variable importance (Figure 3) indicated that sex, screen time, and hyperopia were the most influential predictors, followed by age, myopia, and astigmatism. These findings were consistent across the Mean Decrease in Accuracy and Gini indices.

Variable importance plot from the random forest model.
Other models
The comparative performance of the predictive models is illustrated in the joint ROC plot (Figure 4). In terms of classification metrics, both GBM and XGBoost achieved an overall accuracy of 58.8%. Sensitivity values were 72.7% for GBM and 81.8% for XGBoost, while specificity values were 33.3% and 16.7%, respectively. The SVM model demonstrated a more balanced performance, with a sensitivity of 63.6%, specificity of 50.0%, and an accuracy of 58.8%. However, the differences in AUC between the logistic regression model and the other approaches were not statistically significant, as assessed by DeLong's test: random forest (Z = 0.33, p = 0.739, 95% CI [–0.30, 0.42]), GBM (Z = 0.74, p = 0.458, 95% CI [–0.17, 0.39]), XGBoost (Z = 0.55, p = 0.580, 95% CI [–0.23, 0.41]), and SVM (Z = 0.75, p = 0.456, 95% CI [–0.12, 0.27]). In terms of predictor importance, both GBM and XGBoost models identified age as the most influential variable, followed by daily screen time and sex, whereas refractive errors played a negligible role in model performance. A similar pattern was observed in the SVM model, which also assigned highest importance to age, screen time, and sex. Overall, across all ML models, demographic factors (particularly age and sex) and screen exposure time consistently emerged as the primary contributors to CVS risk in this cohort, while refractive errors showed limited predictive value.
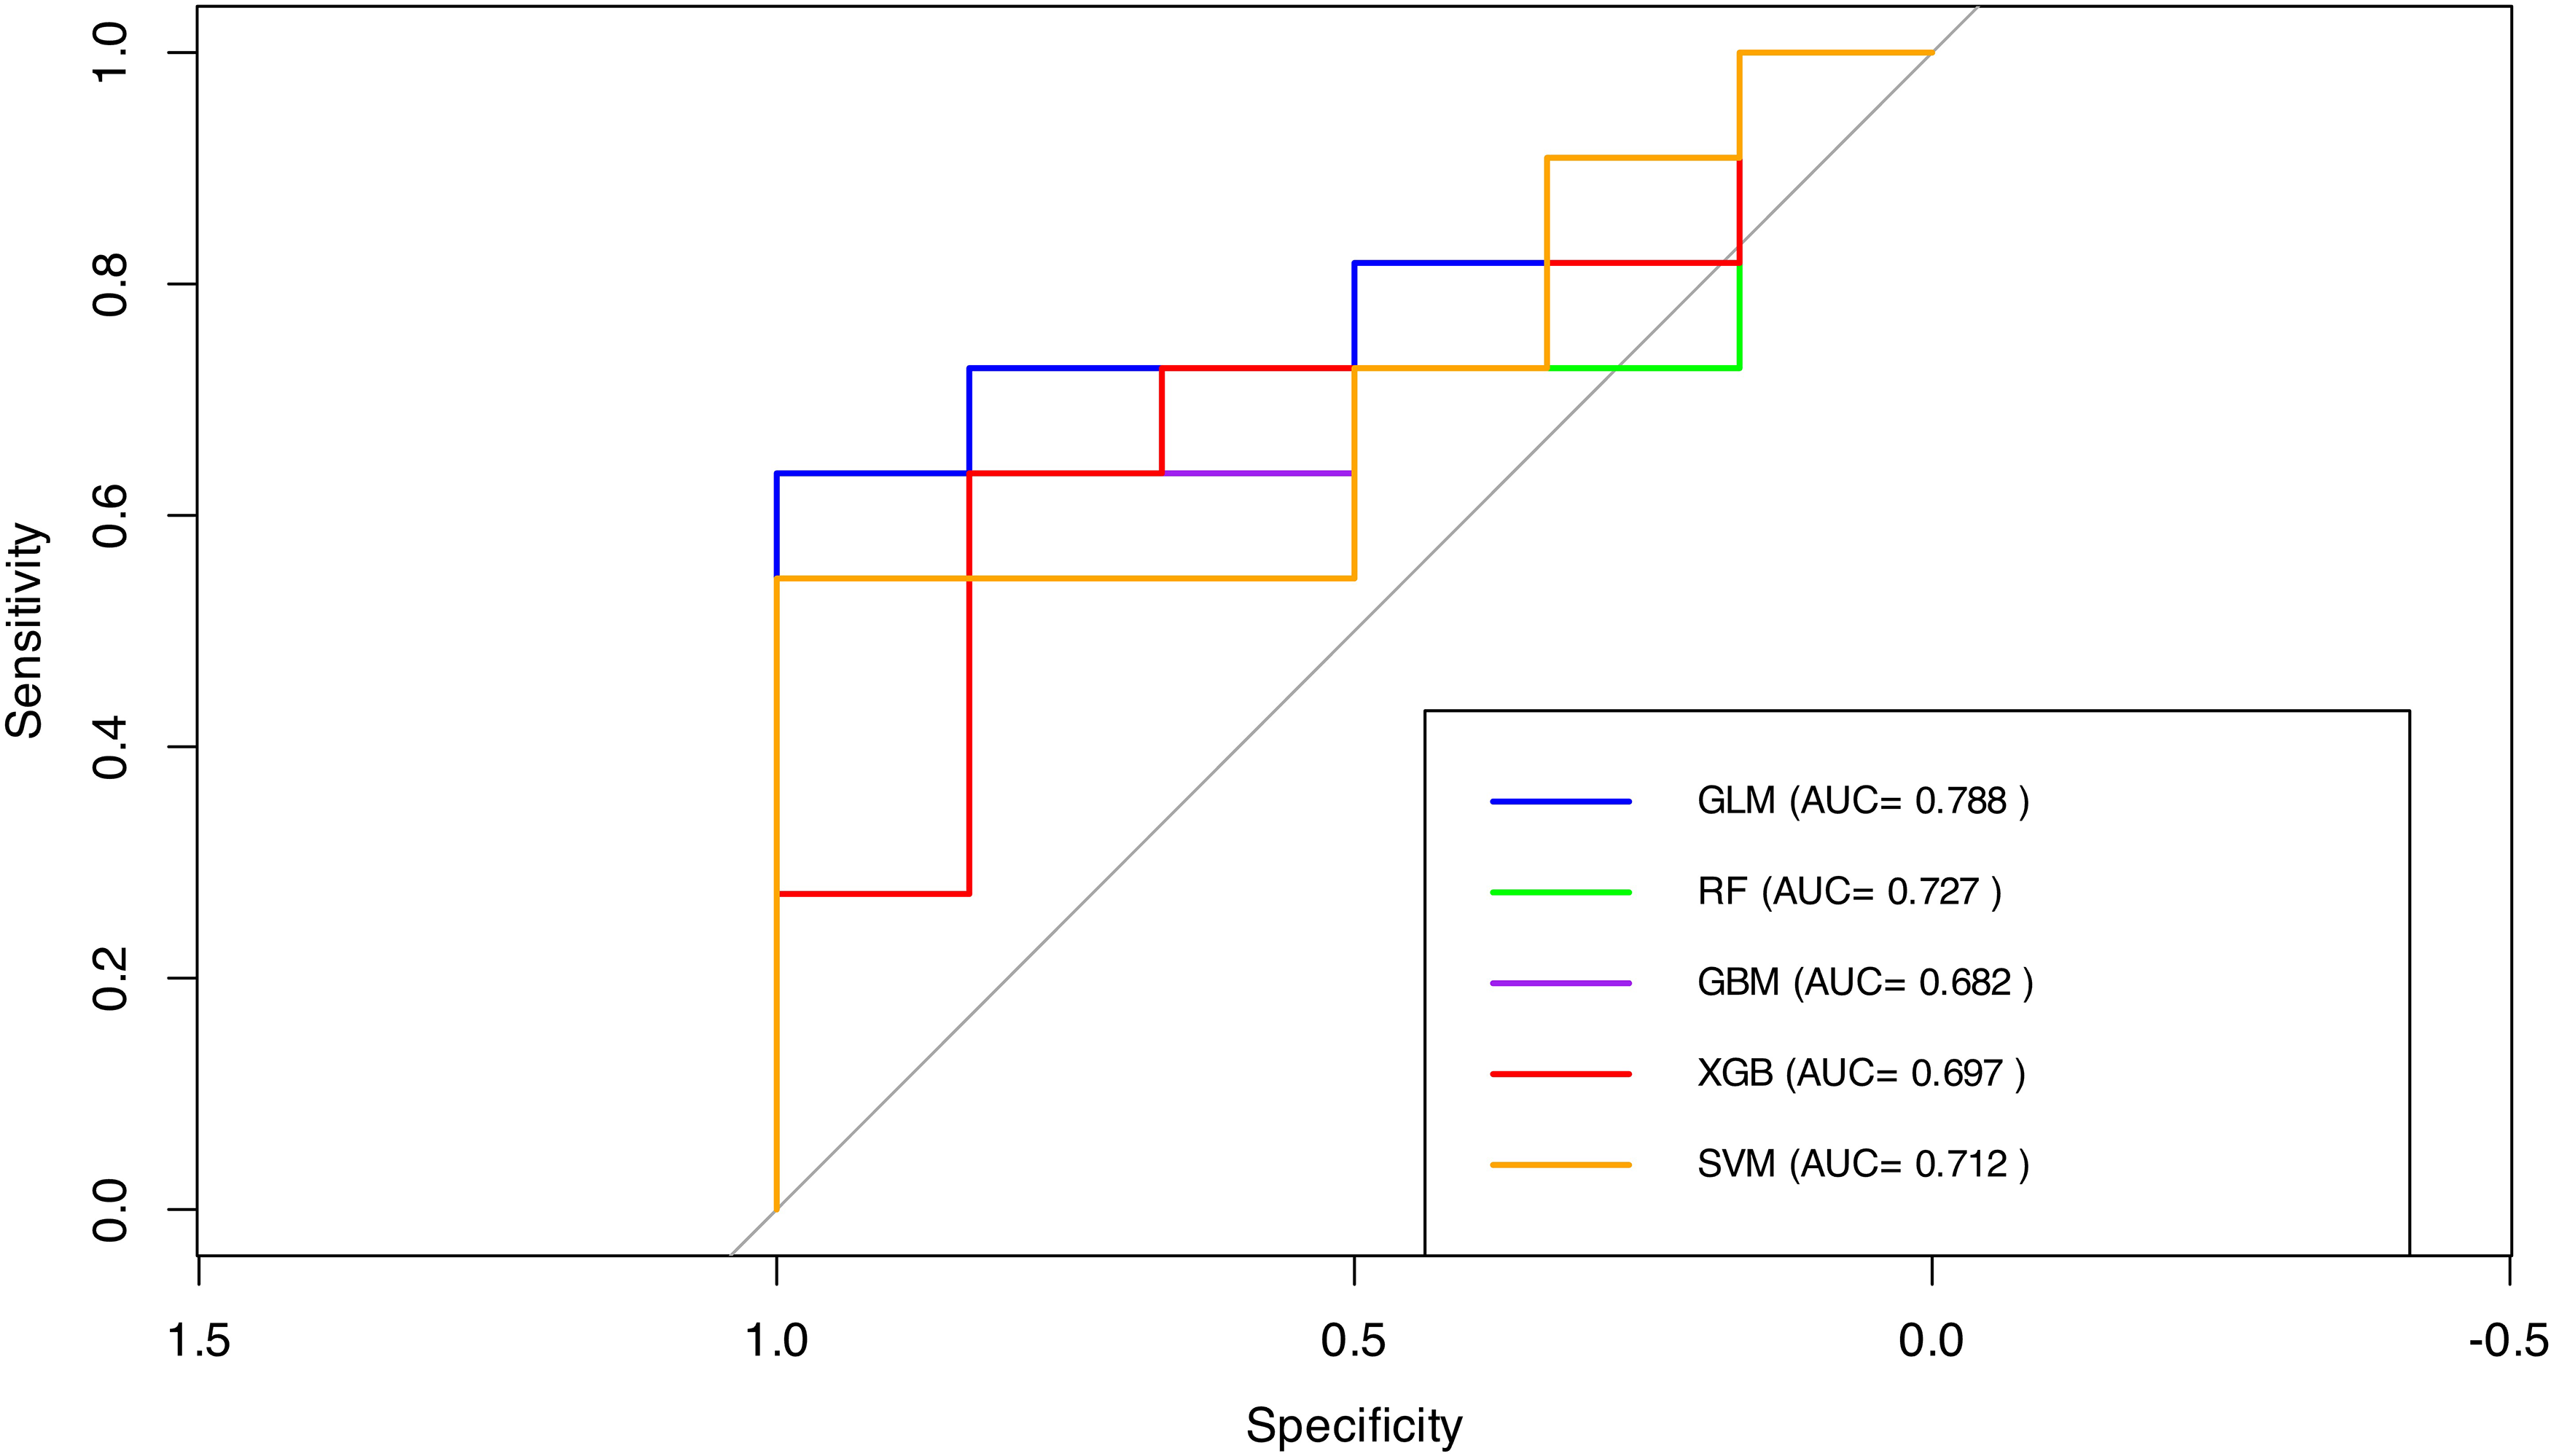
Comparative ROC curves.
Calibration assessment was performed for all models using calibration plots and Brier scores (Figure 5). All models showed reasonably good calibration, with Brier scores ranging from 0.21 (logistic regression) to 0.25 (XGBoost), indicating similar average agreement between predicted probabilities and observed outcomes. Calibration curves further demonstrated that none of the models systematically overestimated or underestimated the risk of CVS across the spectrum of predicted probabilities, despite differences in classification metrics such as sensitivity and specificity. This consistency suggests that the discriminative and probabilistic performances of the ML models were generally consistent with those of logistic regression in this dataset.

Calibration curves for all predictive models (logistic regression, random forest, GBM, SVM, and XGBoost). The dashed diagonal line represents perfect calibration. Brier scores for each model are displayed in the figure.
Cross-validated performance and comparative model metrics
To improve model reliability and address the class imbalance in the dataset, all predictive models (logistic regression, random forest, GBM, XGBoost, and SVM) were retrained using SMOTE-augmented data and evaluated through repeated 5-fold cross-validation (3 repetitions). The final models were then tested on an independent hold-out set (20% of the sample).
Table 1 summarizes the performance metrics of each model, including accuracy, sensitivity, specificity, and AUC. Logistic regression and XGBoost achieved the highest accuracy (0.706) and strong AUC values (0.773 and 0.758, respectively), while GBM showed the weakest overall performance (AUC = 0.682). Most models exhibited high sensitivity, but specificity varied considerably, particularly for the random forest model (16.7%). These results highlight the inherent trade-offs between sensitivity and specificity depending on the predictive approach selected.
Performance metrics for each predictive model, including accuracy, sensitivity, specificity, and AUC.

Confusion matrices and classification patterns
To complement the performance metrics previously reported, the confusion matrices for each predictive model are presented below. These matrices detail the number of true positives, false positives, true negatives, and false negatives obtained on the test set (n = 17), offering additional insight into how each model performed in classifying symptomatic and asymptomatic individuals.
Logistic regression correctly identified 12 out of 13 symptomatic individuals but misclassified all asymptomatic participants, resulting in very high sensitivity but no specificity. The random forest and XGBoost models also demonstrated strong sensitivity with 11 true positives each, although their specificity remained limited, correctly classifying only one non-symptomatic case. In contrast, the GBM and SVM models provided a more balanced classification pattern, each achieving 10 true positives and two true negatives.
The confusion matrix results for each model were as follows. The logistic regression model identified 12 true positives, 4 false positives, 0 true negatives, and 1 false negative. The random forest model yielded 11 true positives, 3 false positives, 1 true negative, and 2 false negatives. The GBM model produced 10 true positives, 2 false positives, 2 true negatives, and 3 false negatives. The XGBoost model also resulted in 11 true positives, 3 false positives, 1 true negative, and 2 false negatives. Lastly, the SVM model showed 10 true positives, 2 false positives, 2 true negatives, and 3 false negatives.
Figure 6 displays the normalized confusion matrices for all predictive models.

Normalized confusion matrices for all predictive models (logistic regression, random forest, GBM, XGBoost, and SVM). Each heatmap represents the proportion of predictions relative to the actual class, with rows corresponding to true labels and columns to predicted labels. Darker cells indicate higher classification proportions within each row.
Discussion
This study highlights the value of predictive modeling for CVS by integrating accessible demographic, clinical, and behavioral variables in a real-world occupational sample. The findings align with, and also extend, existing literature on CVS prevalence and risk assessment. A key strength of this work lies in the application and comparison of multiple ML algorithms and logistic regression with calibration analysis and cross-validation, offering a robust foundation for the development of technology-driven screening tools.
Consistent with prior research,34,35 our findings revealed a significantly higher prevalence of CVS among women. This trend may stem from shared behavioral patterns, such as longer screen exposure or less frequent breaks, as well as physiological factors like hormonal fluctuations that influence tear film stability. 36 However, in contrast to Jalali et al., 37 who reported that sex did not remain a significant factor after controlling for confounders, our model identified female sex as the only statistically significant predictor of CVS. This discrepancy may reflect contextual factors unique to our occupational sample, such as job roles, screen ergonomics, or health-seeking behavior, which could amplify gender-based vulnerability.
Screen exposure time emerged as another relevant, though not statistically significant, predictor in our models. On average, participants with CVS reported approximately one additional hour of daily screen time compared to those without symptoms. This trend aligns with the findings of Kahal et al. 38 and Jalali et al., 37 both of whom identified excessive screen use as a key risk factor for CVS. Similarly, Fernández-Villacorta et al. 13 and Behrens et al. 39 reported significant associations when daily screen use exceeded 7 h, particularly in remote work settings. In our sample, although screen time was longer among symptomatic individuals, the average duration remained below the high-risk threshold reported in those studies. This may partly explain the lack of statistical significance in the logistic regression analysis. However, in the random forest model screen exposure time was ranked among the most influential predictors. This suggests that ML approaches may capture complex, non-linear interactions or synergistic effects between screen time and other factors, such as ergonomics, sex, or job demands that are not readily detected by traditional statistical methods. These findings underscore the added value of ML in uncovering subtle but meaningful patterns in behavioral health data.
Unlike some previous studies, refractive errors (myopia, hyperopia, astigmatism) did not significantly contribute to the predictive performance of our models. Although hyperopia was slightly more frequent among participants with CVS, this difference was not statistically significant, nor did refractive errors rank highly in variable importance within the ML models. This contrasts with the findings of AlGhamdi et al. 40 and Coronel-Ocampos et al., 41 who reported associations between CVS and the use of glasses, particularly in individuals with uncorrected or inadequately corrected vision. This may be explained by adequate optical correction in our sample or by the greater relevance of behavioral and demographic factors for CVS risk in this population. Notably, our comparative evaluation of model performance also revealed that age, while not significant in logistic regression, was identified as a more important predictor in several ML approaches. This aligns with Moore et al. 36 and Fernández-Villacorta et al., 13 who found higher CVS prevalence in older age groups, while Sengo et al. 34 reported higher risk among younger individuals. These differences suggest that nonlinear relationships or interactions between predictors and outcomes may exist, which are better captured by advanced modeling techniques. Future research should explore additional clinical or biometric variables, such as those suggested by Jha et al., 42 to further refine CVS risk prediction.
This study presents several strengths, including the use of accessible sociodemographic, behavioral, and clinical variables, which enhances the scalability and applicability of our models in occupational health. By comparing multiple predictive modeling techniques, logistic regression and four ML algorithms (random forest, GBM, XGBoost, and SVM), we provide a broad evaluation of model performance for CVS risk prediction. The use of repeated cross-validation and SMOTE balancing addressed limitations related to sample size and class imbalance, improving internal validity. Calibration was assessed using Brier scores and calibration curves, offering insight into the reliability of probabilistic predictions.
However, certain limitations should be acknowledged. The small sample size and use of convenience sampling may affect the generalizability of our findings. Relevant predictors such as screen ergonomics or environmental factors were not included, and CVS classification relied on self-reported symptoms, introducing potential response bias. In addition, our models have not yet been externally validated in independent occupational cohorts, which is essential to confirm their utility in other settings.
Future research should focus on validating these predictive models in larger and more diverse populations and consider incorporating additional biometric and environmental variables to improve predictive accuracy. Longitudinal studies are recommended to establish causal relationships and assess model performance over time. Ultimately, integration of such predictive tools into digital health platforms or workplace wellness programs could support real-time risk assessment and early detection of CVS, contributing to more effective prevention in increasingly digital work environments.
Conclusions
This exploratory study provides initial evidence that predictive modeling, using accessible sociodemographic, behavioral, and clinical variables, may help identify individuals at risk of CVS in occupational settings. In our sample, demographic and behavioral factors, particularly sex, age, and daily screen time, consistently emerged as stronger predictors of CVS risk than clinical variables such as refractive errors. These findings align with previous research suggesting the multifactorial nature of CVS, but our results must be interpreted with caution.
Several limitations should be acknowledged, including the modest sample size, the lack of external validation, and the potential for selection bias inherent in convenience sampling. As such, the predictive performance and generalizability of the developed models remain to be confirmed. Our study is intended as a proof of concept and highlights both the opportunities and the current methodological challenges in applying ML approaches to occupational health data.
Future research should focus on validating these preliminary findings in larger, more representative, and independent cohorts. Incorporating additional variables, such as detailed ergonomic, environmental, or biometric data, may further enhance model performance. Ultimately, rigorous external validation is necessary before predictive modeling approaches can be recommended as scalable decision-support tools for occupational health professionals, employers, or policymakers in the context of CVS risk management.
Footnotes
Ethics approval and consent to participate
The study was conducted in accordance with the ethical standards set forth in the Declaration of Helsinki and was approved by the Ethics Committee of the Higher Institute of Education and Sciences of Lisbon (ISEC Lisbon) on 10 October 2024 (approval ID: CE/2024/10/10). All participants received detailed information about the study and provided written informed consent prior to their inclusion.
Author contributions
Ana Paula Oliveira: conceptualization, methodology, software, validation, formal analysis, investigation, resources, data curation, writing—original draft, writing—review & editing, visualization, supervision, project administration. Clara Martinez-Perez: conceptualization, methodology, software, validation, formal analysis, investigation, resources, data curation, writing—original draft, writing—review & editing, visualization, supervision, project administration. Magda Isabel Sebinha: conceptualization, data curation, investigation, validation, writing—review & editing.
Funding
The authors received no financial support for the research, authorship, and/or publication of this article.
Declaration of conflicting interests
The authors declared no potential conflicts of interest with respect to the research, authorship, and/or publication of this article.
Availability of data and materials
All data generated or analyzed during this study are included in this published article and its supplemental information files.