
Abstract
Background
The electrocardiogram (ECG) may be the most popular test in the management of cardiovascular disease (CVD). Although wide applications of artificial intelligence (AI)-enabled ECG have been developed, an integrating indicator for CVD risk stratification was not investigated. Since mortality may be the most important global outcome, this study aimed to develop a survival deep learning model (DLM) to establish a critical ECG value and explore the associations with various CVD events.
Methods
We trained a DLM with 451,950 12-lead resting ECGs obtained from 210,552 patients, for whom 23,592 events occurred. The internal validation set included 27,808 patients with one ECG for each patient. The external validations were performed in a community hospital with 33,047 patients and two transnational data sets with 233,647 and 1631 ECGs. We distinguished the cause of mortality and additionally investigated CVD-related outcomes, including new-onset acute myocardial infarction (AMI), stroke (STK), and heart failure (HF).
Results
The DLM achieved C-indices of 0.858/0.836 in internal/external validation sets by using ECG over a 10-year period. The high-mortality-risk group identified by the proposed DLM presented a hazard ratio (HR) of 14.16 (95% confidence interval (CI): 11.33–17.70) compared to the low-risk group in the internal validation and presented a higher risk of cardiovascular (CV) mortality (HR: 18.50, 95% CI: 9.82–34.84), non-CV mortality (HR: 13.68, 95% CI: 10.76–17.38), AMI (HR: 4.01, 95% CI: 2.24–7.17), STK (HR: 2.15, 95% CI: 1.70–2.72), and HF (HR: 6.66, 95% CI: 4.54–9.77), which was consistent in an independent community hospital. The transnational validation also revealed HRs of 4.91 (95% CI: 2.63–9.16) and 2.29 (95% CI: 2.15–2.44) for all-cause mortality in the SaMi-Trop and Clinical Outcomes in Digital Electrocardiography 15% (CODE15) cohorts.
Conclusions
The mortality risk by AI-enabled ECG may be applied in passive electronic-health-record-based CVD risk screening, which may identify more asymptomatic and unaware high-risk patients.
Keywords
Introduction
Cardiovascular disease (CVD) may be the most important public health issue and is the leading cause of death worldwide. 1 If a patient has the presence of CVD, CVD-related deaths may be prevented by extensive health management through effective diet plans, lifestyle interventions, and drug interventions. 2 A great deal of research on CVD risk estimation has been performed over the past decade, including the Framingham risk scores,3,4 the QRISK score, 5 the Europe Systematic Coronary Risk Evaluation (SCORE), 6 the Assessing Cardiovascular Risk using Scottish Intercollegiate Guidelines Network (ASSIGN) score, 7 the Prospective Cardiovascular Master (PROCAM) equations, 8 and the CUORE cohort study formula. 9 These CVD risk prediction models screened patients with CVD and high-risk groups to facilitate CVD control.10,11
Currently, background disease screening and alarm systems have become popular using electronic health records (EHRs).12,13 While active decision support interventions can be embedded into EHRs, passive notification can also be embedded without the actions of clinicians. These concepts can be used to actively prompt clinicians to notice asymptomatic CVD cases. 10 Nevertheless, there are still numerous challenges associated with developing CVD risk estimation models. The blood sample is currently the major component driving these risk stratification calculators, 14 often missing because of their intrusiveness. These risk scores were available only for less than 30% of the patients in an EHR-based cardiovascular (CV) screening. 15 An accurate passive CVD risk stratification system using less information is an unmet need in clinical practice.
With deep learning model (DLM)-enhanced medical interpretations, previous studies have found plentiful patient information from chest X-ray, 16 fundoscopy, 17 and electrocardiogram (ECG) 18 beyond expert knowledge. Since ECG may be the most popular examination in clinical practice, the DLM-enabled ECG system may provide an opportunity to stratify high-risk groups of CVD with a single examination. A number of applications of artificial intelligence (AI) have been developed to detect cardiac diseases using large annotated ECG data sets.19,20 However, an initial risk stratification tool in primary care may need an integrating indicator for CVD risk stratification. Currently, ECG age might be the best indicator since it is associated with extensive CVD outcomes.21,22
Mortality may be the most important global outcome in CVD-related prognosis. DLM could automatically predict 1-year mortality directly using 12-lead ECG voltage-time data in a previous study. 23 Therefore, we hypothesized that the mortality risk estimated by DLM-enabled ECG may be a better integrating indicator than ECG age. In this study, we explored the associations between wide CVD-related prognosis and ECG mortality risk to establish an accurate passive CVD risk stratification system. Moreover, although a previous study investigated the 25-year outcomes of models trained with 1 year of deaths, 23 the more standard method may be to directly use survival analysis for long-term effects. This study also provided a survival DLM to address this issue and compared the performance with the risk score estimated by a 1-year mortality model.
Method
Data source and population
The institutional ethics committee of the Tri-Service General Hospital (C202105049) reviewed and approved this study, and we retrospectively developed and evaluated a DLM internally and externally. Since we retrospectively used de-identified data collected and encrypted from the hospital to the data controller, an informed consent waiver was granted for this study. The ECGs were collected from two hospitals, an academic medical center in Neihu District (Hospital A) and a community hospital in Zhongzheng District (Hospital B), from 1 January 2010 to 30 April 2021. Patients aged less than 20 years old were excluded.
Figure 1 shows the assignment of samples in this study. There were 291,778 patients with at least one ECG in Hospital A. The 210,552 patients admitted to Hospital A after 1 January 2017 were used in the development set, which included 451,950 ECG records for DLM training. A total of 20,371 patients were assigned to the tuning set between 1 January 2016 and 31 December 2016. These patients provided 89,302 ECGs for guiding the training process and determining the optimal operating point for subsequent usage. Finally, 27,808 patients before 31 December 2015 were assigned to an internal validation set, which contained only the first ECGs that were used for the accuracy test and follow-up analysis. We also collected 33,047 patients in Hospital B using the same inclusion criteria as the internal validation set to verify the extrapolation of the DLM. We also used two data sets, the Clinical Outcomes in Digital Electrocardiography 15% (CODE15) cohort (with 233,647 participants) and the SaMi-Trop cohorts (with 1631 participants), to perform international validation. SaMi-Trop is a National Institutes of Health-funded prospective cohort with chronic Chagas cardiomyopathy to evaluate whether a clinical prediction rule based on ECG and other biomarkers can be useful in clinical practice.24,25 The CODE15 is a subset of the CODE cohort, 26 which was developed with the database of digital ECG exams of the TeleHealth Network of Minas Gerais (TNMG), Brazil, linked to the public databases of the Mortality and Hospitalization Information Systems.27,28 These data sets provided ECG age as the baseline marker compared to our mortality risk assessment model. Moreover, the ECGs in these transnational cohorts were divided into normal and abnormal according to the American Heart Association, American College of Cardiology Foundation, and Heart Rhythm Society. 29

Development, tuning, internal validation, and external validation set generation and ECG labeling of survival information in a private data set. Schematic of the data set creation and analysis strategy, which was devised to ensure a robust and reliable data set for training, validating, and testing of the network. Once a patient's data were placed in one of the data sets, that individual's data were used only in that set, avoiding “cross-contamination” among the training, validation, and test data sets. The details of the flow chart and how each of the data sets was used are described in the methods.
Data collection
The 12-lead ECG was recorded with a 500-Hz frequency and 10 s, and we directly used raw ECG traces to train DLMs. Patterns included abnormal T wave, atrial fibrillation, atrial flutter, atrial premature complex, complete AV block, complete left bundle branch block, complete right bundle branch block, first degree AV block, incomplete left bundle branch block, incomplete right bundle branch block, ischemia/infarction, junctional rhythm, left anterior fascicular block, left atrial enlargement, left axis deviation, left posterior fascicular block, left ventricular hypertrophy, low QRS voltage, pacemaker rhythm, prolonged QT interval, right atrial enlargement, right ventricular hypertrophy, second degree AV block, sinus bradycardia, sinus pause, sinus rhythm, sinus tachycardia, supraventricular tachycardia, ventricular premature complex, ventricular tachycardia, and Wolff–Parkinson–White syndrome. There are 31 diagnostic pattern classes and 8 continuous ECG measurements extracted from the quantitative measurements and abnormal findings of the ECG based on the standard phrases in the Philips system described previously (Table S1). 30 Data missing from ECG measurements were imputed using multiple imputation methods. 31 The disease histories were based on the corresponding International Classification of Diseases, Ninth Revision and Tenth Revision (ICD-9 and ICD-10, respectively) described previously. 32 The primary outcome of this study was all-cause mortality calculated based on the index date of the ECG. Electronic medical records defined the status (dead/alive) of the patient. These records were updated by hospital staff as needed. Moreover, data for alive visits were censored at the patient's last known hospital alive encounter to limit bias from incomplete records. We also performed a secondary analysis on extensive CVDs, such as CV mortality, non-CV mortality, new-onset acute myocardial infarction (AMI), new-onset stroke (STK), and new-onset heart failure (HF). We defined a new-onset event as a record of the corresponding ICD codes, such as AMI, STK, or HF. Patients meeting any of the above criteria before the index date of the ECG were excluded and defined as having a corresponding disease history.
Implementation of the DLM
The major architecture of the proposed survival DLM is summarized in Figure 2. During recording, each ECG was captured in the standard 12-lead format, resulting in a sequence of 5000 numbers. A 5000 × 12 matrix was then created from these sequences. For the input format of this architecture, a 4096 × 12 matrix was used. During the training process, a length of 4096 sequences was randomly selected and cropped as input. We developed a DLM to conduct survival analysis based on the Cox proportional hazard model. As the baseline benchmark of mortality prediction by ECG, we also trained a DLM via 1-year mortality information using only 153,207 patients with 252,355 ECGs since the surviving patients missing follow-up within 1 year were excluded. In this DLM with binary output, the cases are the patients who died within 1 year, and the controls are the patients who lived more than 1 year.

The model architecture of the deep survival neural network for ECG analysis. The deep neural network was constructed by a series of residual modules and pool modules, which provided a lead-specific feature map to obtain an integrated prediction via an attention module. The number in the right site is the tensor shape of the output.
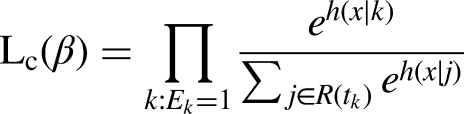
The output of the proposed survival DLM was a continuous value of


We trained these DLMs with a batch size of 32 and used an initial learning rate of 0.001 using an Adam optimizer with standard parameters (β1 = 0.9 and β2 = 0.999). The learning rate was decayed by a factor of 10 each time the loss of the validation cohort plateaued after an epoch. To prevent the networks from overfitting, early stopping was performed by saving the network after every epoch and choosing the saved DLMs with the lowest loss on the validation cohort. The only regularization method for avoiding overfitting was L2 regularization with a coefficient of 10−4 in this study.
Statistical analysis
We presented the characteristics of the different sets as the means and standard deviations, numbers of patients, or percentages. The performance of the two DLMs was compared by the receiver operating characteristic (ROC) curve for 1-year mortality analysis, and the area under the curve (AUC) was also presented. To evaluate the additional predictive contribution from ECG risk, we used the concordance index, also called the C-index, to present the global performance. We additionally added sex and age to enhance the DLM performance by multivariable Cox proportional hazard models, and the adjusted hazard ratio (HR) and 95% confidence interval (95% CI) were presented. The statistical analysis was carried out using the software environment R version 3.4.4. We used a significance level of p < 0.05 throughout the analysis.
Results
Table 1 shows the distribution of baseline demographic characteristics, disease histories, and follow-up information in the development set, tuning set, internal validation set, and external validation set. The demographic characteristics and follow-up information in the SaMi-Trop and CODE15 cohorts are also presented.
Baseline characteristics.

ED: emergency department; IPD: inpatient department; OPD: outpatient department; BMI: body mass index; DM: diabetes mellitus; HTN: hypertension; HLP: hyperlipidemia; CKD: chronic kidney disease; AMI: acute myocardial infarction; STK: stroke; CAD: coronary artery disease; HF: heart failure; COPD: chronic obstructive pulmonary disease; IQR: interquartile range.
The comparison between our survival DLM and the previous binary DLM on 1-year mortality risk is shown in Figure 3(a). The AUC of ECG risk predicted by survival DLM was 0.894 (95% CI: 0.879–0.909), which was significantly (p = 0.005) higher than the AUC of 0.876 (95% CI: 0.858–0.893) predicted by binary DLM in the internal validation set. A similar result was shown in the external validation. Figure 3(b) shows the long-term mortality predictive performance in different input settings. In both the internal and external validation sets, our survival DLM outperformed the binary DLM with C-indices of 0.858 and 0.836, respectively. Moreover, the survival DLM demonstrated improved performance with demographic characteristics, as evidenced by significantly higher C-indices of 0.874 and 0.856, compared to the C-indices obtained using only sex and age in both validation sets. With the operating points of Figure 3(c), patients were divided into low-risk, low-moderate, high-moderate, and high-risk groups, and the proportion of each group in the internal and external validation sets is shown in Figure 3(d) for subsequent analysis. The inconsistent proportion between the tuning set and validation sets was due to the greater number of ECGs in high-risk patients, and we used only one ECG for each patient in the validation sets. Moreover, in Figure 3(e), it can be observed that the subjects who died within 3 days, 1 month, 6 months, and 1 year were classified into the same death group in this analysis. Therefore, long-term time-to-event data indicate that the ECG-risk model outperforms ECG risk (1 year). Figure 3(f) summarizes the C-index in patients with or without disease histories, and the ECG-risk score performed better in patients without diabetes mellitus (DM), chronic kidney disease (CKD), and HF.
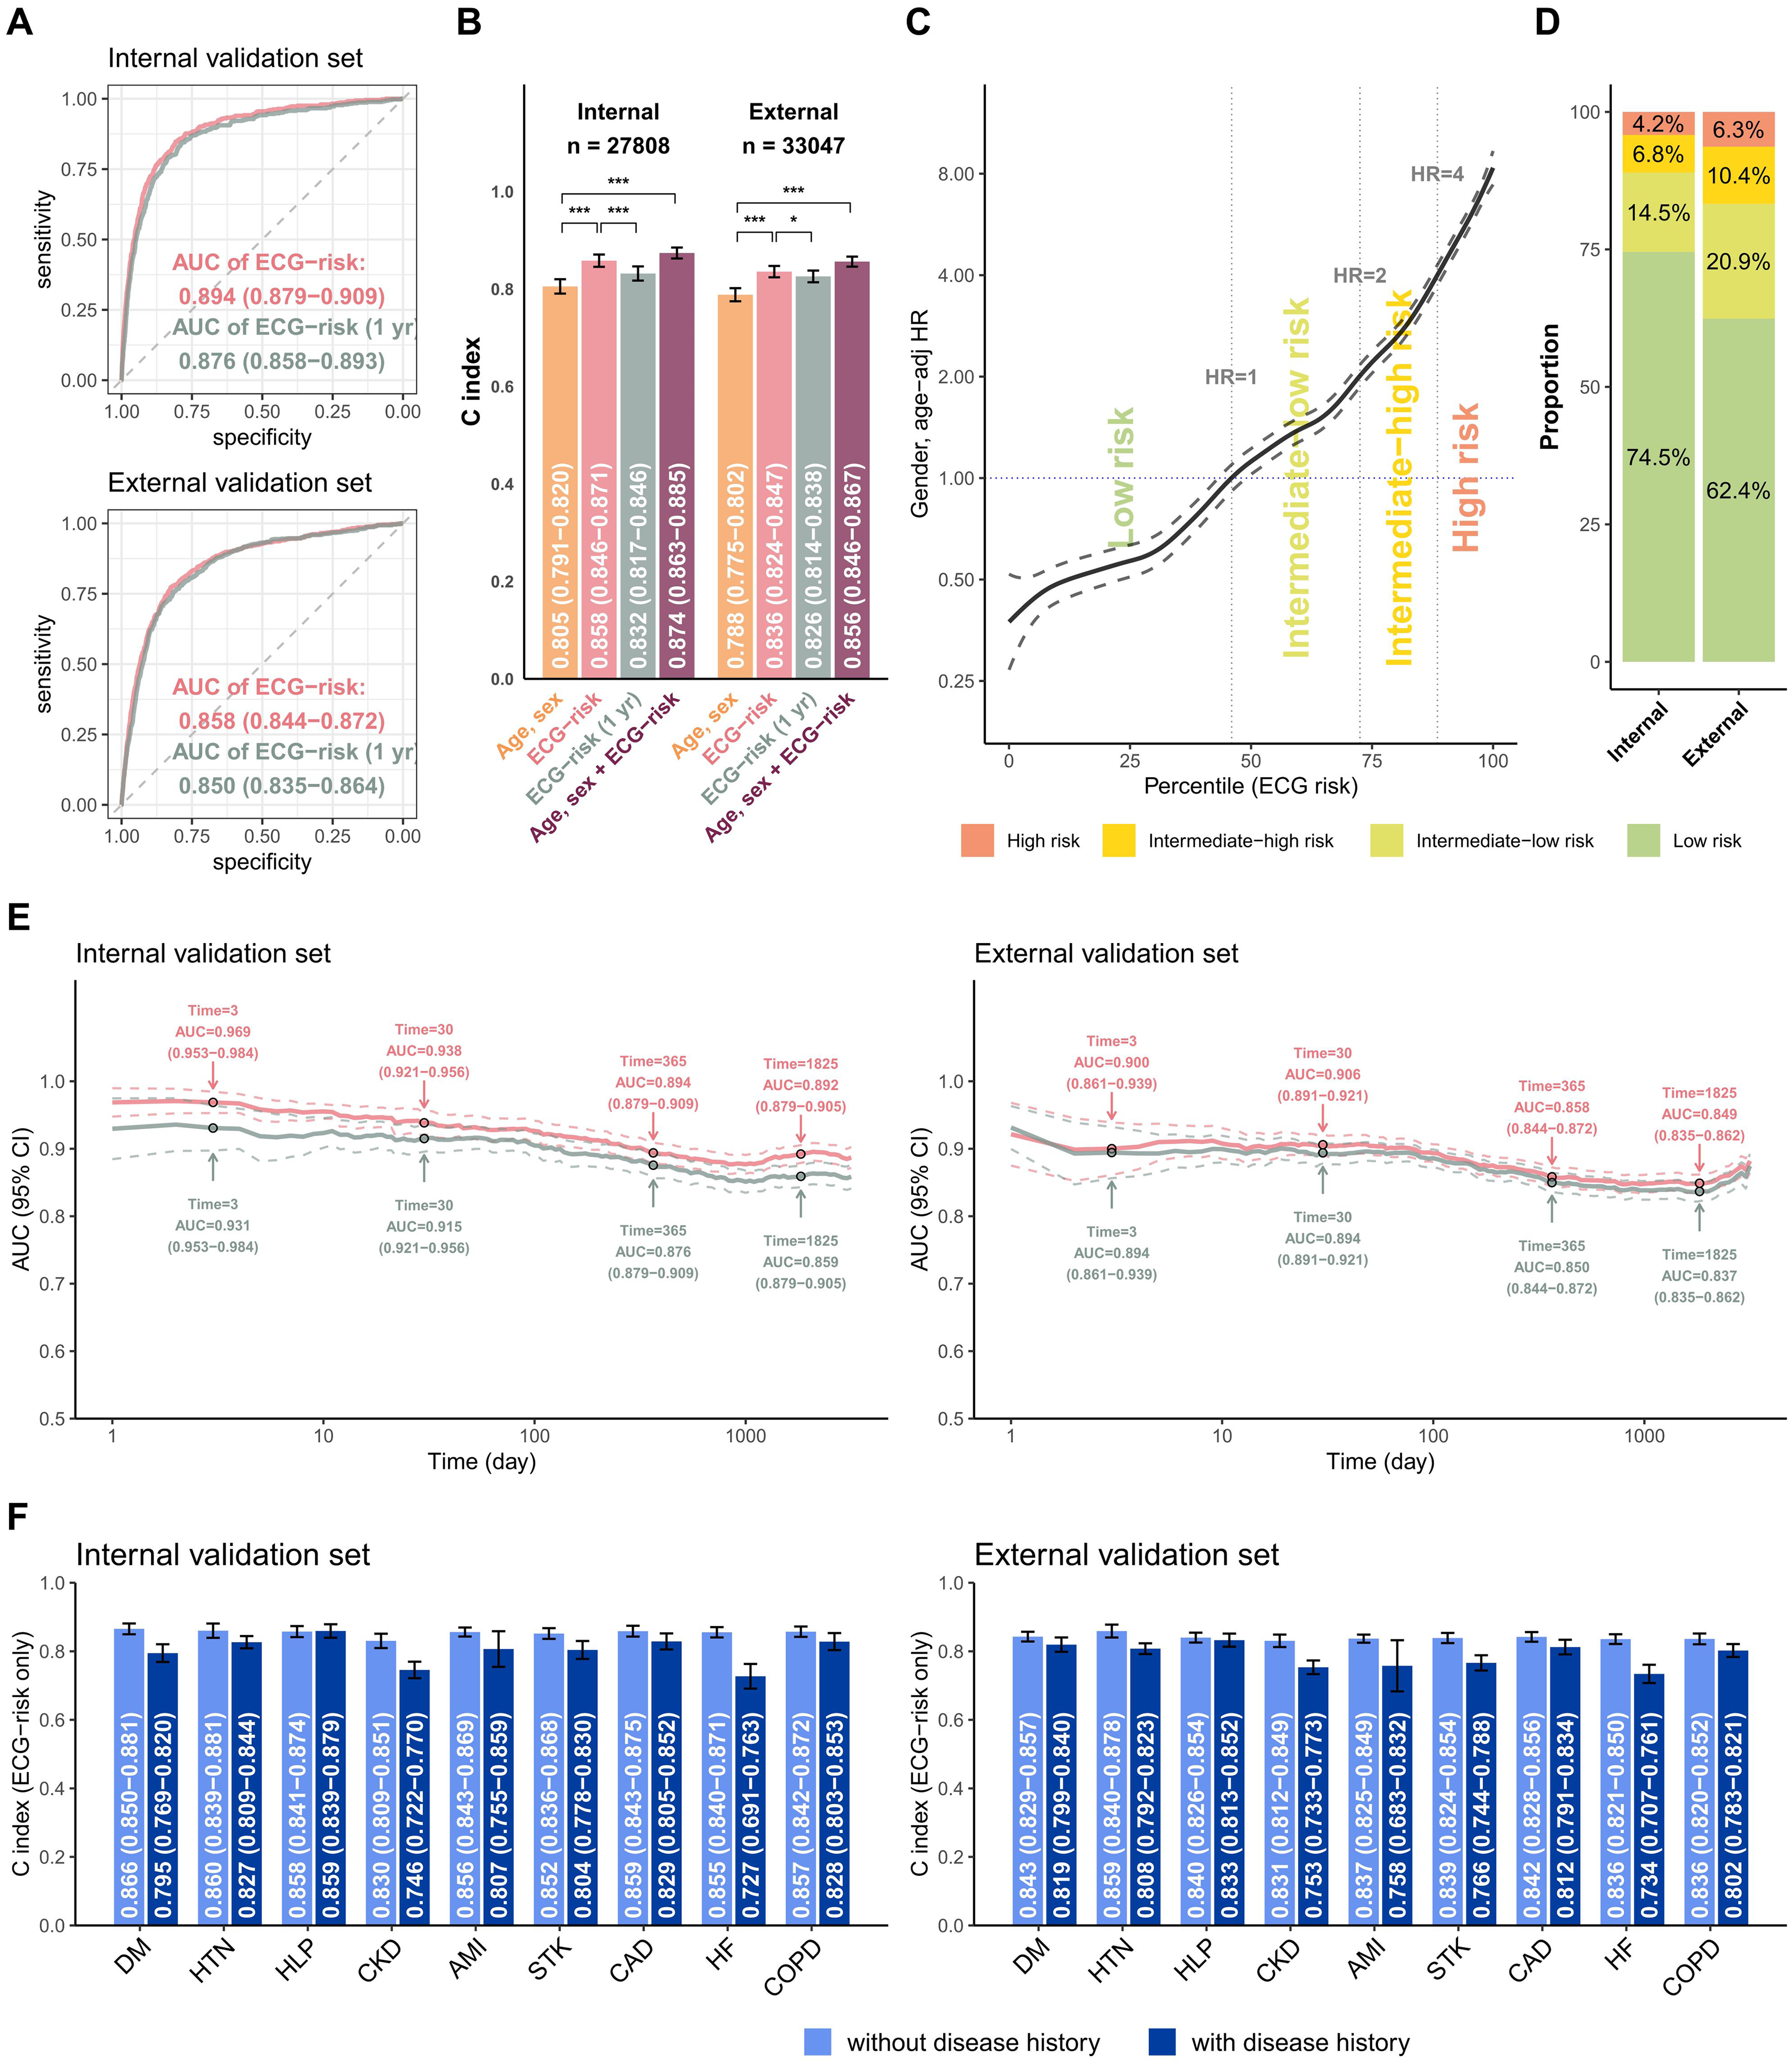
Summary of model performance for predicting all-cause mortality and the risk stratifications in the internal and external validation sets. (a) ROC curves of the risk prediction based on a deep survival neural network trained by long-term mortality risk (ECG risk) and a deep neural network trained by 1-year mortality risk (ECG risk (1 year)). The cases are the patients who died within 1 year, and the controls are the patients who lived more than 1 year. (b) The C-index for the indicated input data, including (i) age and sex alone, (ii) ECG-risk score based on ECG voltage-time traces alone, (iii) ECG-risk (1 year) score based on ECG voltage-time traces alone, and (iv) ECG-risk score with age and sex. (c) The ECG-risk score is transformed to the percentile scale in risk curve analysis, and we selected an HR of 1 as the operating point to distinguish the low-risk group and intermediate-low-risk group in the tuning set, followed by HRs of 2 and 4 to further stratify the intermediate-high-risk group and high-risk group. (d) According to the operating points decided previously, the patients in the internal and external validation sets were classified into low-risk, intermediate-low-risk, intermediate-high-risk, and high-risk groups for subsequent analyses. (e) Comparing the difference in the AUC between ECG risk and ECG risk (1 year) with varying lengths of follow-up time. (f) Stratified analysis for the C-index of ECG risk on long-term all-cause mortality. *p < 0.05; **p < 0.01; ***p < 0.001.
Figure 4 compares the mortality of patients in the low-risk, low-moderate, high-moderate, and high-risk groups. The incidences of all-cause mortality were 28.0% at 3 years and 38.9% at 9 years in the high-risk group in the internal validation set, which were significantly higher than the incidences of all-cause mortality in the low-risk group (1.1% and 2.7%) with an adjusted HR of 14.16 (95% CI: 11.33–17.70). The obvious dose–effect relationship was also presented from the HRs of the intermediate-low-risk (3.15, 95% CI: 2.55–3.89) and intermediate-high-risk groups (6.81, 95% CI: 5.49–8.45) to the HR of the high-risk group. Additionally, we conducted a mortality risk analysis on ECGs from different departments in various risk stratifications. Supplemental Figure S1 depicts a comparable trend for patients who visited different departments. This trend was also presented in the external validation set. Interestingly, this risk difference was not only present in CV mortality but also presented in non-CV mortality. The high-risk group presented HRs of 13.68/9.97 compared to the low-risk group on non-CV mortality in internal/external validations, which revealed the non-CV-related information extracted by ECG by our survival DLM. Figure 5 shows a similar trend for new-onset AMI, new-onset STK, and new-onset HF. The HRs of the intermediate-low-risk group, intermediate-high-risk group, and high-risk group were 1.93 (95% CI: 1.26–2.96), 2.37 (95% CI: 1.57–3.58), and 6.66 (95% CI: 4.54–9.77), respectively, for new-onset HF in internal validation, especially in the risk increase of the first 3 years from 0.4% to 1.2%/1.7%/7.6%. A higher risk of new-onset AMI was also identified in the high-risk group (1.8% at 3 years) than in the low-risk group (0.8% at 3 years), which led to an HR of 4.01 (95% CI: 2.24–7.17) in the internal validation. The risk stratification was also presented on new-onset STK. Similar analyses in the external validation set showed consistent results, which revealed the application value of the ECG-risk score on extensive clinical outcomes.

Kaplan–Meier curves for each risk stratification on all-cause mortality, cardiovascular (CV) mortality, and non-CV mortality. The analyses are conducted both in internal and external validation sets. The table shows the at-risk population and cumulative risk for the given time intervals in each risk stratification.

Kaplan–Meier curves for each risk stratification on new-onset AMI, STK, and HF. The analyses are conducted both in internal and external validation sets. Patients with a history of the corresponding disease were excluded from the analyses. The table shows the at-risk population and cumulative risk for the given time intervals in each risk stratification.
Figure 6(a) shows the distributions of ECG morphology in each risk group. The high-risk group identified by the proposed survival DLM presented less sinus rhythm, more atrial fibrillation, more ventricular premature complex, higher heart rate, longer QT interval, and abnormal T wave axis than the intermediate-high group, followed by the intermediate-low group and low-risk group. The above abnormal morphologies were associated with all-cause mortality, CV mortality, non-CV mortality, new-onset AMI, new-onset STK, and new-onset HF in the internal and external validation sets (Figure 6(b)). These results revealed some of the reasons why our survival ECG-risk score was associated with extensive outcomes.

ECG morphology analysis of risk stratifications on adverse outcomes. (a) Distribution of ECG morphology in each risk stratification. Bars represent the mean or prevalence where appropriate and corresponding 95% confidence intervals (*p < 0.05; **p < 0.01; ***p < 0.001). (b) Risk analysis of selected ECG morphologies on adverse outcomes. Red, gray, and blue bars denote significantly positive, nonsignificant, and negative associations, respectively, with the corresponding outcomes.
Figure 7 shows the performance of our ECG risk estimated by survival DLM in two transnational cohorts, CODE15 and SaMi-Trop, and compared to the previous indicator of mortality, ECG age. During median follow-up years of 3.5 (interquartile range (IQR): 2.1–5.2) and 2.1 (IQR: 2.0–2.2), the initial at-risk patients in CODE15 and SaMi-Trop were 233,647 and 1631, respectively. Figure 7(a) shows the comparison between ECG age and ECG risk. There was no significant difference in the C-index between ECG age and ECG risk in SaMi-Trop, and ECG age performed significantly better in CODE15. However, ECG risk with age and sex provided the highest C-index in both transnational cohorts, which was significantly better than the integration of sex, age, and ECG age. We used the same cut-points as our data sets to divide transnational patients into low-risk, low-moderate, high-moderate, and high-risk groups, and the proportion of each group in the internal and external validation sets is shown in Figure 7(b). The proportion of the higher-risk group in abnormal ECGs was higher than the proportion in normal ECGs, which demonstrated the relationship between ECG risk and physician opinion. However, there were still more than 6% high-risk patients in the normal group and more than 26% low-risk patients in the abnormal group. Figure 7(c) shows the proportion of each risk group at different ages. Due to the different age distributions, the overall proportion of each risk group was different in the four data sets. However, the proportion of the higher-risk group increased consistently by age in the four data sets. Figure 7(d) shows the significant risk stratification performance of our ECG risk in SaMi-Trop and CODE15, which had HRs of 4.91 (95% CI: 2.63–9.16) and 2.29 (95% CI: 2.15–2.44) in the high-risk group compared to the low-risk group for all-cause mortality, respectively.

Summary of model performance in the SaMi-Trop and CODE15 data sets. (a) The C-index for the indicated input data, including: (i) ECG age provided by a previous study, (ii) ECG-risk score based on our survival model, (iii) age and sex alone, (iv) ECG age with age and sex, and (v) ECG-risk score with age and sex. “Normal” refers to the ECGs labeled normal by the original interpreting physician at the time of ECG acquisition, and “abnormal” refers to any ECGs not identified as normal. (b) The proportion of low-risk, intermediate-low-risk, intermediate-high-risk, and high-risk groups in the SaMi-Trop and CODE15 sets. (c) The distribution of age and proportion of risk groups in the internal validation, external validation, SaMi-Trop, and CODE15 data sets. (d) Kaplan–Meier curves for each risk stratification on all-cause mortality in the SaMi-Trop and CODE15 data sets. The table shows the at-risk population and cumulative risk for the given time intervals in each risk stratification.
We further compared the mortality prediction performance between our ECG-risk score and the gap in ECG age and chronological age in SaMi-Trop and CODE15 stratified by normal and abnormal ECGs (Figure 8). After stratification by our ECG-risk score, the mortality rates were 6.5% at 1 year and 18.9% at 3 years in the high-risk group in the abnormal ECGs of SaMi-Trop, which were significantly higher than the mortality rates in the low-risk group (2.0% and 3.1%) with a crude HR of 5.91 (95% CI: 3.06–11.39). However, the gap in ECG age and chronological age had insignificant crude HRs, which demonstrated the limitation of ECG age. Although significant HRs were shown after adjusting sex and age for the gap in ECG age and chronological age, our ECG-risk score still presented better risk stratification performance, which was consistent in all transnational subgroup analyses. Moreover, our ECG-risk score simultaneously performed risk stratification in both normal and abnormal ECGs.

The mortality prediction performance comparison between our ECG-risk score and the gap in ECG age and chronological age in the SaMi-Trop and CODE15 data sets. All analyses were stratified as “normal” and “abnormal” ECGs. “Normal” refers to the ECGs labeled normal by the original interpreting physician at the time of ECG acquisition, and “abnormal” refers to any ECGs not identified as normal. The HRs summarize the Cox regression models adjusted by different selections of variables. The table shows the at-risk population and cumulative risk for the given time intervals in each risk stratification. We did not perform this analysis in the normal ECGs of SaMi-Trop because most patients had ECG abnormalities related to Chagas disease.
Discussion
This study revealed the superiority of the proposed survival DLM compared to the traditional binary analysis on mortality analysis. With the powerful feature extraction ability via DLM, the proposed ECG-risk score trained by mortality was associated with extensive clinical outcomes, which was also associated with traditional ECG morphologies. Compared to the previous integrating indicator, the gap in ECG age, and chronological age, our indicator was easier to explain and provided additional information in addition to demographic characteristics. The proposed ECG-risk score may be extensively applied in primary care based on EHR-based CV screening to manage asymptomatic and unaware high-risk people.
A previous study established a DLM using ECG voltage-time traces alone to predict 1-year mortality with an AUC of 0.855, but this model excluded surviving patients followed up within a year and classified all deaths within different time periods into the same group. 23 To address these limitations, we developed a survival DLM that performs better than the previous binary DLM, even in predicting 1-year mortality. The survival DLM utilizes all ECGs in the study and accounts for the severity of events by considering the time-to-event data. The proposed model may become the standard for predicting long-term time-to-event data as the Cox proportional hazard model outperforms logistic regression in this task. 35 The survival DLM has potential for extensive future event analysis beyond ECG and all-cause mortality, providing better performance.
The ECG waveform consists mainly of P, Q, R, S, and T waves combined into diverse morphologies to describe electrical activity, heart architecture, and heart–lung–torso geometry. 36 A previous study developed a morphology combination score (MCS) based on asymmetric, flattened, and/or notched T waves and a high MCS presented adjusted HRs of 1.75 (95% CI: 1.62–1.89) and 1.61 (95% CI: 1.43–1.92) for mortality in women and men, respectively. 37 The highest quartile of QRS duration was also associated with higher CV mortality than the lowest quartile (HR: 1.3, 95% CI 1.01–1.7). 38 Our DLM integrated whole ECG information, including but not limited to atrial fibrillation, ventricular premature complex, tachycardia, prolonged QT interval, and abnormal T wave axis, to establish mortality risk and performed better due to its powerful feature extraction capability. Although physicians have already used ECG to recognize abnormal signals to decide on further intervention, 39 our DLM can provide further risk stratification in normal/abnormal patients, which is consistent with previous studies. 23 Moreover, since the above abnormal morphologies were widely associated with CVDs, 40 the ECG mortality risk integrating these signals was also associated with future CVDs, which may be used as an integrating indicator for CVD risk stratification.
Stratifying individuals by CVD risk scores can help high-risk groups reduce CVD risk factors and receive preventive medication. 41 Therefore, estimating an individual's CVD risk is crucial for primary prevention, 42 and using a single examination, such as ECG, may be superior to risk factor combinations in passive electronic-health-record-based screening. 15 ECG age has been proposed as an integrating indicator associated with extensive CVD outcomes,21,22 particularly in mortality prediction.21,22,43,44 However, ECG age estimation is limited due to underestimation in elderly individuals and overestimation in young people. In contrast, the proposed ECG mortality risk was easier to interpret and provided better performance in mortality prediction, even after considering age and sex, due to duplicated information between ECG age and chronological age. Additionally, the ECG mortality risk was associated with extensive CVDs in our study and may become the basis for CVD control in future passive screening. The proposed ECG mortality risk score may help asymptomatic and unaware CVD patients in risk stratification.
Many guidelines for primary prevention recommend the estimated risk of CVD as the best guide for intervention decisions.45–49 Currently, British, 50 European, 49 American, 47 and New Zealand 51 use 3- to 9-year interval screening protocols to identify high-risk groups for CVD. However, only a few people actively receive the current screening protocols. ECG is an inexpensive and widely available examination that can become a popular test in routine clinical practice. 52 Passive CVD risk estimation by a single ECG may identify many asymptomatic and unaware CVD patients, 53 and early detection can improve physicians’ clinical insight to reduce the risk of future events. 52 Passive electronic-health-record-based screening may have almost no cost in hospitals and insurance institutions. 54 Therefore, the new generation of CVD screening systems may combine passive ECG-risk detection and existing active CVD examination to provide a more comprehensive risk assessment.
There are several limitations to this study that need to be acknowledged. First, the DLM was only established and validated retrospectively, and its actual clinical impact has not been evaluated in practice. Future studies should embed the ECG-risk score in a passive EHR-based notification system and evaluate its clinical acceptability and effects of intervention in high-risk patients. Second, the black box limitation of the DLM limits its transparency, which may hinder clinicians from designing suitable interventions for high-risk patients. Third, the ECG-risk score performs poorly in people with a history of diseases, although the major benefit of this system may be to passively detect asymptomatic and unaware CVD patients. Finally, the performance was decreased in transnational cohorts, but we released our survival DLM and recommended that researchers establish their own DLM for future applications at each site.
Conclusions
Our study demonstrated that ECG mortality risk was extensively correlated with CVD-related events, which may be better than ECG age as an integrating indicator for passive EHR-based screening. Survival DLM may maximally extract time-to-event information to increase accuracy, which may be applied in future survival analyses. With the mature medical information system and the simple 12-lead ECG test, our ECG risk may be applied in a passive EHR-based CVD risk screening program. Asymptomatic and unaware CVD patients may benefit from this screening in hospitals and the community and can receive immediate intervention to prevent future progression.
Supplemental Material
sj-docx-1-dhj-10.1177_20552076231187247 - Supplemental material for Mortality risk prediction of the electrocardiogram as an informative indicator of cardiovascular diseases
Supplemental material, sj-docx-1-dhj-10.1177_20552076231187247 for Mortality risk prediction of the electrocardiogram as an informative indicator of cardiovascular diseases by Dung-Jang Tsai, Yu-Sheng Lou, Chin-Sheng Lin, Wen-Hui Fang, Chia-Cheng Lee, Ching-Liang Ho, Chih-Hung Wang and Chin Lin in DIGITAL HEALTH
Supplemental Material
sj-docx-2-dhj-10.1177_20552076231187247 - Supplemental material for Mortality risk prediction of the electrocardiogram as an informative indicator of cardiovascular diseases
Supplemental material, sj-docx-2-dhj-10.1177_20552076231187247 for Mortality risk prediction of the electrocardiogram as an informative indicator of cardiovascular diseases by Dung-Jang Tsai, Yu-Sheng Lou, Chin-Sheng Lin, Wen-Hui Fang, Chia-Cheng Lee, Ching-Liang Ho, Chih-Hung Wang and Chin Lin in DIGITAL HEALTH
Footnotes
Availability of Data and Materials
The private database in this study is not publicly available due to privacy and security concerns. The data may be shared with a third party upon execution of the data sharing agreement for reasonable requests, such requests should be addressed to the corresponding author CL. The SaMi-Trop cohort was made openly available (https://doi.org/10.5281/zenodo.4905618). The CODE15 cohort was also made openly available (![]() ).
).
Contributorship
All authors participated in designing the study, generating hypotheses, interpreting the data, and critically reviewing the paper. DJT and CL wrote the first draft, and CSL, CLH, and CHW contributed substantially to the writing of subsequent versions. Statistical analyses were designed and conducted by DJT with support from CL, YSL, and WHF. All authors had full access to all the data in the study and accept responsibility for the decision to submit for publication. DJT, CL, and CCL verified all the data used in this study. The corresponding author (CL) attests that all listed authors meet authorship criteria and that no others meeting the criteria have been omitted. CL had final responsibility for the decision to submit for publication.
Declaration of Conflicting Interests
The authors declared no potential conflicts of interest with respect to the research, authorship, and/or publication of this article.
Funding
The authors disclosed receipt of the following financial support for the research, authorship, and/or publication of this article: This study was supported by funding from the Ministry of Science and Technology, Taiwan (grant numbers MOST110-2314-B-016-010-MY3 to CL and MOST111-2321-B-016-003 to CHW), the Tri-Service General Hospital, Taiwan (grant numbers TSGH-B-111020 to CLH), and the Cheng Hsin General Hospital, Taiwan (grant number CHNDMC-111–07 to CL).
Guarantor
Chin Lin.
Informed Consent
This study was approved by the Institutional Review Board of Tri-Service General Hospital, Taipei, Taiwan (IRB No. C202105049). Since we retrospectively used de-identified data collected and encrypted from the hospital to the data controller, an informed consent waiver was granted for this study.
Supplemental Material
Supplemental material for this article is available online.
References
Supplementary Material
Please find the following supplemental material available below.
For Open Access articles published under a Creative Commons License, all supplemental material carries the same license as the article it is associated with.
For non-Open Access articles published, all supplemental material carries a non-exclusive license, and permission requests for re-use of supplemental material or any part of supplemental material shall be sent directly to the copyright owner as specified in the copyright notice associated with the article.