
Abstract
Background
Artificial intelligence-enabled electrocardiogram has become a substitute tool for echocardiography in left ventricular ejection fraction estimation. However, the direct use of artificial intelligence-enabled electrocardiogram may be not trustable due to the uncertainty of the prediction.
Objective
The study aimed to establish an artificial intelligence-enabled electrocardiogram with a degree of confidence to identify left ventricular dysfunction.
Methods
The study collected 76,081 and 11,771 electrocardiograms from an academic medical center and a community hospital to establish and validate the deep learning model, respectively. The proposed deep learning model provided the point estimation of the actual ejection fraction and its standard deviation derived from the maximum probability density function of a normal distribution. The primary analysis focused on the accuracy of identifying patients with left ventricular dysfunction (ejection fraction ≤ 40%). Since the standard deviation was an uncertainty indicator in a normal distribution, we used it as a degree of confidence in the artificial intelligence-enabled electrocardiogram. We further explored the clinical application of estimated standard deviation and followed up on the new-onset left ventricular dysfunction in patients with initially normal ejection fraction.
Results
The area under receiver operating characteristic curves (AUC) of detecting left ventricular dysfunction were 0.9549 and 0.9365 in internal and external validation sets. After excluding the cases with a lower degree of confidence, the artificial intelligence-enabled electrocardiogram performed better in the remaining cases in internal (AUC = 0.9759) and external (AUC = 0.9653) validation sets. For the application of future left ventricular dysfunction risk stratification in patients with initially normal ejection fraction, a 4.57-fold risk of future left ventricular dysfunction when the artificial intelligence-enabled electrocardiogram is positive in the internal validation set. The hazard ratio was increased to 8.67 after excluding the cases with a lower degree of confidence. This trend was also validated in the external validation set.
Conclusion
The deep learning model with a degree of confidence can provide advanced improvements in identifying left ventricular dysfunction and serve as a decision support and management-guided screening tool for prognosis.
Keywords
Introduction
Left ventricular dysfunction (LVD) is significantly associated with reduced quality of life and increased morbidity and mortality, 1 and it affects more than 26 million people worldwide. 2 Currently, left ventricular ejection fraction (EF) is the most validated and commonly used echocardiographic measure of systolic function,3,4 serving as selection criteria for therapeutic trials that constitute the evidence base of current treatment recommendations. 5 The medical intervention is highly dependent on the present and follow-up EF, and repeat assessment of EF is appropriate in those who receives treatments that may have had a significant effect on the improvement of clinical outcomes. 6 To date, B-type natriuretic peptide (BNP) and N-terminal pro-brain natriuretic peptide (NT-pro-BNP) are the most popular test as a supplementary to echocardiography, such as therapeutic monitoring in adults with cardiac diseases. 7 However, they only provide limited performance with areas under the curve (AUCs) of 0.6–0.8 and might be confounded by age, sex, and disease history.8–11 These motivate clinical need in the development of substitute biomarkers to early detect cardiac function.
With the advantages of rapid, cost-effective, and community-screening accessibility, electrocardiography (ECG) may be a massively scalable screening tool to describe the cardiac function and electric activity. 12 Regarding the extensive improvement of deep learning models (DLMs), artificial intelligence (AI)-enabled ECG has become a mature technique to provide ample information 13 and is widely used in asymptomatic LVD screening.14–16 Additionally, the false-positive cases with normal EF identified by AI-ECG have a significantly higher risk compared to true negative cases on the progression to severe LVD, demonstrating the phenomenon of identifying LVD previvors by AI-ECG. 17 These characteristics enhance the acceptability in clinical practice, and a randomized controlled trial has shown that an additional 43% of potential LVD patients are identified by AI-ECG. 18 However, most AI-ECGs only provide a likelihood of LVD without severity assessment.
LVD is associated with certain classical ECG features. Pacing, left bundle branch block (LBBB), and prolonged QRS duration are considered the typical ECG presentation in patients with left ventricular systolic dysfunction (LVSD). 19 Moreover, atrial fibrillation may cause acute cardiac function reduction in several patients who present a significantly decreased EF.19,20 Although patients with low EF may present atrial fibrillation on ECG, most patients with atrial fibrillation have normal EF, resulting in higher uncertainty in predicting EF in patients with atrial fibrillation. Such uncertainty in medical data makes the decision-making process difficult.21,22 Therefore, the importance of interval prediction in these tasks for better quantifying the uncertainty of model prediction could engender trust with physicians. In the case of using AI-ECG for estimating the actual EF value, we also recognize the importance of interval prediction using a DLM.
The present study aimed to establish a DLM to provide EF prediction for describing the severity of LVD. With the output of this DLM to describe the probability distribution of actual EF using point estimation and standard deviation (SD), we hypothesized that the value of SD is associated with the confidence of AI-ECG because higher SD is presented in uncertain prediction, which may provide additional information compared to the previous DLM (Figure 1). The application of our DLM for performance improvement and LVD previvor identification was also investigated.
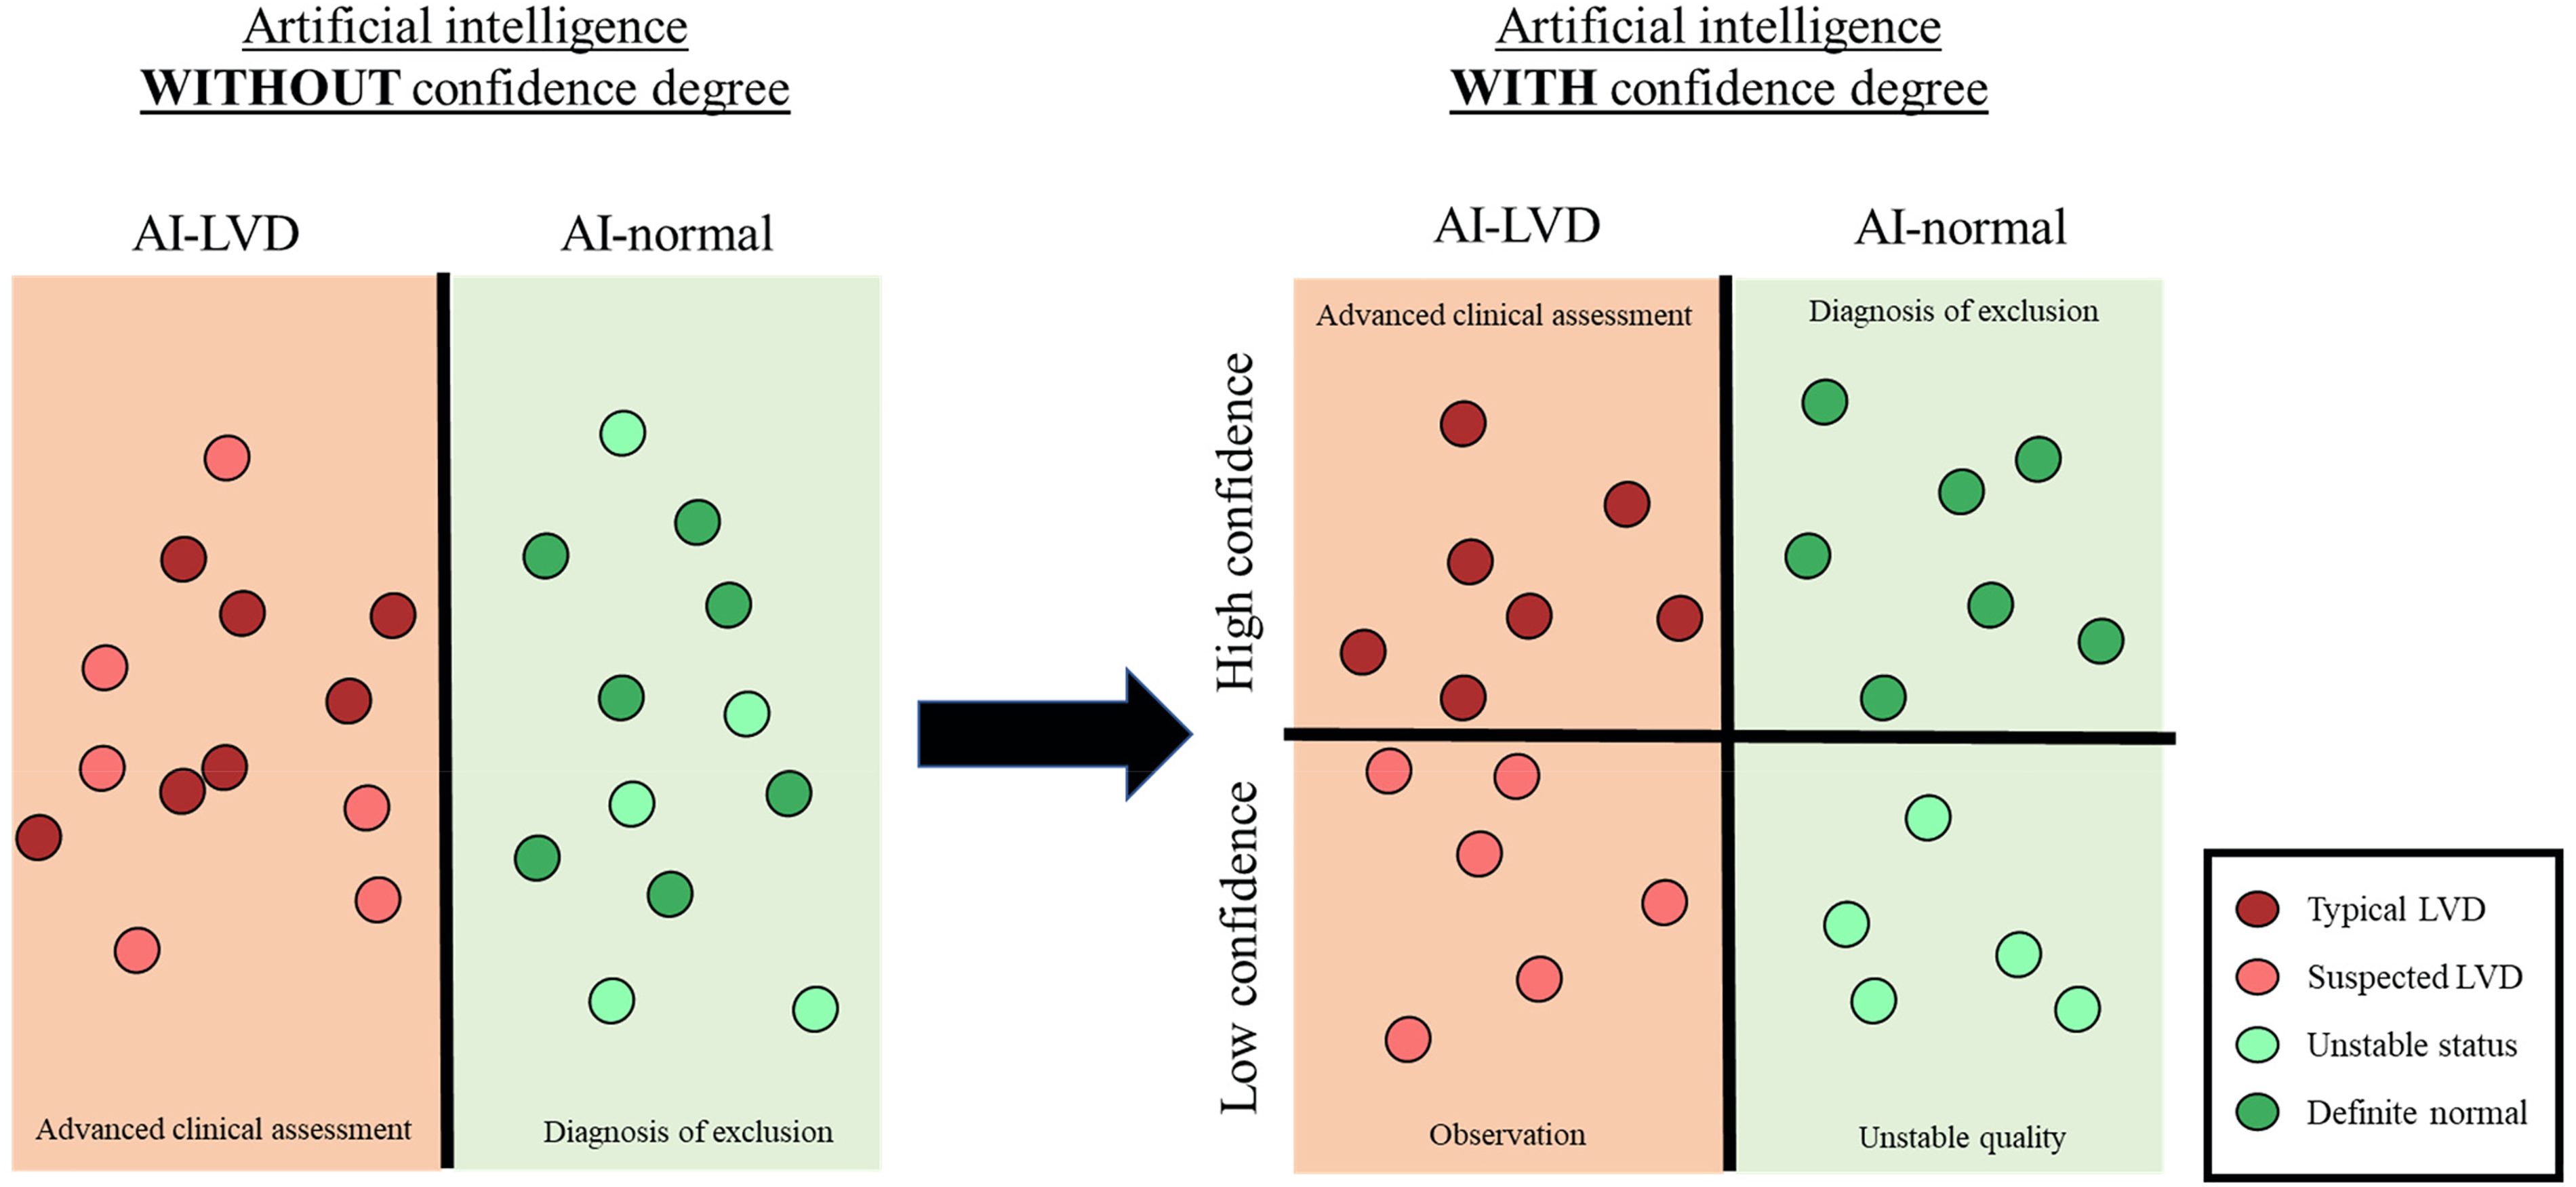
Comparison between artificial intelligence-enabled electrocardiogram (AI-ECG) with and without confidence degree. Previous algorithms have classified the disease using binary output. We proposed a model with a confidence degree to enhance the identification of typical diseases and offer advanced decision support.
Methods
Population
This study was ethically approved by the Institutional Review Board of Tri-Service General Hospital, Taipei, Taiwan (IRB No. C202105049). We performed a multicenter retrospective study from 1 January 2010 to 31 September 2021. Patients who had at least one pair of 12-lead electrocardiogram (ECG) and transthoracic echocardiography (TTE) records within 7 days were included in this study. We excluded inadequate ECGs, such as noise interference, lead dislodgement, or dislocation. The remaining ECGs were annotated by a continuous value of left ventricular ejection fraction (LVEF) ranging from 10% to 90% obtained by the TTE reports. There were no out-of-range data in our hospitals.
As shown in Figure 2, a total of 76,081 and 11,771 patients had at least one ECG-TTE pair in an academic medical center (hospital A) and a community hospital (hospital B), respectively (Figure 1). The study consisted of development, tuning, internal validation, and external validation sets based on different dates and hospitals. In hospital A, we used the earliest part before December 2015 as the internal validation set with 7,619 patients to maximize the follow-up period in this study. The first record was selected in the internal validation set to avoid data dependency. The remaining patients were divided into a development set and a tuning set based on the date of the first record (December 2016). There were 99,692 ECGs from 60,790 patients in the development set and 20,601 ECGs from 7,672 patients in the tuning set. We ensured that there were no repeated patients in these three datasets. The 11,771 patients in hospital B were assigned as the external validation set, and we also only used the first ECG to validate the model performance.

Development, tuning, internal validation, and external validation sets and electrocardiogram (ECG) labeling of actual ejection fraction (EF). Schematic of the dataset creation and analysis strategy, which was devised to assure a robust and reliable dataset for training, validating, and testing of the network. Once a patient's data were placed in one of the datasets, that individual's data were used only in that set, avoiding “cross-contamination” among the training, validation, and test datasets. The details of the flowchart and how each of the datasets was used are described in section “Methods.”
Variables
The electronic medical records (EMRs) of our hospital included digital ECG signals, echocardiographic reports, and patient characteristics. The ECGs were measured by a Philips 12-lead ECG machine (PH080A, Philips Medical Systems, 3000 Minuteman Road Andover, MA 01810, USA) in standard 12-lead format with a sampling rate of 500 Hz with a 10-s period. The eight ECG measurements and 31 ECG rhythms were also collected from the Philips system based on the structured findings statements and corresponding key phrases. 23 The actual EF was measured by either the Teichold method (M mode) or the modified Simpson method in two-dimensional imaging depended on the clinical need. After that, the cardiologists reviewed the estimation of LVEF and recorded it in the medical record. According to the actual EF, patients were classified as having left ventricular dysfunction (≤ 40%) and controls (> 40%) based on the European Society of Cardiology Guidelines. We acquired the following patient data by accessing the EMR system: (1) demographic information, including sex, age, and body mass index (BMI); (2) disease history before the index date of ECG corresponding to International Classification of Disease, Ninth Revision, and Tenth Revision23–25; and (3) TTE parameters, including interventricular septum (IVS) diameter, left ventricular posterior wall (LVPW) diameter, left atrium (LA) size, aortic root (AO) diameter, right ventricular (RV) diameter, pulmonary artery systolic pressure (PASP), and pericardial effusion (PE). Patients with an initial normal EF (≥50%) in the internal and external validation sets followed the new-onset left ventricular dysfunction (LVD, EF ≤ 40%). The following time was recorded at the patient's last known TTE examination.
Implementation of the DLM
The major architecture of the DLM to extract the high-order features has been previously reported.26,27 Each original ECG signal was presented as a 12 × 5000 matrix and randomly cropped in the format of 4096 sequences as input in the training process. We fed ECGs to the network with a 32 minibatch size based on Adam optimization and used an initial learning rate of 0.001 (β1 = 0.9 and β2 = 0.999) that was decayed by a factor of 10 each time the loss after an epoch. A weight decay coefficient of 10−4 and early stopping were used to prevent overfitting. An oversampling process based on the prevalence of 20 equidistant intervals of weights in the development set was applied. The output of the DLM proposed by this study included a point estimation of actual EF and an estimated variance, which was based on a fully connected output layer with two hidden units. Because the value of variance was a positive real number, we applied exponential transformation in the second hidden unit as the output of the estimated variance. We optimized the DLM based on the maximum probability density function of the normal distribution as follows:

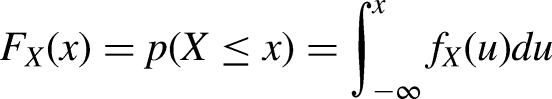
To apply the predications of the DLM for diagnosing the patients with severe to mild left ventricular dysfunction, we used three methods based on two DLMs: Method 1 (M1) was the point estimation predicted by the DLM trained by the root-mean-square error; Method 2 (M2) was the point estimation predicted by the DLM trained by the probability density function of the normal distribution; and Method 3 (M3) was the integration of the point estimation and estimated SD predicted by the DLM trained by the probability density function of normal distribution, which was based on the cumulative distribution function of normal distribution. The cumulative distribution function describes the probability that a variable X with a given probability distribution will be found at a value less than or equal to x. This function is given as follows:

Statistical analysis and model performance assessment
The numbers of patients, percentages, means, and standard deviations were used to express the distribution of patient characteristics where appropriate. The primary analysis was to assess the accuracy of the proposed DLM trained by the probability density function of normal distribution. We compared the point estimation and actual EF by a scatter plot with mean difference (Diff), Pearson correlation coefficients (r), and mean absolute error (MAE) in the internal and external validation sets. Moreover, receiver operating characteristic (ROC) curve and precision-recall ROC (PRROC) curve analyses were conducted to express the diagnostic value in detecting severely low EF, with the indicators of the area under the receiver operating characteristic curve (AUC), sensitivity, specificity, positive predictive value (PPV), and negative predictive value (NPV). We presented two cutoff points as follows: the high sensitivity cutoff point was selected by the maximum of Youden's index in the tuning set, and the high PPV cutoff point was selected by the maximum of the F-measure in the tuning set.
To determine the interpretability of the DLMs, violin plots and box plots were used to describe the distribution and odds ratio based on ECG features among groups predicted by AI-ECG. Furthermore, we proposed eXtreme Gradient Boosting (XGBoost) to extract the information gain and compare the related importance with the kappa score presented. The most important combination of ECG features was analyzed in advance to confirm the higher odds ratio among AI-identified typical LVD and definite normal groups.
Because the SD predicted by the DLM may express the confidence degree, we conducted the same analyses in the samples with lower SDs, which represented the higher confidence degree. Moreover, we selected the ECG with the lowest SD for each patient within 7 days to replace the original ECG (Supplemental Figure S1). The prognostic value of false-positive prediction on new-onset LVD (EF ≤ 40%) in patients with initially normal EF (EF > 50%) was analyzed. Kaplan–Meier (KM) analysis was plotted to compare the prognostic ability of the low-risk group (probability less than high sensitivity cutoff point), median risk group (probability between high sensitivity cutoff point and high PPV cutoff point), and high-risk group (probability higher than high PPV cutoff point). Cox proportional hazards models adjusted by gender and age with standardized hazard ratios (HRs) and 95% conference intervals (95% CIs) were also utilized. We also conducted a subgroup analysis based on the estimated SD of the DLM.
Results
The baseline characteristics of the patients are shown in Table 1. Patients in the development, tuning, internal, and external validation sets were aged 63.8 (17.4), 68.1 (16.4), 63.4 (16.6), and 65.8 (18.1) years old, respectively, with mean EF (SD) values of 63.6 (12.6), 60.9 (14.3), 65.2 (11.4), and 65.4 (10.8), respectively. Figure 3 shows the comparison of the prediction of the DLM and actual EF. In the internal and external validation sets, the mean differences (SD) were 1.65 (9.81) and 1.54 (9.75) with Pearson correlation coefficients of 0.61 and 0.58 and MAEs of 7.56 and 7.51, respectively. The estimated EF by the proposed DLMs with the probability density function of normal distribution loss was highly correlated to the actual EF, which was similar to the traditional DLM with root-mean-square error loss (Supplemental Result S1 and Supplemental Figure S2). Moreover, we additionally compared the actual EF and estimated SD, which presented Pearson correlation coefficients of 0.04 and 0.03, respectively, which indicated that the estimated SD may be independent of the actual EF.

Comparison between actual EF, EF estimated by AI-ECG, and SD estimated by AI-ECG. We presented the mean difference (Diff) with standard deviation, Pearson correlation coefficients (r), and MAE to demonstrate the accuracy of the DLM. The black lines with 95% conference intervals are fitted via simple linear regression on a log scale.
Baseline characteristics.

BMI: body mass index; DM: diabetes mellitus; HTN: hypertension; HLP: hyperlipidemia; CKD: chronic kidney disease; AMI: acute myocardial infarction; STK: stroke; CAD: coronary artery disease; HF: heart failure; Afib: atrial fibrillation; COPD: chronic obstructive pulmonary disease; EF: ejection fraction; LV-D: left ventricle (end-diastole); LV-S: left ventricle (end-systole); IVS: interventricular septum; LVPW: left ventricular posterior wall; LA: left atrium; AO: aortic root; RV: right ventricle; PASP: pulmonary artery systolic pressure; PE: pericardial effusion.
We further evaluated the DLM performance for detecting LVD. Supplemental Figure S3 shows a similar performance in the two DLMs trained by different loss functions, and we selected the probability calculated by the cumulative distribution function of the normal distribution due to the higher interpretability (Supplemental Result S2). Figure 4 shows the diagnostic accuracy in patients with various estimated SDs. For the classification of LVD in the internal and external validation sets, the AUC values were 0.9549 and 0.9365, respectively. In ECGs with SD less than 12, which indicated a higher confidence degree, better AUC values of 0.9634 and 0.9483 were found for the internal and external validation sets. If we further used ECGs with a much lower SD (SD < 10), the AUC values were further improved to 0.9759 and 0.9653 for the internal and external validation sets, respectively. By using the maximum Youden's index in the tuning set, called the high sensitivity cutoff point, sensitivities of 92.1% and 87.2% and specificities of 93.9% and 94.4% were presented in the ECG with the highest confidence degree for the internal and external validation sets, respectively. The PRROC curve analysis results are shown in Supplemental Figure S4. The internal and external PRAUCs were as follows: 0.5907and 0.5471 in all ECGs, respectively; 0.6054 and 0.5644 in ECGs with SD of < 12, respectively; and 0.6443 and 0.6218 in ECGs with SD of < 10, respectively. By using the maximum F-score in the tuning set, called the high positive predictive value cutoff point, the sensitivities of 74.2% and 70.7% as well as positive predictive values of 96.3% and 96.8% were presented in the internal and external validation sets, respectively. Moreover, we used the ECG with the lowest SD within 7 days to replace the index ECG, and Supplemental Figure S5 shows the AUC improvements in all ECGs (from 0.9549 and 0.9365 to 0.9559 and 0.9431 in the internal and external validation sets, respectively) and in ECGs with an SD < 12 (from 0.9634 and 0.9483 to 0.9628 and 0.9539 in the internal and external validation sets, respectively). However, the AUC values were not additionally increased in patients with an initial ECG of SD < 10 (from 0.9759 and 0.9653 to 0.9757 and 0.9685 in the internal and external validation sets, respectively), which indicated that it was unnecessary to use the ECG with a lower SD when patients already had an ECG of SD < 10. We divided the validation dataset into two subsets, while subset 1 excluded the patients with atrial fibrillation during echocardiography examination, and subset 2 only included patients with sinus rhythm. Both subsets are presented in Supplemental Table S1. The performance in subset 1 showed a similar trend compared to before exclusion (Supplemental Figure S6). Moreover, we further evaluated the performance for patients in sinus rhythm only and found similar results in all ECGs, while the AUC reached 0.9779 and 0.9708 significantly in ECGs of SD < 10 in both internal and external validation sets, respectively (Supplemental Figure S7). This indicated high confidence may contribute to the prediction among patients with sinus rhythm.

The receiver operating characteristic (ROC) curve of deep learning model (DLM) predictions based on ECG to detect left ventricular dysfunction. Left ventricular dysfunction was defined as an actual EF of ≤ 40. The risk probability was calculated based on the clinical point, estimated EF, and estimated SD by the cumulative distribution function of the normal distribution. The cutoff point was selected based on the maximum Youden’s index in the tuning set and presented using a circle mark, and the area under the ROC curve (AUC), sensitivity (Sens.), specificity (Spec.), positive predictive value (PPV), and negative predictive value (NPV) were calculated based on the cutoff point.
Supplemental Table S2 summarizes the actual EF in patients with and without each ECG rhythm (the details are shown in Supplemental Result S3). The mean actual EF was significantly reduced, and the SD was significantly increased in certain rhythms, such as atrial fibrillation, left bundle branch block, ischemia/infraction, left atrial enlargement, and left ventricular hypertrophy. However, the first-degree AV block and junctional rhythm only showed a significant mean reduction, but the variance was maintained in the internal valuation set. Figure 5(a) shows the ECG characteristics in the AI-identified LVD and normal LVD with high and low confidence degrees. The typical LVD showed a higher proportion of abnormal heart rate (bradycardia and tachycardia) compared to the other group, and the suspected and typical LVD both presented prolonged QT interval and abnormal T wave axis compared to the normal groups. This difference showed the ECG differences in the four groups. Moreover, the odds ratio (OR) of 7.86 (95% CI: 6.59–9.37) in the suspected LVD revealed the characteristics of this group, and the major rhythms in the typical LVD and definite normal LVD were pacemaker rhythm and sinus rhythm, respectively. Figure 5(b) shows the components of these four groups, and the most important ECG features contributing to group predictions were ordered as the T-wave axis, corrected QT interval, QRS wave axis, and heart rate. However, there was only a kappa value of 32.64% to use known ECG features for establishing DLM predictions. Figure 5(c) concluded the most important ECG features in the typical LVD and definite normal. The OR of the typical LVD increased to 14.01 (95% CI: 11.23–17.48) in patients with a QRS wave axis of > 450, a T wave axis of < 180, and an abnormal heart rate (< 60 or > 100). The specific OR of the predicted definite normal was 4.29 (95% CI: 4.03–4.57) in patients with sinus rhythm, a QRS wave axis of < 450, and a PR interval of < 180.

Relationship between the selected ECG features and EF predicted by AI-ECG. The patients were classified into definite normal (p. LVD < high sensitivity cutoff point and SD < 10), unstable status (p. LVD < high sensitivity cutoff point and SD > 10), suspected LVD (p. LVD > high sensitivity cutoff point and SD > 10), and typical LVD (p. LVD > high sensitivity cutoff point and SD < 10). (A) Violin plots and box plots to illustrate the distribution and odds ratio based on ECG features among groups predicted by AI-ECG. (B) The related importance was extracted from the information gained from the XGB model, and the kappa score is presented. (C) The most important combination in the AI-identified typical LVD and definite normal is shown.
We implemented the DLM with the estimated SD into ECG interpretation, and Figure 6 presents the selected typical and suspected LVD ECGs with high and low confidence degrees. The top-left ECG was identified as a suspected LVD from a 93-year-old male. The ECG presented atrial fibrillation and poor R wave progression, and the DLM showed low confidence and a median risk of LVD. This case was diagnosed as acute decompensation heart failure with mildly reduced EF and non-ST-elevation myocardial infarction after echocardiography. The top-right case was a 54-year-old male in the emergency department. His ECG presented atrial fibrillation with a rapid ventricular response (heart rate up to 181), and the DLM showed high confidence and a high risk of LVD. This case was diagnosed as acute heart failure with an EF of 27.5% after echocardiography. The bottom-left ECG was conducted in the outpatient department. A 60-year-old male with a history of AMI s/p CABG lost follow-up for 3 years and revisited the outpatient department due to shortness of breathing. This ECG presented atrial flutter with a rapid ventricular response, and the DLM identified the case as a typical LVD. Echocardiography after 3 days confirmed heart failure with reduced EF and thrombus in the apex. The bottom-right ECG was from a 37-year-old female who presented with generalized edema in the outpatient department. The ECG feature showed an abnormal heart rate and poor R wave progression, which was caught by the DLM and classified as high-risk LVD with high confidence. She was confirmed to have dilated cardiomyopathy with reduced EF after the complete study. The above findings demonstrated that the application value of our estimated SD can provide additional information in clinical practice.

Selected ECGs with low and high confidence proposed by the DLM. Each ECG is presented with risk and confidence prediction. The deep-color space was defined as an important characteristic of LVD spotted by DLM. Such typical ECG features were associated with LVD.
Because the significant predictive value of AI-enabled ECG for LVD has been recognized, 28 we also analyzed the long-term effects on new-onset LVD in the false-positive group. We defined low risk, median risk, and high risk based on high sensitivity and high positive predictive value cutoff points. During the median follow-up years of 3.17 (IQR: 1.08–5.35) and 2.25 (IQR: 0.64–4.44), Figure 7 shows the gender and age-adjusted HRs of 4.57 (95% CI: 2.99–6.98) and 7.01 (95% CI: 5.22–9.43) for the high-risk group compared to the low-risk group in the internal and external validation sets, respectively. The HRs of the median risk group were 3.39 (95% CI: 2.66–4.32) and 3.30 (95% CI: 2.72–4.01) in the internal and external validation sets, respectively, which presented a significant dose‒response effect for DLM predictions. This probability predicted by the DLM with age and gender provided C-indices of 0.780 and 0.789 in the internal and external validation sets, respectively. Interestingly, subgroup analysis of ECGs with an estimated SD < 12 showed higher HRs of 5.11 and 7.34 in the internal and external validation sets, respectively, for the high-risk group as well as 4.25 and 4.03 for the median-risk groups in the internal and external validation sets, respectively, and the C-indices also increased to 0.789 and 0.796, respectively. In the subgroup of ECGs with an estimated SD < 10, higher HRs of 8.67 and 9.46 (high risk) as well as 5.92 and 5.29 (median risk) were obtained with C-indices of 0.801 and 0.810 in the internal and external validation sets, respectively. These results demonstrated that false-positive predictions represented a higher future incidence of new-onset LVD. In addition, our estimated SD not only provided a confidence degree for the diagnosis of current LVD but also contributed to the previvor information.

Long-term incidence of developing new-onset left ventricular dysfunction (LVD, EF ≤40%) in patients with an initially normal EF (EF >50%) stratified by AI-ECG. The C-index was calculated based on the continuous value combined with sex and age. The analyses were conducted in the internal and external validation sets. The table shows the at-risk population and cumulative risk for the given time intervals in each risk stratification.
Discussion
The present study developed a DLM trained by a probability density function of normal distribution, which provided additional predictions of estimated SD. The EF range prediction provided a severity indicator, and we proposed a transform method from continuous prediction to probability for better interpretation. Interestingly, the estimated SD can be considered as an indicator of confidence degree. The DLM performed better in ECGs with lower SD, which may be used to guide clinical practice. Moreover, the previvor analysis also showed the application value of the estimated SD. The high-risk group with high confidence presented near to 10-fold risk, which emphasized the clinical importance and may be used as evidence for rapid treatment such as vasodilators and intravenous diuretics.
The present study provided a continuous EF estimation with Pearson correlation coefficients of 0.61 and 0.58 as well as MAEs of 7.56 and 7.51 in the internal and external validation sets, respectively, which was compatible with the state-of-the-art performance.29,30 Although previous studies used traditional regression output to estimate the EF, our DLM trained by the probability density function of a normal distribution also showed similar performance (Supplemental Figure S2). The advantage of the proposed DLM was to provide a probabilistic forecast to better describe the prediction. The other limitation of using traditional regression output is the inconsistent threshold for detecting an EF ≤ 40%. The model performance based on the predicted EF of 40% may decrease the total sensitivity and specificity compared to the threshold based on the Youden Index. 14 We also demonstrated an unusual threshold to maximize sensitivity and specificity using regression output (Supplemental Figure S3). A previous study has revealed the potential difficulties in decision-making that could be detrimental to analysis, 31 and the inconsistent threshold may have the highest sensitivity and specificity. 32 The proposed DLM provided both point estimation and SD, which may overcome this issue. We proposed an alternative method using the cumulative distribution function of a normal distribution with similar AUC values of > 0.94, which achieved a similar performance with previous binary AI-ECGs to identify LVD.14,15,33 Therefore, the proposed DLM may become the standard to estimate continuous clinical values in the future.
To the best of our knowledge, there was no study to date on estimating EF values with confidence degrees. The SD index may serve as an important indicator to describe the uncertainty of the prediction. The DLM-defined typical LVD presented changes in the T wave axis, QRS duration, corrected QT interval, abnormal heart rate, and PR interval. One of the potential mechanisms for heart failure is represented by prolongation of the PR interval on the electrocardiogram due to atrioventricular conduction disturbance, which is considered as harmless conduction disturbance and severely altered atrial electric properties in the setting of left ventricular systolic dysfunction.34,35 A prolonged QRS duration for patients with reduced LVEF is thought to be related to the presence of underlying left ventricular dyssynchrony contraction. 36 Besides, these ECG abnormalities have been demonstrated the association with future HF. A large-scale study pointed out that ECG markers including QRS duration, and ST/T-wave abnormalities are risk factors for HRrEF, while higher resting heart rate and abnormal P-wave axis are associated with HFpEF. 37 Previous multicenter research also found significant relationship between PR interval and heart failure. 38 Moreover, our study showed patients with atrial fibrillation are more likely to be classified as suspected LVD with lower confidence by DLM. Atrial fibrillation increases in resting heart rate and the exaggerated heart rate response to exercise result in shorter diastolic filling time, leading to a reduction in cardiac output. However, the unstable measurement of ejection fraction in patients with atrial fibrillation may be identified as uncertainty of prediction, which can be an alternative indicator for the following decision such as rhythm control and medication. This perspective of uncertainty estimation has also been proposed in recent years.21,22 AI-ECG is able to distinguish the variants of LVD and provide clinical reference and interpretability with proposed SD as a degree of confidence. The predicted LVD group should receive echocardiography immediately and the suspected LVD group should focus on the potential arrhythmia. The confirmation of predicted definite normal is specific to exclude heart failure.
In the present study, the AI-identified positive ECGs had a higher risk of new-onset LVD in patients with a LEVF of > 50%, which was consistent with a previous study showing a fourfold increased risk of developing LVD over the ensuing 15 years. 16 Cases with normal status identified as positive intent to develop a disease compared to true negative cases, which indicated subtle ECG changes from AI-ECG could provide information in identifying potential risk. 16 We additionally used confidence degree to distinguish the clinical difference among groups, and the HR of developing new-onset LVD was increased from less than 5 to more than 8 in the high-risk group compared to the low-risk group in the high-confidence degree subgroup. Therefore, early detection and treatment of LVD may improve prognosis and reduce costs using immediate intervention, 39 which emphasizes the necessity and benefit of AI-ECG for LVD screening in clinical deployment.
This study had several limitations. First, due to the retrospective design, we were unable to reconduct an ECG when a large SD was identified by AI-ECG. Although we used ECGs with the lowest SD within 7 days and achieved higher accuracy, a prospective clinical trial should be conducted to validate the clinical impact of this information. Second, although we proposed the DLM with an estimated SD to identify the typical cases, the typical ECG features of LVD still should be further explored.
In conclusion, the proposed DLM provides a better probabilistic forecast to estimate the EF, which may become a non-invasive and easily accessible early-stage screening tool for patients without a history of echocardiography. With the information of SD, DLM is much more interpretable in clinical practice, which demonstrates the association with future HF and stratifies the specific group for differential diagnosis. Future large-scale and prospective clinical trials should be performed to validate the clinical utility of intensive AI-ECG examinations for EF estimations.
Supplemental Material
sj-docx-1-dhj-10.1177_20552076221143249 - Supplemental material for Artificial intelligence-enabled electrocardiogram screens low left ventricular ejection fraction with a degree of confidence
Supplemental material, sj-docx-1-dhj-10.1177_20552076221143249 for Artificial intelligence-enabled electrocardiogram screens low left ventricular ejection fraction with a degree of confidence by Chun-Ho Lee, Wei-Ting Liu, Yu-Sheng Lou, Chin-Sheng Lin and Wen-Hui Fang, Chia-Cheng Lee, Ching-Liang Ho, Chih-Hung Wang, Chin Lin in Digital Health
Footnotes
Acknowledgments
The authors also would like to thank the AIoT center, TSGH for support of this project.
Contributorship
CHL, YSL, CSL, WHF, and CL designed the study and model. CCL, CLH, and CHW were involved in the acquisition of data. CHL, WTL, YSL, and CL analyzed and interpreted data. CHL and YSL wrote the original draft preparation. CL supervised the project. All authors agreed and were responsible for the content of the manuscript. All authors read and approved the final manuscript.
Declaration of conflicting interests
The authors have no conflicts of interest to declare.
Funding
The present study was supported by funding from the Ministry of Science and Technology, Taiwan (MOST110-2314-B-016-010-MY3 to C. Lin and MOST110-2321-B-016-003 to C.H. Wang) and the Tri-Service General Hospital, Taiwan (TSGH-B-111020 to C.L. Ho).
Guarantor
CL
Institutional review board statement
This study was ethically approved by the Institutional Review Board of Tri-Service General Hospital, Taipei, Taiwan (IRB No. C202105049).
Supplemental material
Supplemental material for this article is available online.
References
Supplementary Material
Please find the following supplemental material available below.
For Open Access articles published under a Creative Commons License, all supplemental material carries the same license as the article it is associated with.
For non-Open Access articles published, all supplemental material carries a non-exclusive license, and permission requests for re-use of supplemental material or any part of supplemental material shall be sent directly to the copyright owner as specified in the copyright notice associated with the article.