
Abstract
Objective
The objective of this study is to propose a novel in-silico method called Hemolytic-Pred for identifying hemolytic proteins based on their sequences, using statistical moment-based features, along with position-relative and frequency-relative information.
Methods
Primary sequences were transformed into feature vectors using statistical and position-relative moment-based features. Varying machine learning algorithms were employed for classification. Computational models were rigorously evaluated using four different validation. The Hemolytic-Pred webserver is available for further analysis at http://ec2-54-160-229-10.compute-1.amazonaws.com/.
Results
XGBoost outperformed the other six classifiers with an accuracy value of 0.99, 0.98, 0.97, and 0.98 for self-consistency test, 10-fold cross-validation, Jackknife test, and independent set test, respectively. The proposed method with the XGBoost classifier is a workable and robust solution for predicting hemolytic proteins efficiently and accurately.
Conclusions
The proposed method of Hemolytic-Pred with XGBoost classifier is a reliable tool for the timely identification of hemolytic cells and diagnosis of various related severe disorders. The application of Hemolytic-Pred can yield profound benefits in the medical field.
Keywords
Introduction
Hemolysis is a process that causes the premature destruction of red blood cells (RBCs) in the bloodstream prematurely before reaching their expected lifespan. The natural lifespan of RBCs is approximately 120 days. After that, they naturally break down and are removed from the blood by the spleen, as the spleen is found in all vertebrates. 1 Anemia is a common blood disorder resulting from a reduction in the production of RBCs and an increase in their destruction. This imbalance causes a decline in the hemoglobin level and oxygen-carrying capacity of the blood. The main causes of hemolysis are acquired or hereditary 2 as explained in Figure 1. Certain medications sometimes cause acquired hemolysis. Medications can cause oxidative damage to RBCs, leading to the release of redox-active Hb into the fluid compartment, which is a toxic. Therefore, carefully monitoring patients taking medications that can cause hemolysis and making appropriate dosage adjustments, or discontinuing such medications is critical to prevent further damage. 3 Acquired conditions most significantly occur due to pathogens. The best examples of inherited conditions are narratively described as spherocytosis and sickle cell. 4 Infectious pathogens may cause hemolytic anemia by the direct action of toxins, including alpha- or beta-hemolytic Streptococci, Clostridium perfringens (C. welchii, or Bacillus welchii), and Meningococcus. Occasionally, RBCs are destroyed by various pathogens of different species such as Plasmodium species, Bartonella species, and Babesia species. Sometimes antibody production against pathogens causes hemolytic anemia that like in the case of Epstein-Barr virus and mycoplasma.5–15

Classification of hemolysis.
These pathogens produce a toxin in the human body that cause numerous diseases. Researchers, working on these pathogens, need to identify which protein causes hemolysis. A study regarding G-6-P-D scarcity shows RBCs have a “Bitten Apple” like appearance. By using a variety of image processing techniques, an anemic blood sample has been represented. The Wiener filter and Sobel edge detection method are applied for its detection.
16
Subsequently, artificial intelligence provides numerous computational intelligence models that help to assimilate models for predicting the properties of proteins using a primary sequence which can further aid drug discovery and development. Various approaches in bioinformatics have been developed by scientists to identify functional attributes of proteins. Such techniques have been successfully used for sequence analysis of antioxidant proteins, 19 B-cell epitopes, 20 anticancer peptides, 21 anti-CRISPR proteins, 22 adaptor proteins 23 and many other such properties that are helpful in finding treatment for varying disorders. Experimental approaches have certain limitations (e.g. time-consuming, laborious, and expensive), so a computational model that can distinguish Hemolytic protiens (HLPs) from non-Hemolytic proteins (non-HLPs) would be highly desirable. HemoPI 24 and HemoPred, 25 have previously investigated this issue. Chaudhry et al. 24 proposed HemoPl which is a computational framework for predicting the hemolytic activities of peptides. It incorporated support vector machines (SVMs) and position-specific compositional information. HemoPred, a method that uses random forests with hybrid features, has been developed by Win et al. However, in all these tools previously proposed, there is a huge gap for improvement in terms of performance. The use of peptide-based drugs in medicine is often limited by their hemotoxic or hemolytic effects. For example, many antimicrobial peptides (AMPs) that are currently in preclinical or clinical applications are only applied topically, as they can cause hemolysis if administered systemically. AMPs can be highly effective in fighting bacterial infections without the development of bacterial resistance, making them a promising avenue for the treatment of antibiotic-resistant infections. 26
The current study aims to identify Hemolytic proteins (HPs) employing the use of various features and different machine learning algorithms. Various rigorous validation techniques were used for evaluation such as self-consistency testing, independent set test, 10-fold cross-validation, and jackknife test are used. In the rest of the article, the “Materials and methods” section contains the proposed approach, the details of the data set used, and explains the statistical moment-based feature extraction. In the “Training machine learning classifiers” section, the feature set is tested on different classifiers to ascertain the best classifier. In the “Results” section, the results of the experimentation are described. The “Discussion” section contains a comparison and discussion in terms of the performance of all employed classifiers. The “Webserver” section contains the details and guidance related to the Web Server. Finally, in the “Conclusions and future work” section, we conclude the article. This study was conducted in the University of Management and Technology and approximately took six months. Major time was spent on data collection, the development of computationally intelligent models, and their validation and testing.
Materials and methods
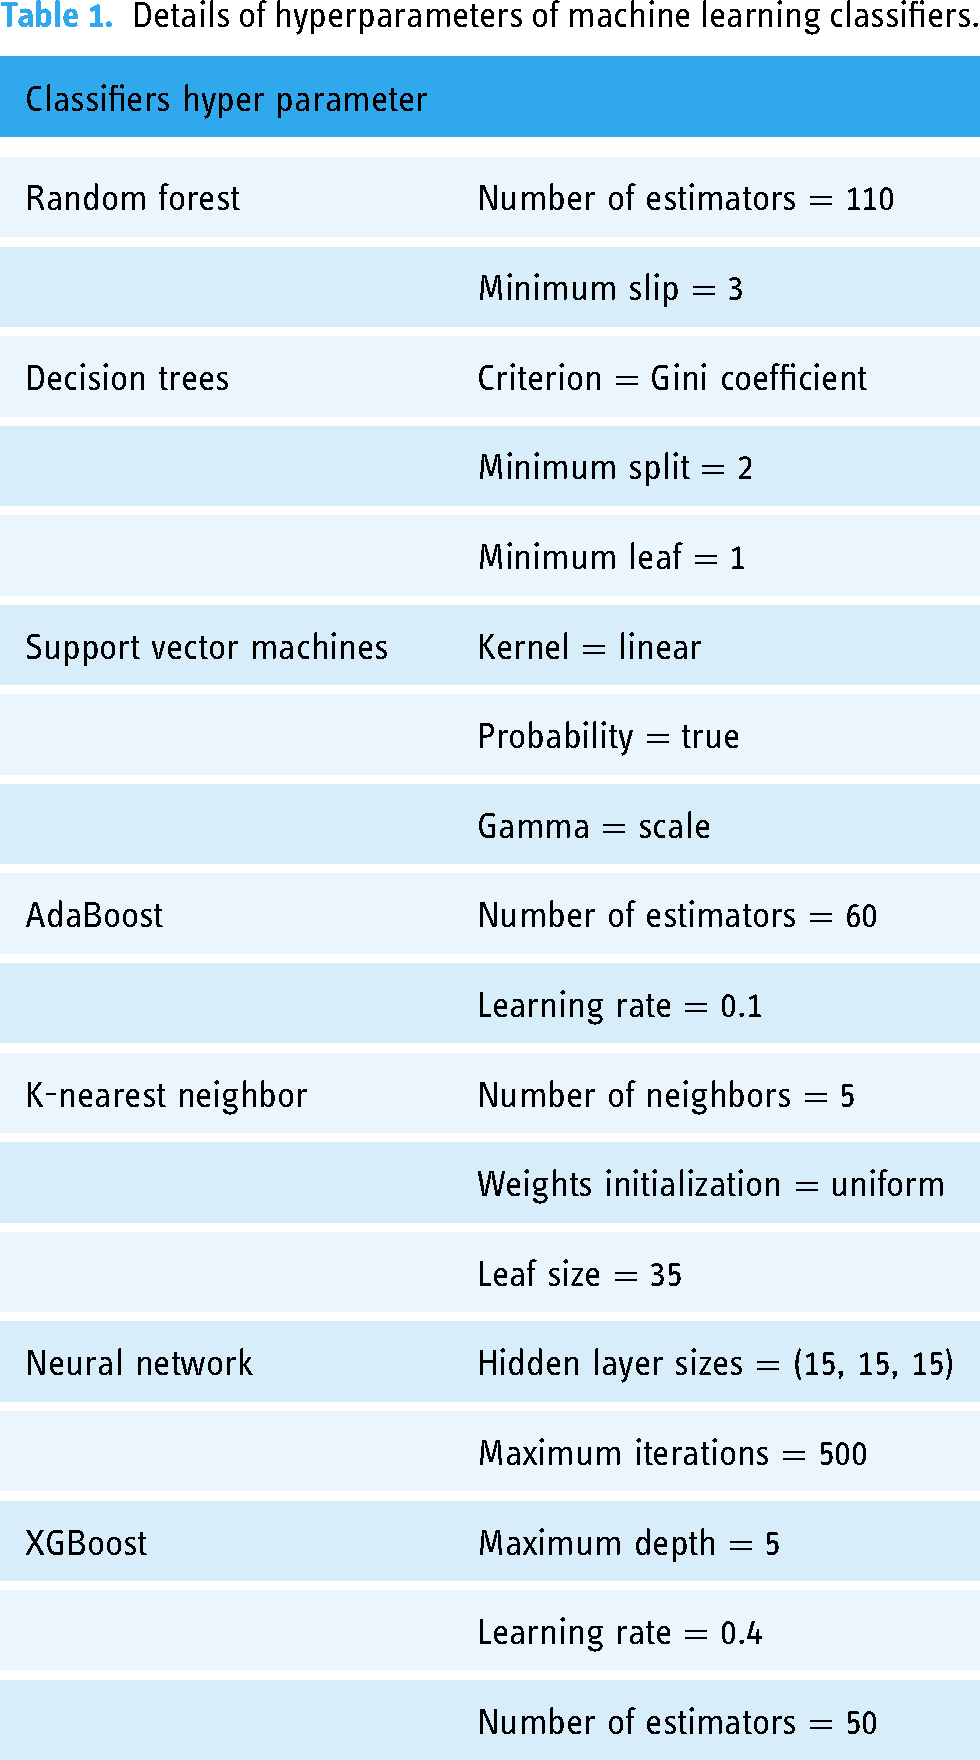
The proposed approach for detecting HPs is described in the methodology given in Figure 2(a) and (b). The primary purpose of the proposed system is to provide an assiduous model capable of accurately identifying HP patterns. Various features are computed including frequency-dependent features, position-relative features, and statistical moments. Computing is characterized by its simplicity, ability to reach reasonable solutions with minimum knowledge, and efficiency in composite and non-linear problems relating to a process of gradual change and development. Next, the classification was performed using different classifiers, such as AdaBoost (adabst), decision tree (DT), k-nearest neighbors (kNN), neural network (NN), random forest (RF), SVM, and XGBoost (xgboost) (see Figure 3). After evaluation through various techniques, the best performing model was selected which was used for web server deployment.
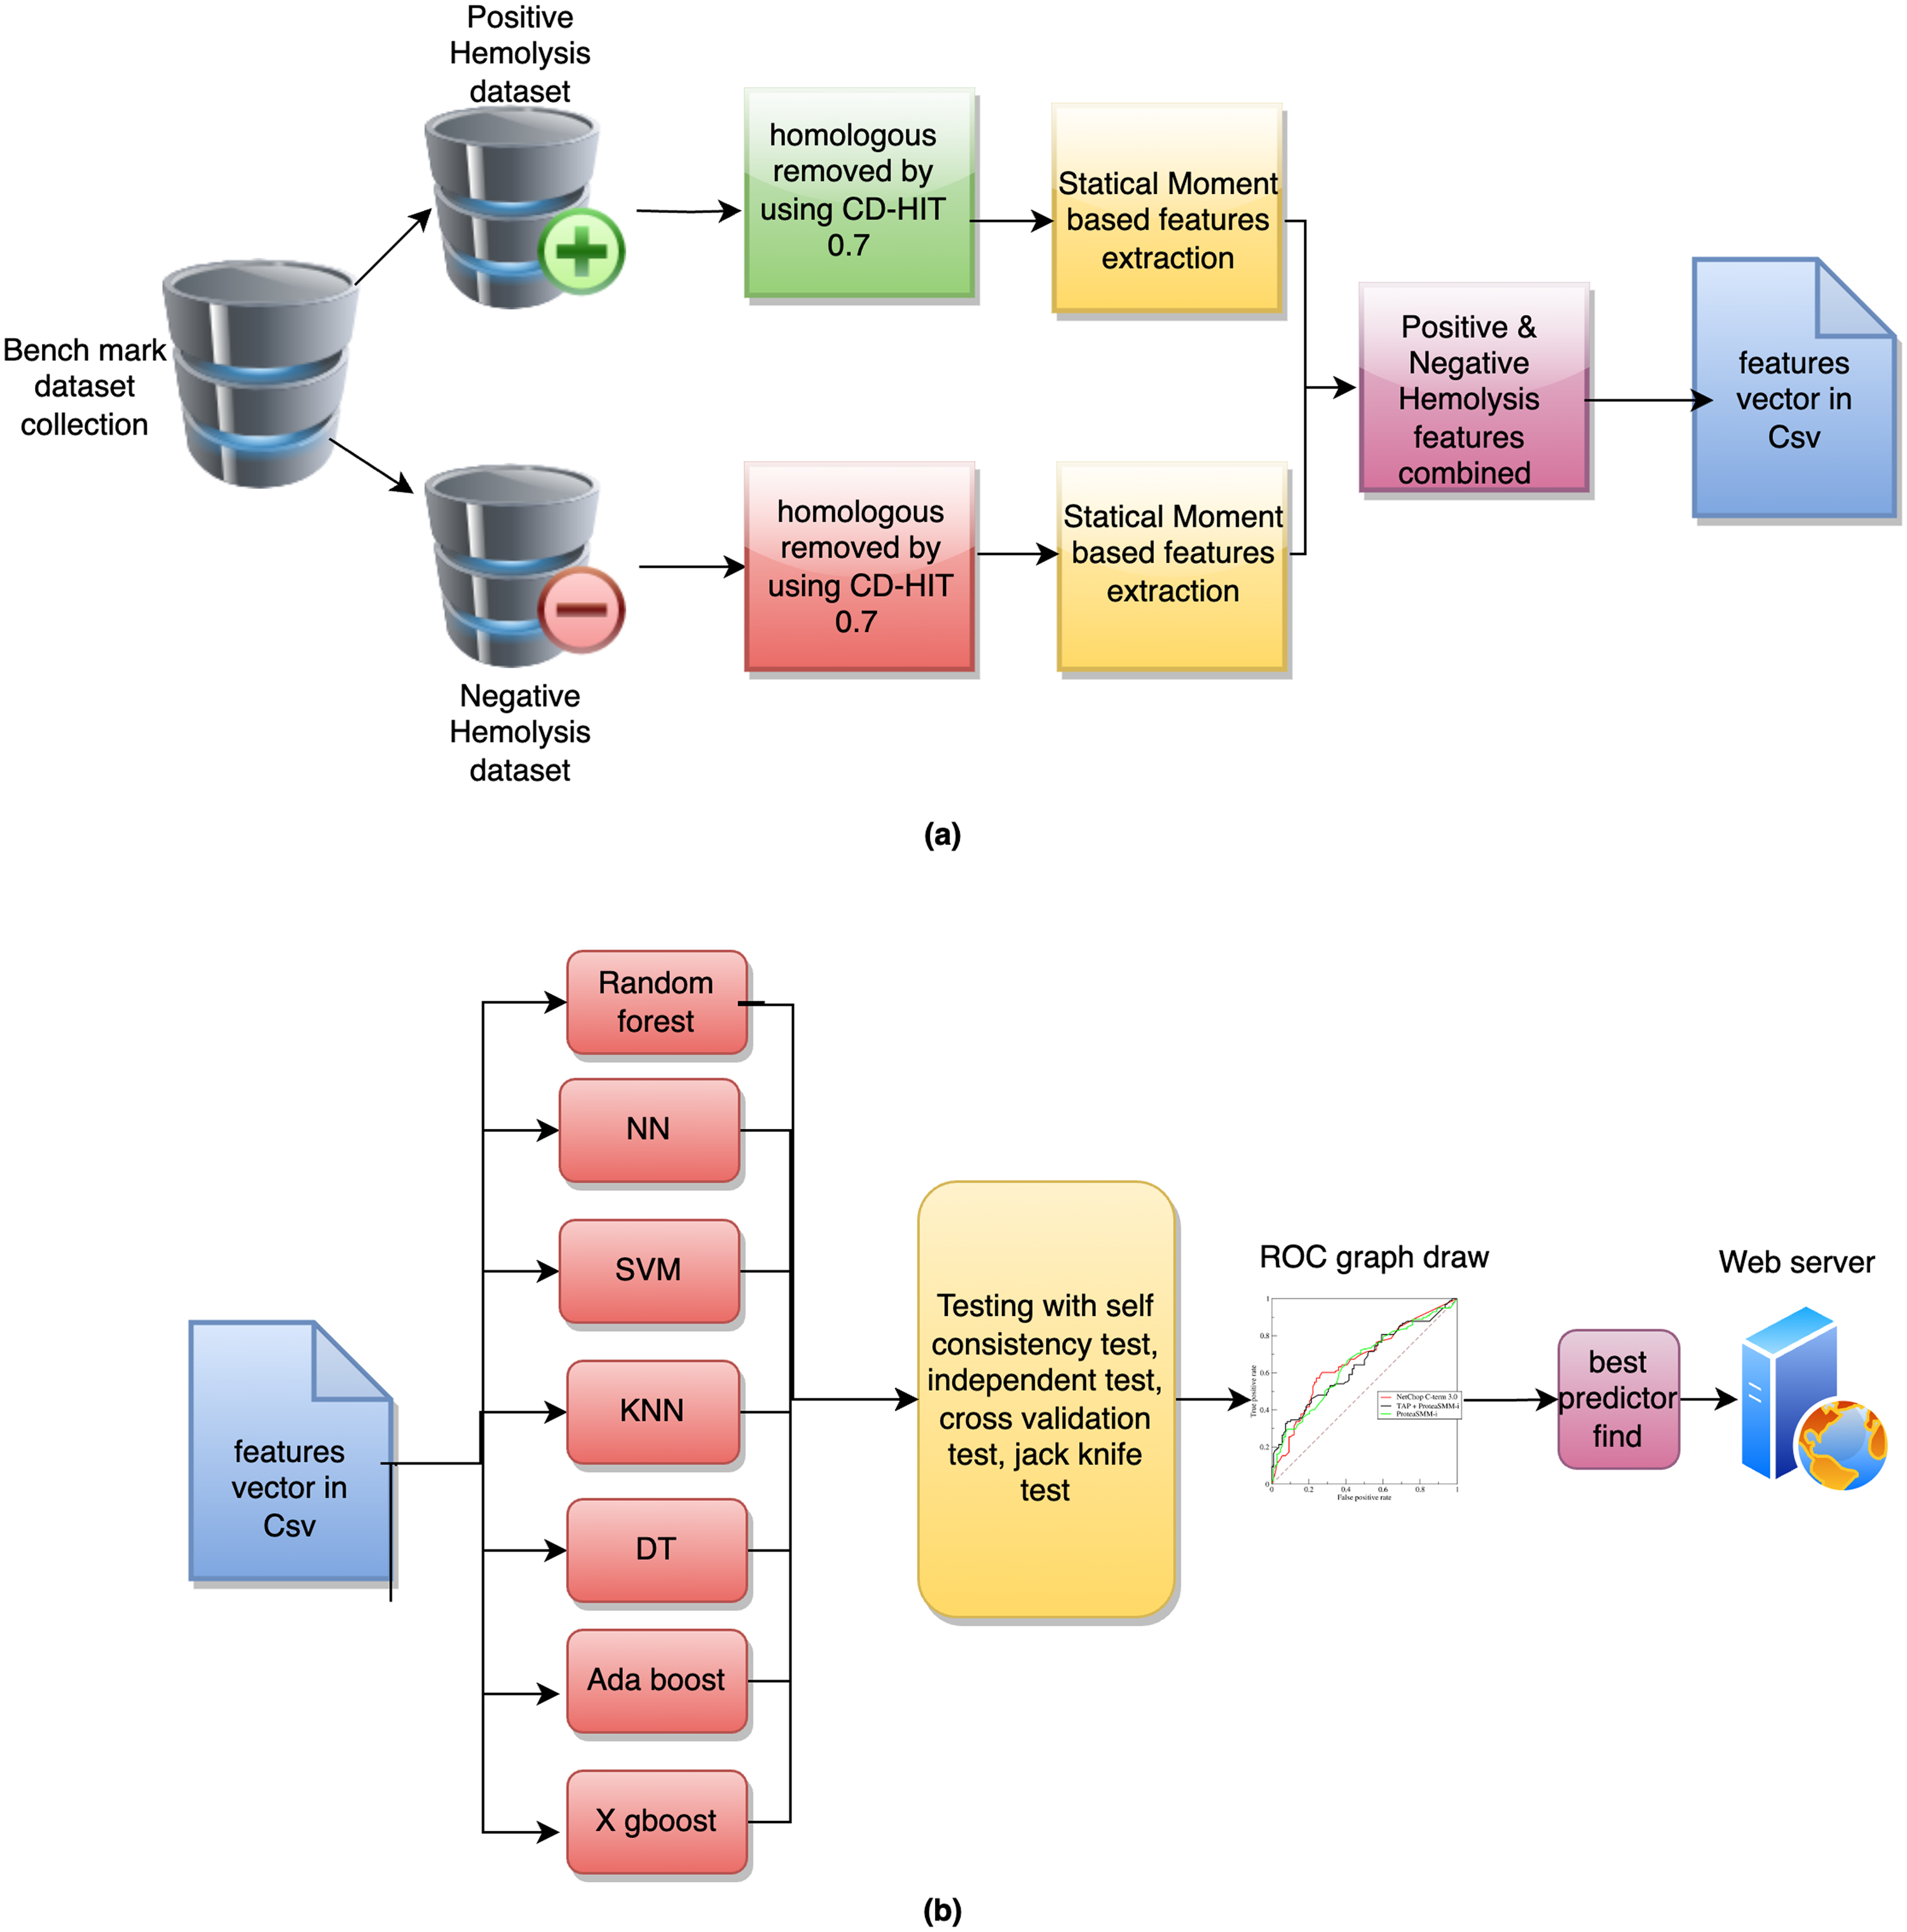
Graphical depiction of the whole methodology: (a) from sequences to features and (b) from features to classification.
XGBoost illustration.
Formulation of metrics
For performance evaluation, four interlinked performance metrics such as accuracy (Acc), sensitivity (Sn), specificity (Sp), and Matthew’s correlation coefficient (MCC) were employed. Accuracy gives you a broad sense of the model’s prediction accuracy. Sensitivity refers to the model’s ability to reliably predict positive samples. In the same way, specificity is employed to provide a numerical estimate of the model’s accuracy in predicting negative samples. Taking the imbalanced positive and negative samples in data sets into consideration, MCC is another acceptable amount that evaluates the classification precision of inequality positive and negative samples.


Data set collection
HP data set was collected from the UniProtKB-SwissProt using the keyword “Hemolysis [KW-0354].” The protein sequences were collected on 2 February 2021. The correctness of data is the key attribute that drives the performance of any desired predictor. A specific well-defined set of rules are used to collect robust and accurate data set as described in previous many studies. Based on these criteria, data set is collected that is best in quality, informative, accurate, and diverse.
We conducted our experiments using both an imbalanced data set (ImBD and a balanced data set (BD). This approach can help you evaluate the performance of the model on different types of data, which can be useful for developing more robust and accurate solutions. This approach can also provide insights into the strengths and weaknesses of your algorithm or model, and help you identify areas for improvement. In the first stage, the sequences with ambiguous annotations like “fragment,” “potential,” “probable,” “probably,” “maybe,” or “by similarity” were excluded from the data set. This yielded a total of 7107 hemolytic proteins out of which, only 946 were reviewed, thus, only these reviewed sequences were included in the positive data set. Similarly, the “non-Hemolysis” proteins were also collected from UniProtKB_SwissProt, by using a converse query, and a total of 980 “non-Hemolysis” reviewed proteins were collected to be used as negative data set. After retrieving data from UniProt, redundancy from data set was reduced by using CD-HIT program with a threshold value of 0.7, that is, sequences having similarity of more than 70% were excluded from data set. 44 This yielded 329 clusters of positive data set, and 891 clusters of negative data set.
Thus, only 1 representative from each cluster was used, the ImBD comprised 329 positive sequences and 891 negative sequences, and there were 329 positive sequences and 330 negative sequences in the BD. Since the study only involved sequential data collected from well known repositories and not from individual patients, therefore, no patient consent was required for the study.
Feature extraction
The amino acid sequence in a polypeptide chain determines the biophysical characteristics of proteins. An amino acid’s presence or absence does not determine its characteristics. A protein’s behavior is not only affected by amino acid composition, but also by its position in the amino acid cycle. From experience and known data, even the slightest change in the relative positions of amino acids could dramatically impact the entire structure of a protein.45,46 Considering these facts, mathematical models that extract characteristics from a primary structure of the protein should not just depend on information about the constituents of these proteins, but should also consider the amino acid positions relative to each other. 47
Statistical moments
For pattern recognition, statistical moments are used to centralize some key arrangements in the collected data.48–56 To describe different properties of data, various statistical moments are utilized such as polynomial and distribution functions. In this study, raw, Hahn, and central moments are employed, as reported in various previous studies such as.57–59
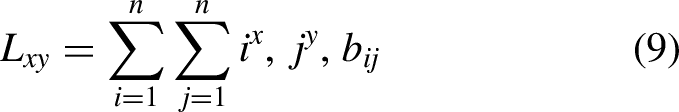
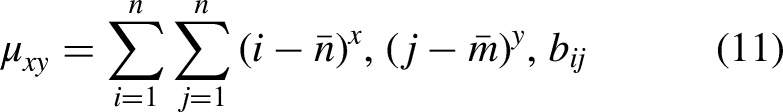
The raw moments are used to evaluate the asymmetry, mean, and variance of a probability distribution. The central moments calculate similar statistics but using the data centroid. With reference to the centroid, the central moments are considered to be as location-invariant whereas these moments are scale-variant. The Hahn moments are based on the Hahn polynomial,60,61 and these moments are considered to be as scale-invariant and location-invariant. The above-mentioned moments are important to calculate the feature vector for protein sequence data because of their sensitivity towards biological sequences. Each moment calculates its own measurements given the data. Moreover, the alteration in the data attributes infers the change in the measurements generated from the moments. In the present study, we used two-dimensional (2D)-matrix representation for the linear composition of protein sequences as


Computation of position relative incidence matrix (PRIM)
To analyze proteins computationally requires a mathematical model that uses sequence order information. The relative positions of the residues are key determinants of protein properties. Furthermore, it is necessary to quantify the relative positions of residues in polypeptide chains. It extracts the relative positional information of amino acid components from the sequence and forms the PRIM as a matrix of 20

Computing reverse position relative incidence matrix (RPRIM)
Machine learning algorithms are either efficient or accurate based on how thoroughly and precisely relevant aspects of data have been extracted. Data mining algorithms can adapt themselves in discovering obscure patterns buried within data by understanding and uncovering them. By using the PRIM, information can be derived about the amino acid positions within poly-peptide chains. Through the introduction of RPRIM, ambiguities in proteins shared by seemingly resembling poly-peptide sequences can be relieved, uncovering further hidden patterns. In RPRIM, there are 400 elements, each having a

Computing frequency vector
Within the primary structure of an amino acid residue, a frequency vector is obtained. The vector is defined as

Computing AAPIV and RAAPIV
AAPIV and RAAPIV are referred to as absolute accumulative position incidence vectors and reverse absolute accumulative position incidence vectors, respectively. This feature extraction model has the capability of extracting all factors related to the protein sequence structure and order. As the frequency vector provides information about the frequency of the presence of each nucleotide base. AAPIV vector can be denoted as


Training machine learning classifiers
All the computed features in previous phases are merged into a feature vector for each data sample. It formulated a feature input matrix of fixed size for any arbitrary sequence irrespective of its length. The matrix formed by combining the feature vector obtained for each sample is further input to the machine learning classifiers for training and further evaluation.
Random forest
Random forest 62 is a supervised learning algorithm that is used for classification and regression. 63 From the name of Random Forest, it represents multiple decision trees that compute their own results. The results from all the trees are collected and based on votes, a random forest makes its own decision for the given data-point. Table 1 shows the hyper-parameters of all the classifiers used in this study.
Details of hyperparameters of machine learning classifiers.
Support vector machines
SVM 64 is a robust, flexible supervised algorithm used for classification. 65 They are the most credible, as well as easy-to-use machine learning methods. They have their rare deployment and are most famous just due to their ability to easily tackle versatile and arranged different functions. For many scopes, they [SVM] are the face of various classes in a hyperplane. The hyperplane would be made in a repetitive knack by SVM so that the chance of error can be lessened. The goal of SVM is to distinguish the data sets into classes to generate a maximum marginal hyperplane.
Decision trees
Decision tree 66 is an ensemble learning method for classification algorithms that belongs to supervised learning algorithms. It can be used for classification and the best regression tasks. 67 It decides the target value by utilizing the features available in the data set. Several metrics are used in decision tree building, such as entropy, information gain, and the Gini index. It is also referred to as a greedy classifier because it attempts to decrease cost at every split. The fundamental working mechanism for decision trees is to predict the target class variable by learning decision rules from the training data.
AdaBoost
The adaptive boosting algorithm was developed by Freund and Schapire. 68 Boosting has many other problems that will be overcome by using Adaboost.
Adaboost classifier takes training part

Adaboost illustration.
K-nearest neighbor
KNN 69 method is used for both classification and regression and a non-parametric classifier. 70 It does not consist of any specific training session; it keeps in touch with the entire data for training during classification. The load needs the value of K meaning the closest data points while it takes training and data sets. K can measure the gap between test data and each racket of training data organized based on distance values, and class them in climbing demand.
Neural network
NN 71 comprises neurons, fixed in layers, that transform an input vector into some outcome. Every neuron carries an input, deploys a function to it, and then hands over the output to the next layer. Networks are defined as feedforward: a unit forages its outcome to entire units on the next layer, but there is no response to the preceding layer. Weights are deployed to the signals passing from one unit to the next, and it is such weightings transformed in the training session to acclimate a NN to the specific issue at hand. An illustration of the NN algorithm can be seen in Figure 5.

Neural network illustration.
XGBoost
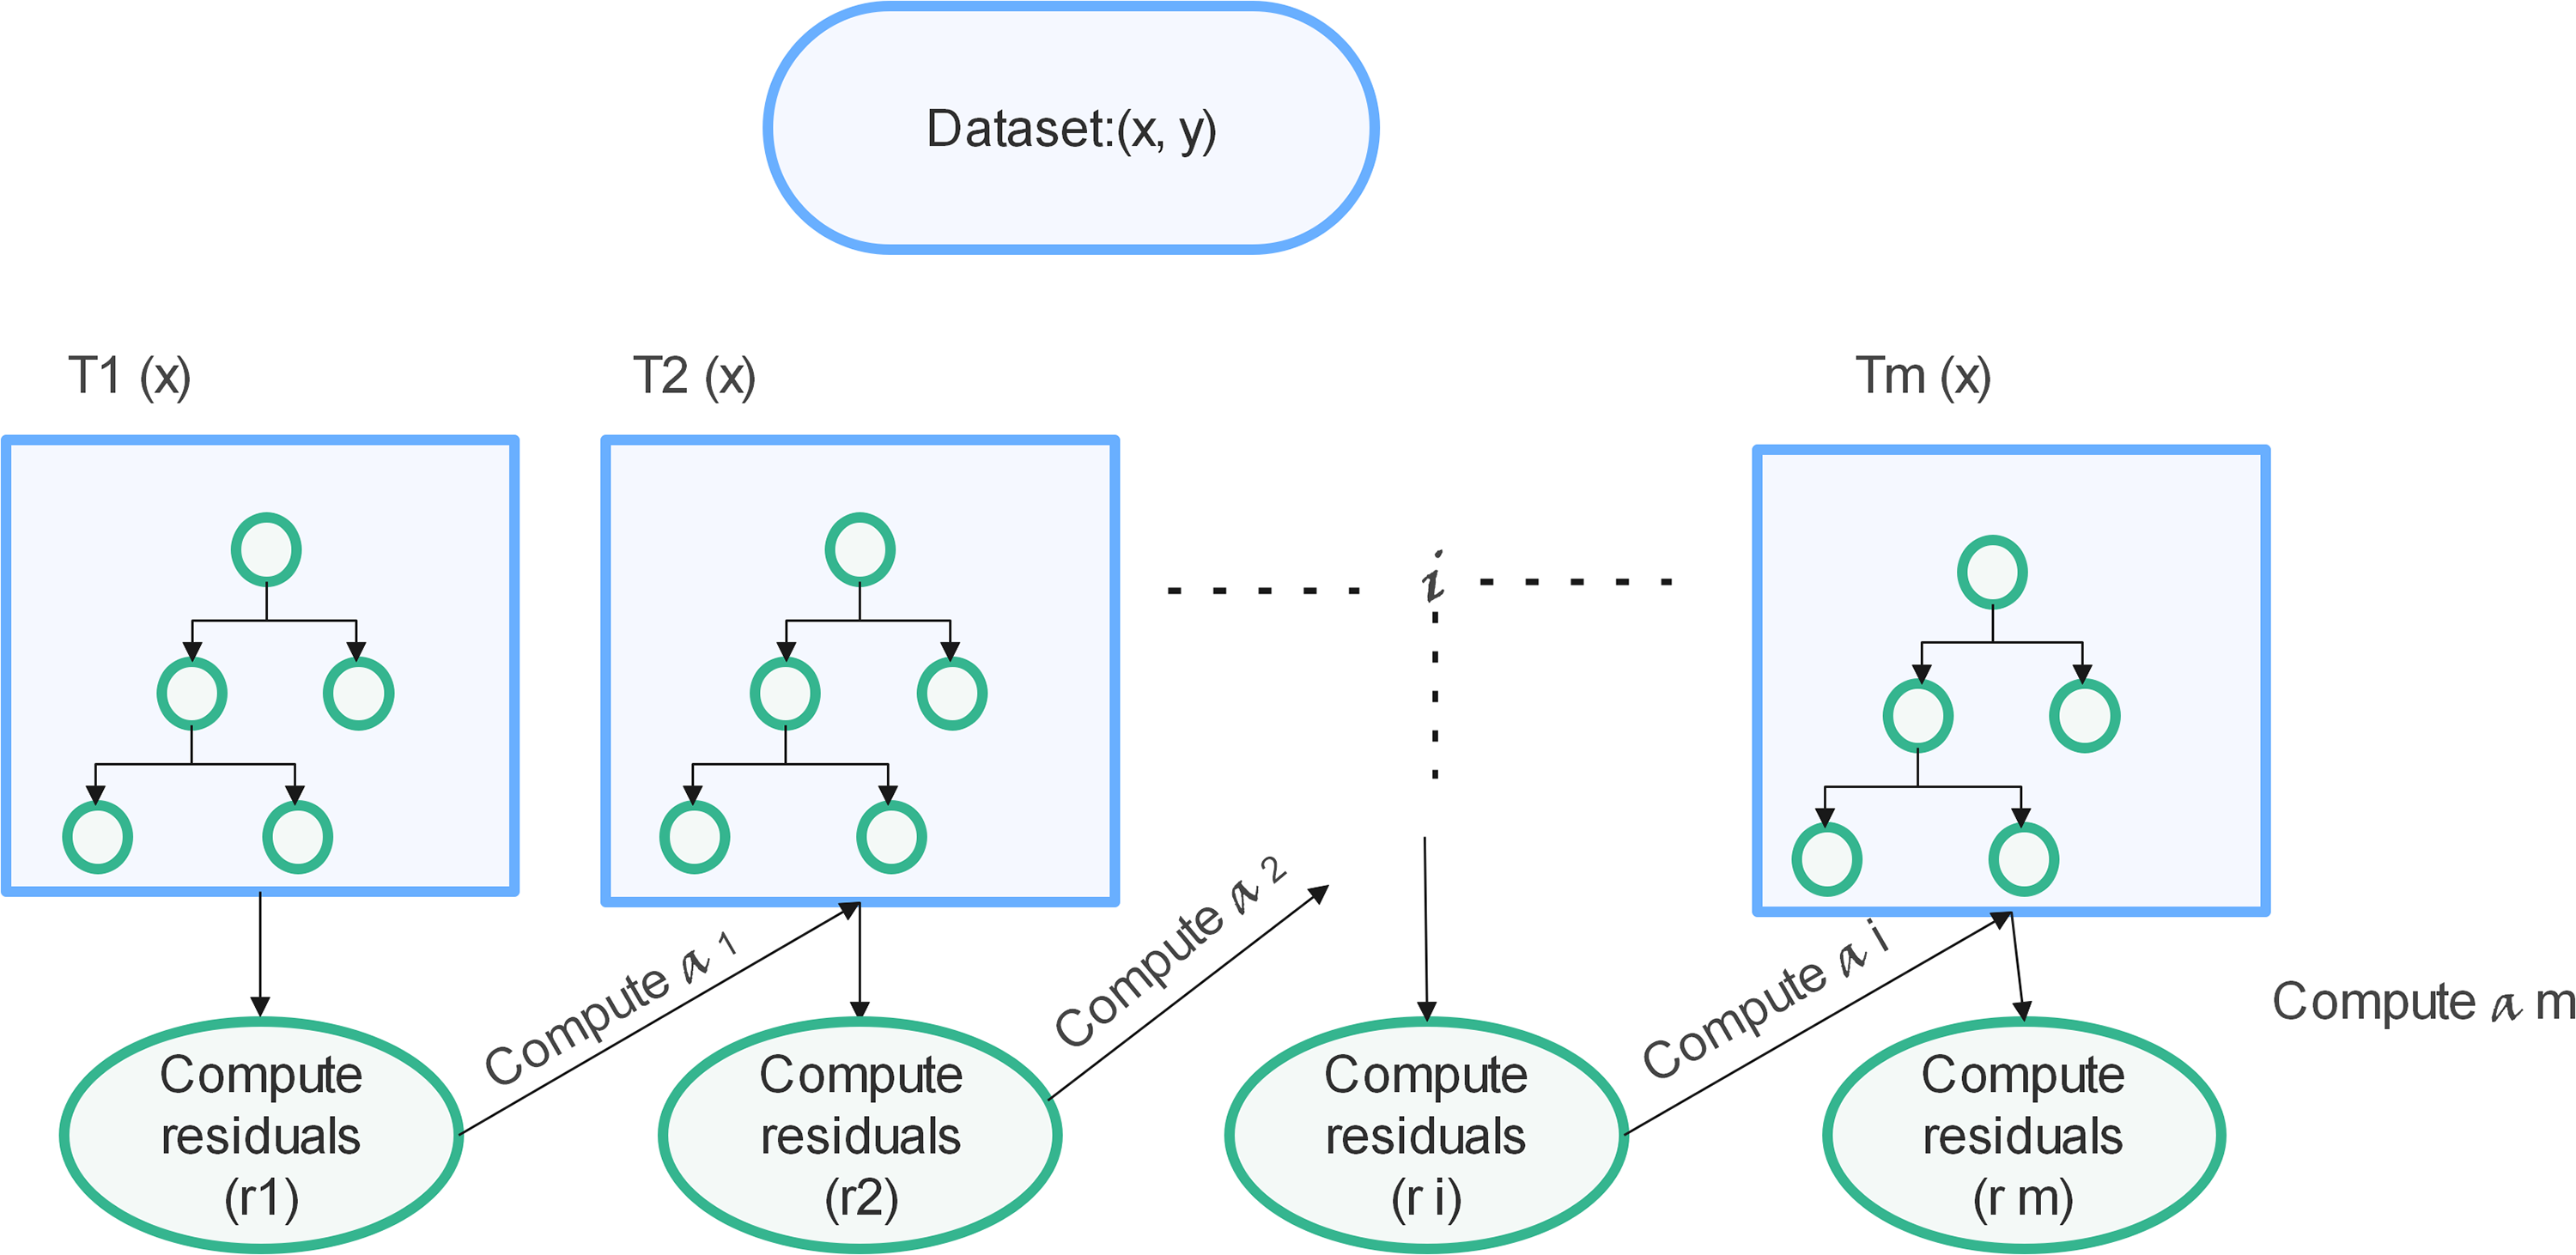
eXtreme Gradient Boosting 72 is an incline enhanced method, that is most famous and resourceful in its operation. It accurately predicts a corresponding variable by combining predictions from weaker samples and models. When used for regression, poor seekers are regression trees, and each regression tree maps an input data point to one of its leaves consisting of a consistent score. A convex loss function (consisting of the deviation between expected and actual outputs) and a model difficulty reduce the associated organized utility function with a penalty term (which from another perspective can be called tree functions regression). Iterative training inputs, including new trees waiting for residuals or outputs from previous trees, are then combined with previous trees to perform the final computation. It is known as Gradient Boost as it implements a downhill method to reduce losses while incorporating the latest algorithms. Figure 3 is a brief illustration of how gradient tree boosting works.
Results
One of the major steps
73
in developing a new prediction technique is how its predicted success rate can be objectively assessed. We look at the following two aspects to fix this:
Which measure should be utilized to reflect the predictor quantitatively quality? What type of test method should be used to measure the result?
Thus, herein, the performance of RF, SVM, KNN, DT, AdaBst, XGBoost, and NN is evaluated using statistical moment-based feature extraction of the hemolytic data set.
Self-consistency test
Self-consistency test is one of the most basic test that is usually used to determine the quality of the predictor in terms of training accuracy. Same data set is for training and testing of classifiers, evaluating the training accuracy.
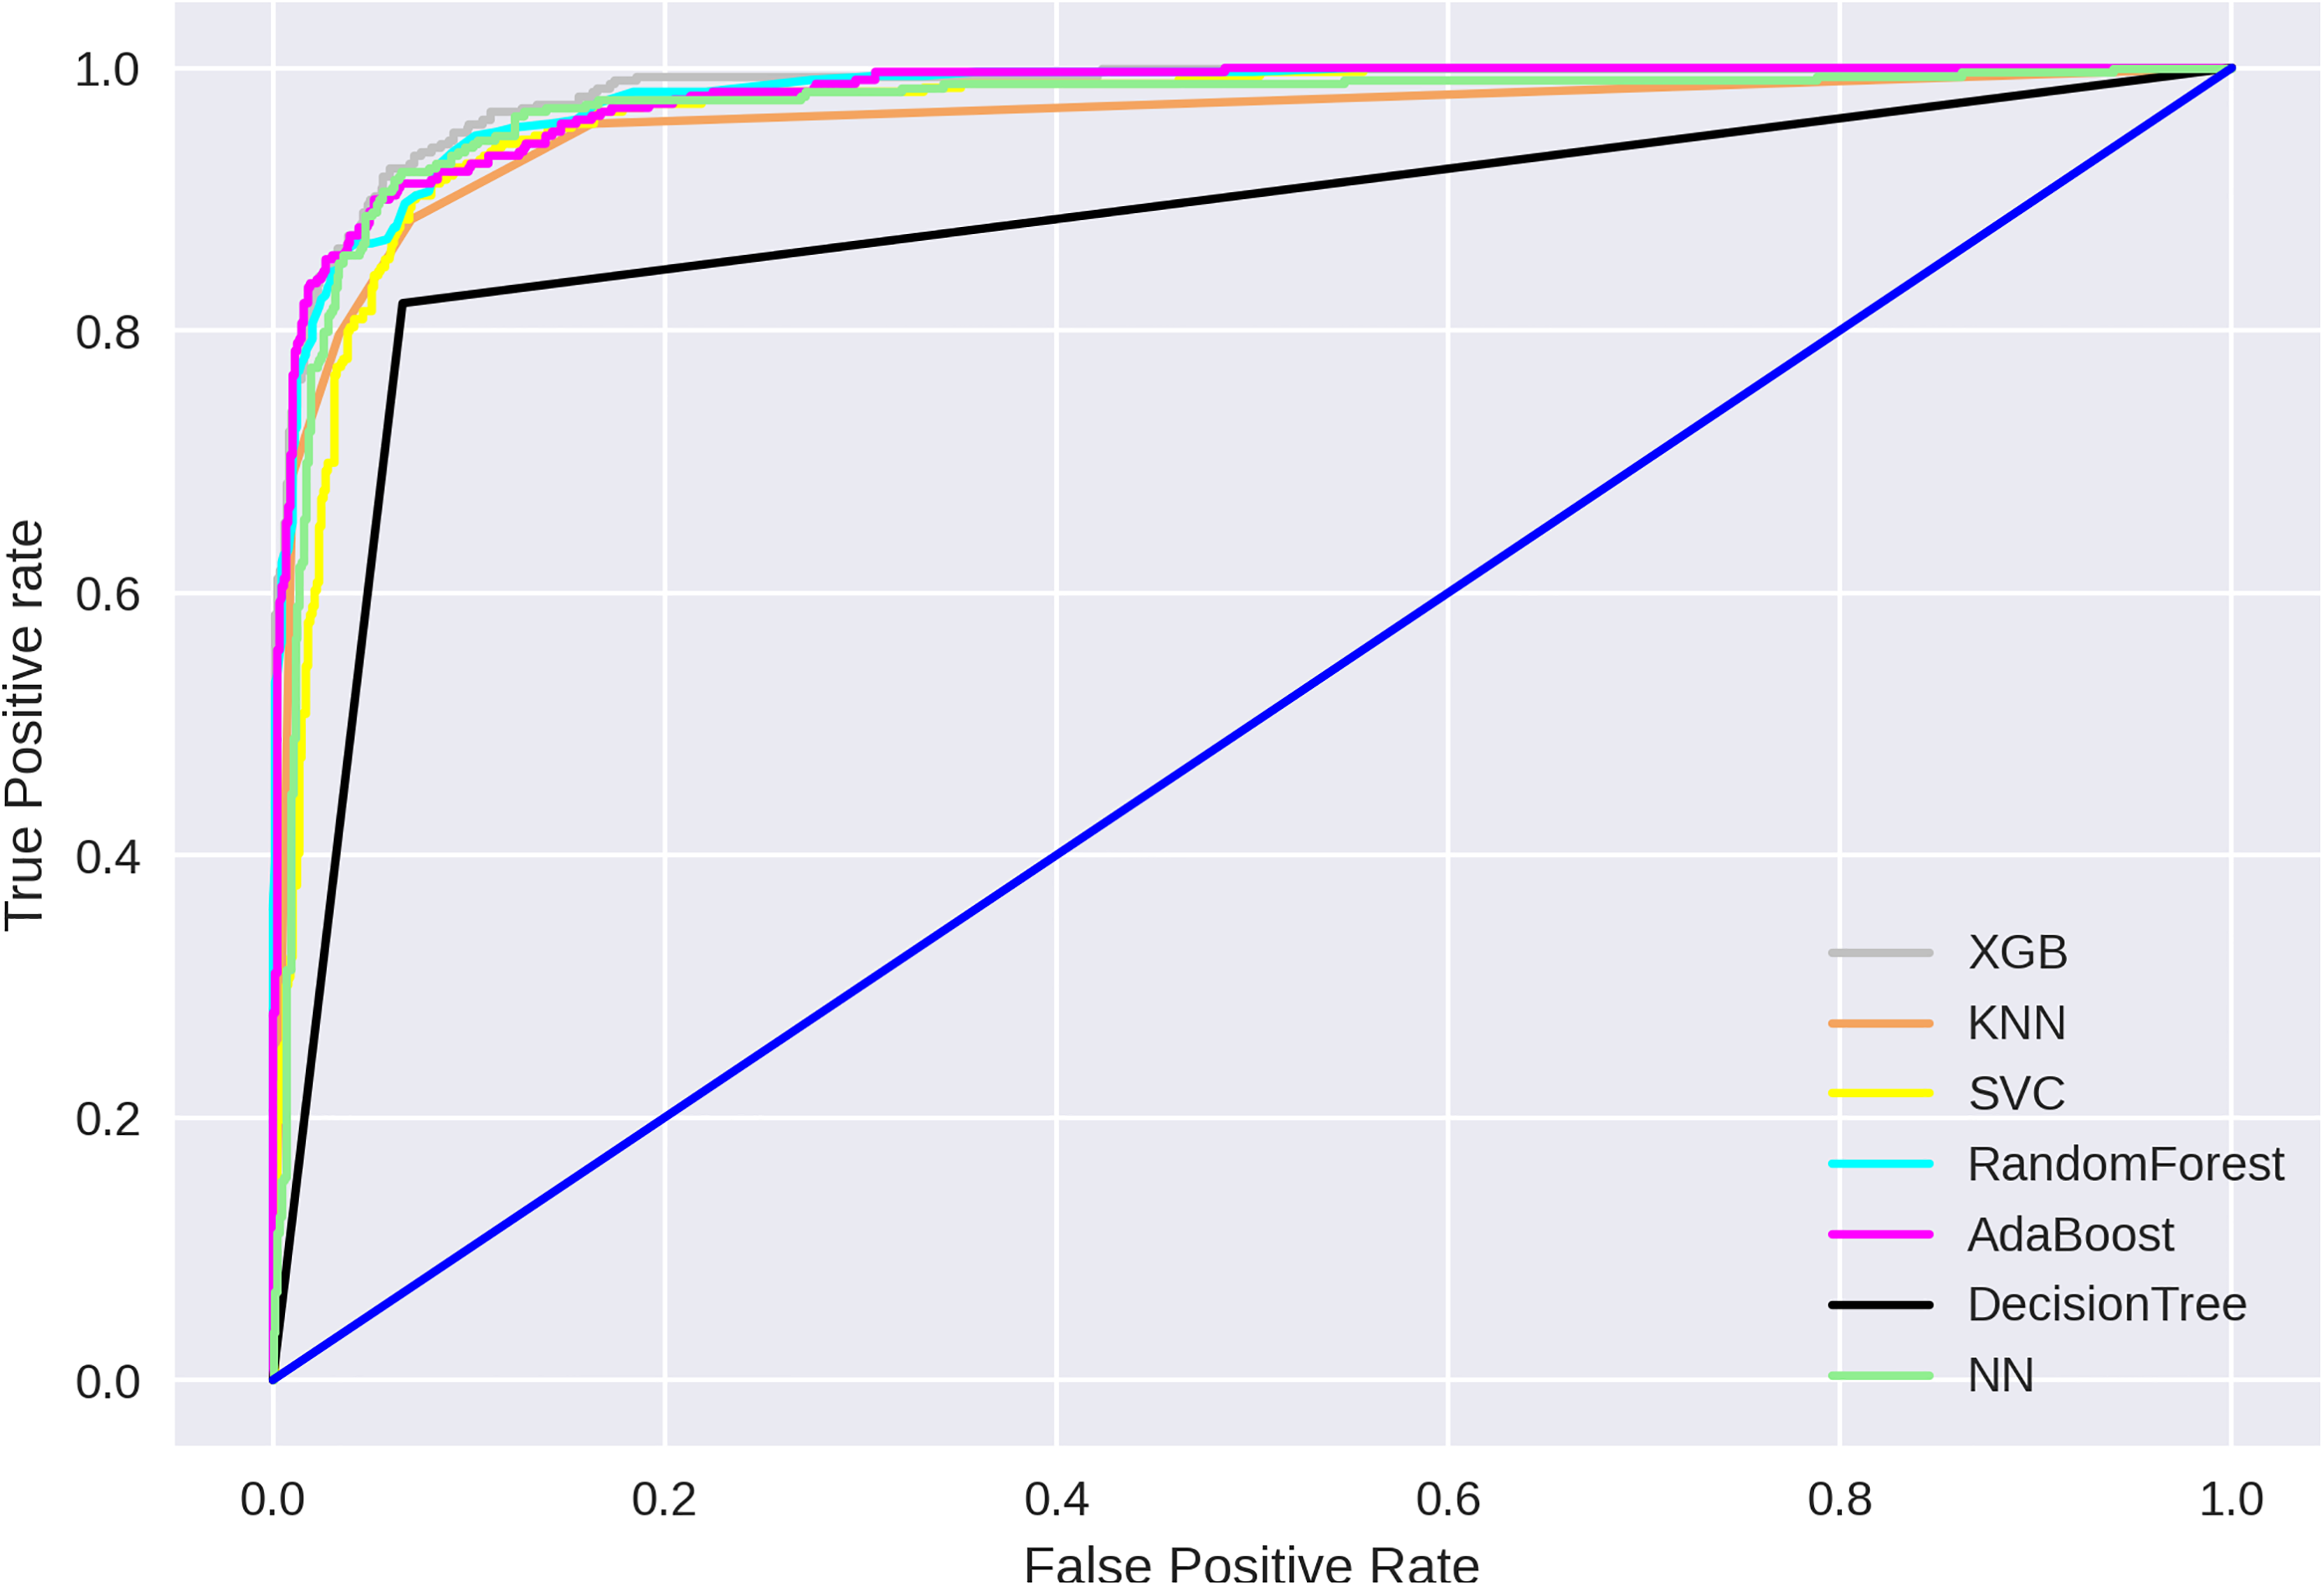
The accurate estimated number of samples for each of the classifiers is used to compute the measured accuracy indicated in Table 2. The time required by each classifier for training is also reported in Figure 6. A comparison of accuracy shown by each predictor displays the classifier receiver operating characteristic (ROC) curve. The performance of the RF and DT predictors is gone good in comparison with other predictors.

Training time for all classifiers.
Comparison of XGBoost with existing classifiers in terms of percentage accuracy on self-consistency.

adabst: AdaBoost; DT: decision tree; kNN: k-nearest neighbours; NN: neural network; RF: random forest; SVM: support vector machine; xgboost: XGBoost; MCC: Matthews correlation coefficient; AUC: area under the curve; ImBD: imbalanced data set; BD: balanced data set. The best accuracy values attained among alll the classifier is highlighted in bold in Table 2.
In Figure 7, the area under the DT and RF predictor is maximum and Figure 7 depicts that the proposed approach (XGBoost) have AUC, that is, 0.99 but RF and DT have 1.0 AUC.

Self-consistency test for all predictors.
Independent test
An Independent test is a standard method of working that is used to measure accuracy. In this strategy, we split the entire data set into two portions. One portion is a large data set used for training, and a small portion of the data set is used for testing.
For this study, we divided the data set into 20% for testing and 80% for training. Accuracy values derived from every predictor shown in Table 3. The test indicates that the XGBoost predictor exceeds the accuracy of other classifiers. The ROC curve in Figure 8 shows the comparison between all machine learning models and great AUC of 0.98 that are xgboost and Adaboost.

Independent test for all predictors.
Comparison of XGBoost with existing classifiers in terms of percentage accuracy on independent test.

adabst: AdaBoost; DT: decision tree; kNN: k-nearest neighbours; NN: neural network; RF: random forest; SVM: support vector machine; xgboost: XGBoost; MCC: Matthews correlation coefficient; AUC: area under the curve; ImBD: imbalanced data set; BD: balanced data set. Most convincing acciracy metric achieved is depicted in bold in Table 3.
k-fold cross-validation
Cross-validation is a most common and well-known approach that is widely used to perform an exhaustive evaluation of a prediction model, as compared to a single independent data set test. Data set is split into k-disjoint folds where training and testing are performed k-times, with
We compared the classifier’s performance, as shown in Table 4 and Figure 9 depicts that the proposed approach have the highest AUC, that is, 0.98.
Receiver operating characteristics (ROCs) for k-fold cross-validation for all predictors.
Comparison of XGBoost with other six classifiers for k-fold cross-validation.

adabst: AdaBoost; DT: decision tree; kNN: k-nearest neighbours; NN: neural network; RF: random forest; SVM: support vector machine; xgboost: XGBoost; MCC: Matthews correlation coefficient; AUC: area under the curve; ImBD: imbalanced data set; BD: balanced data set. Most assiduous results obtained are illustrated in bold in Table 4.
Although cross-validation testing is performed on 10-fold partitioned data. It is still possible that some data is missed throughout the test. The jackknife test is a more demanding test that alleviates this issue.
Jackknife test
Jackknife test is also referred as leave-one-out cross-validation test. In this assessment, data is split into no of data folds

Receiver operating characteristics (ROCs) of jackknife test for all predictors.
Comparison of XGBoost with other six classifiers for jackknife test.
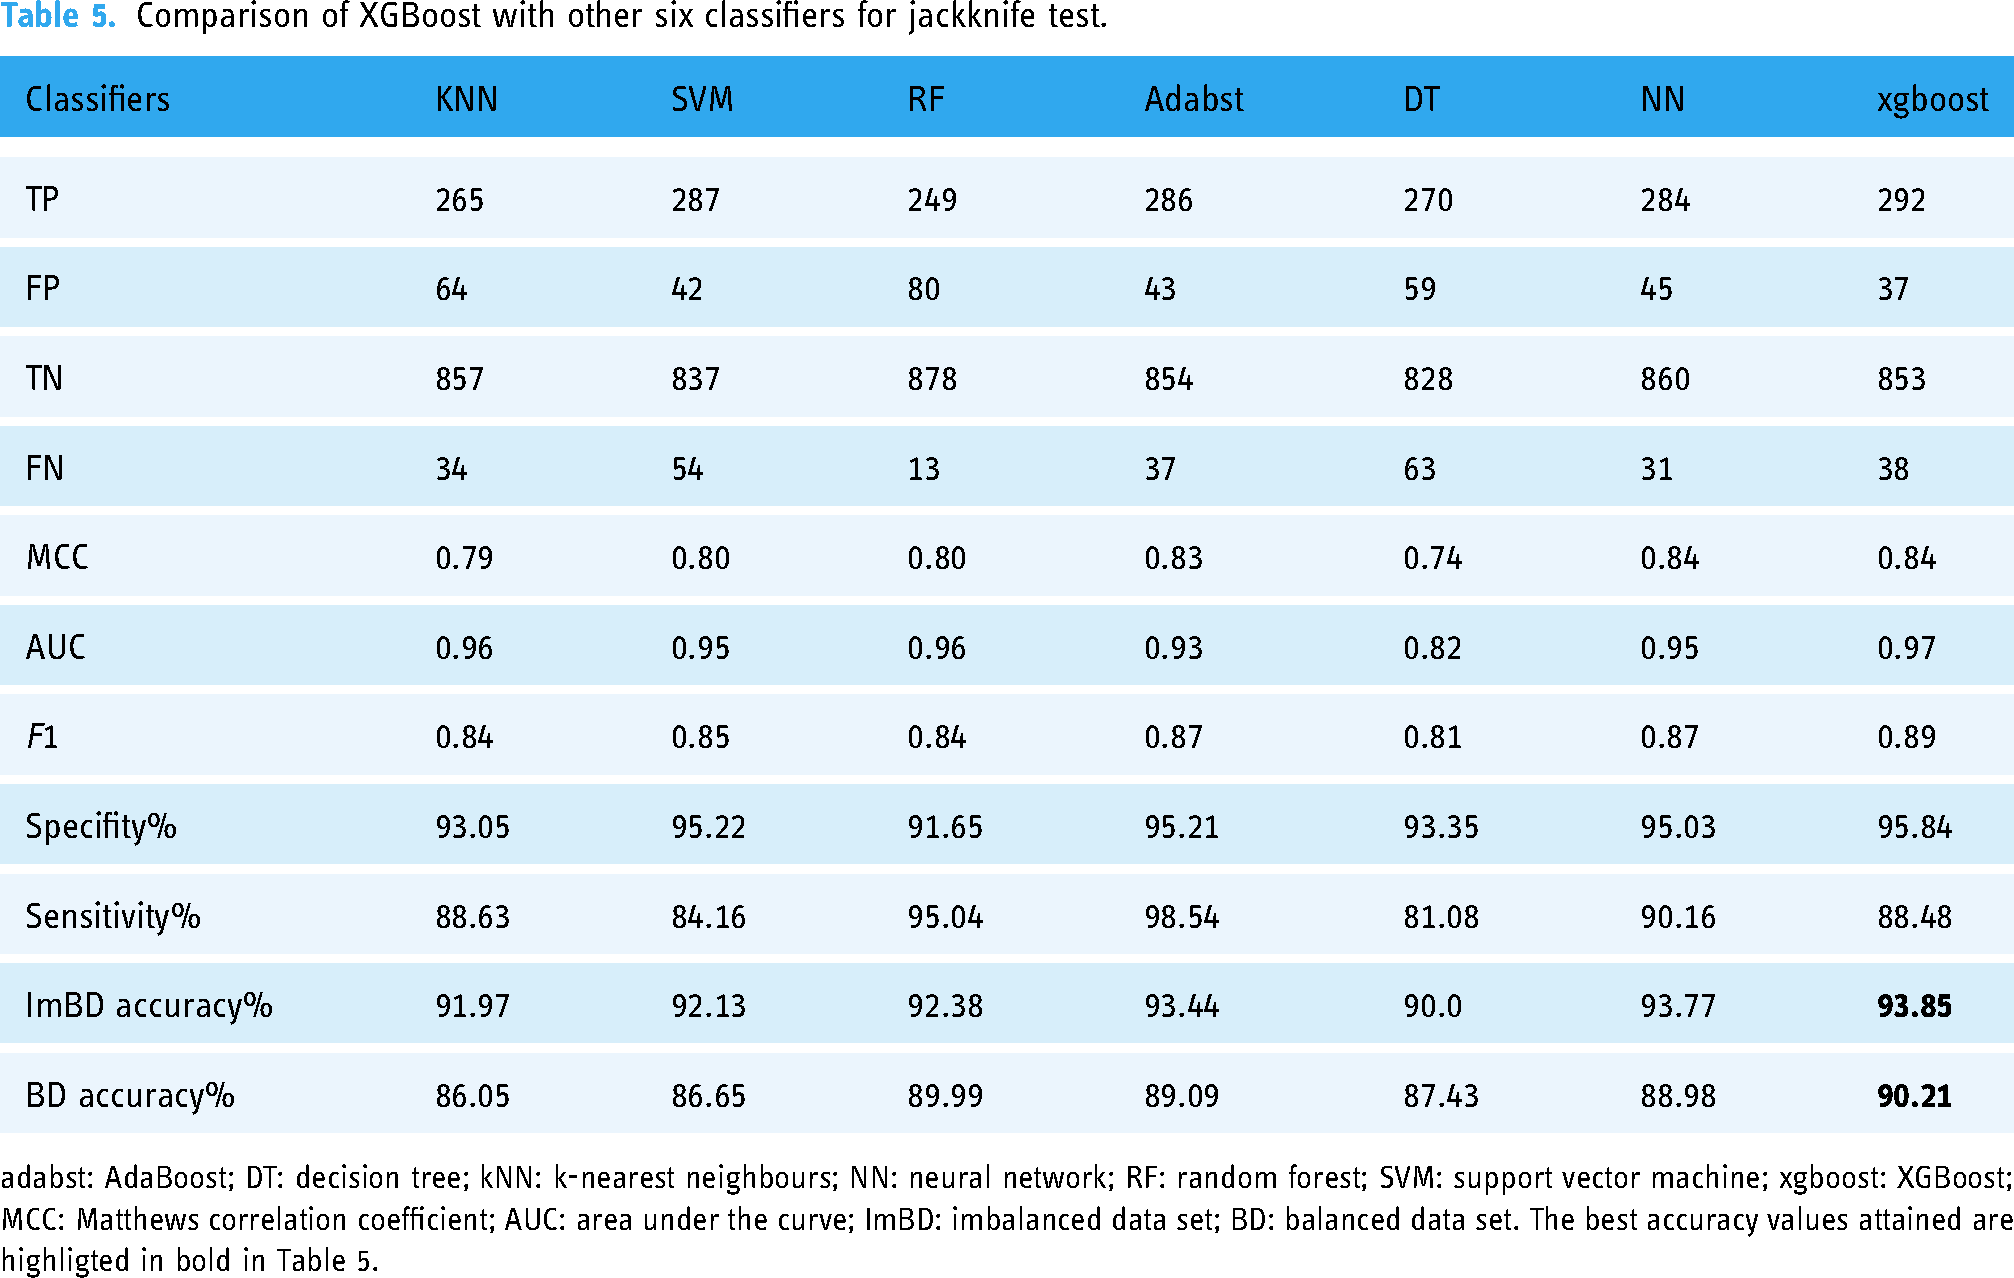
adabst: AdaBoost; DT: decision tree; kNN: k-nearest neighbours; NN: neural network; RF: random forest; SVM: support vector machine; xgboost: XGBoost; MCC: Matthews correlation coefficient; AUC: area under the curve; ImBD: imbalanced data set; BD: balanced data set. The best accuracy values attained are highligted in bold in Table 5.
Discussion
The identification of hemolysis driver proteins is of paramount importance in precision and customized oncology. To this end, bioinformatics tools that can accurately and efficiently evaluate sequencing data are highly sought after. In this study, we proposed and validated a novel in-silico method, Hemolytic-Pred, for identifying HPs based on their sequences using statistical moment-based features, position-relative, and frequency-relative information.
Our approach was systematic and reliable, involving the collection of high-quality data, extraction of significant features, training of machine learning algorithms, and rigorous validation. Among all classifiers, XGBoost consistently outperformed the others, achieving the highest accuracy scores across all evaluation metrics. The ROC curves also showed that the proposed method with the XGBoost model performed better than the other classifiers, with an area under the curve of 0.97.
Based on these findings, we can infer that Hemolytic-Pred with XGBoost classifier is a highly accurate and reliable tool for identifying HPs. This model could significantly benefit precision and customized oncology by enabling the timely diagnosis and treatment of various severe disorders. Future research could further optimize the Hemolytic-Pred method, investigate the underlying mechanisms of hemolysis, and explore potential applications of this approach in other fields.
Performance of Hemolytic-Pred and existing methods
Here in, we have performed a comparative analysis of the proposed method with existing methods available for identifying HPs. The main aim of our study was to outperform the existing methods with higher accuracy, thus, it was necessary to compare our method with the existing ones in terms of overall performance. For Hemolytic-Pred, the evaluation has already been evaluated, thus, to compare the results with previous methods, the results of HLPpred-Fuse, 74 Gradient boosting, 75 HemoPred 25 and HemoPI 24 were employed. Hemolytic-Pred gave 0.89, 0.96, 0.97, 0.94, and 0.98 MCC, ACC, Sn, Sp, and AUC, respectively. In our performance comparison, Hemolytic-Pred was compared with existing models and predictors, HLPpred-Fuse, 74 Gradient boosting, 75 HemoPred, 25 and HemoPI 24 as described in Table 6. In comparison, we observe that Hemolytic-Pred gave the highest scores for ACC, Sp, Sn, MCC, and AUC-ROC, as compared to the existing methods. This infers that the proposed method can be considered as the most accurate and reliable predictor till now. Furthermore, its importance is realized as an in-silico model in comparison with in vitro and in vivo analysis which are typically both time-consuming and expensive, due to the need for laboratory facilities, specialized equipment, and trained personnel. In addition, these types of experiments can also be ethically and legally complex, as they often involve testing on live animals or human subjects. In-silico analysis, on the other hand, uses computer simulations and modeling to study biological processes, making it a more cost-effective and efficient alternative. It also eliminates the need for animal testing and can provide a more controlled and reproducible environment for testing. As a result, in-silico analysis has become a popular tool for researchers to study various biological processes and to help guide their experimental design.
Comparison of Hemolytic-Pred with the state-of-the-art existing methods.

Acc: accuracy; MCC: Matthew’s correlation coefficient; AUC: area under the curve; ROC: receiver operating characteristic.
Webserver
The availability of a scientific method as a tool or webserver is necessary so that the scientists and research community can take benefit from it, as several recent papers have presented.76–88 We developed a web server that is user-friendly and its guidelines are also available. it’s free and can use without any login requirement. that is established on “http://ec2-54-160-229-10.compute-1.amazonaws.com/,” that is, developed using Python 3.7 Flask for an XGBoost. Step-by-step instructions are provided for the use of the website.
Step 1
Users can open the website at http://ec2-54-160-229-10.compute-1.amazonaws.com/ and a menu header will appear that consist of four pages, that is, home, hemolytic protein, server, and sample data. The home page provides an overview of proteins. The hemolytic protein tab leads to information on the hemolytic protein. The server tab is the main page that is the prediction portal and the sample data tab provides some positive and negative FASTA format samples.
Step 2
When the server page load user will notice an empty text box that is also depicted in Figure 11, where the input sequence or multiple sequences that will be in FASTA file be pasted. The submit sequence button will be clicked to obtain results after pasting the sequence. The findings will pop up at the next screen after 0.66 or 1 s shown in Figure 12, which time is dependent on the number of sequences and length of sequences also matter.

Server page.
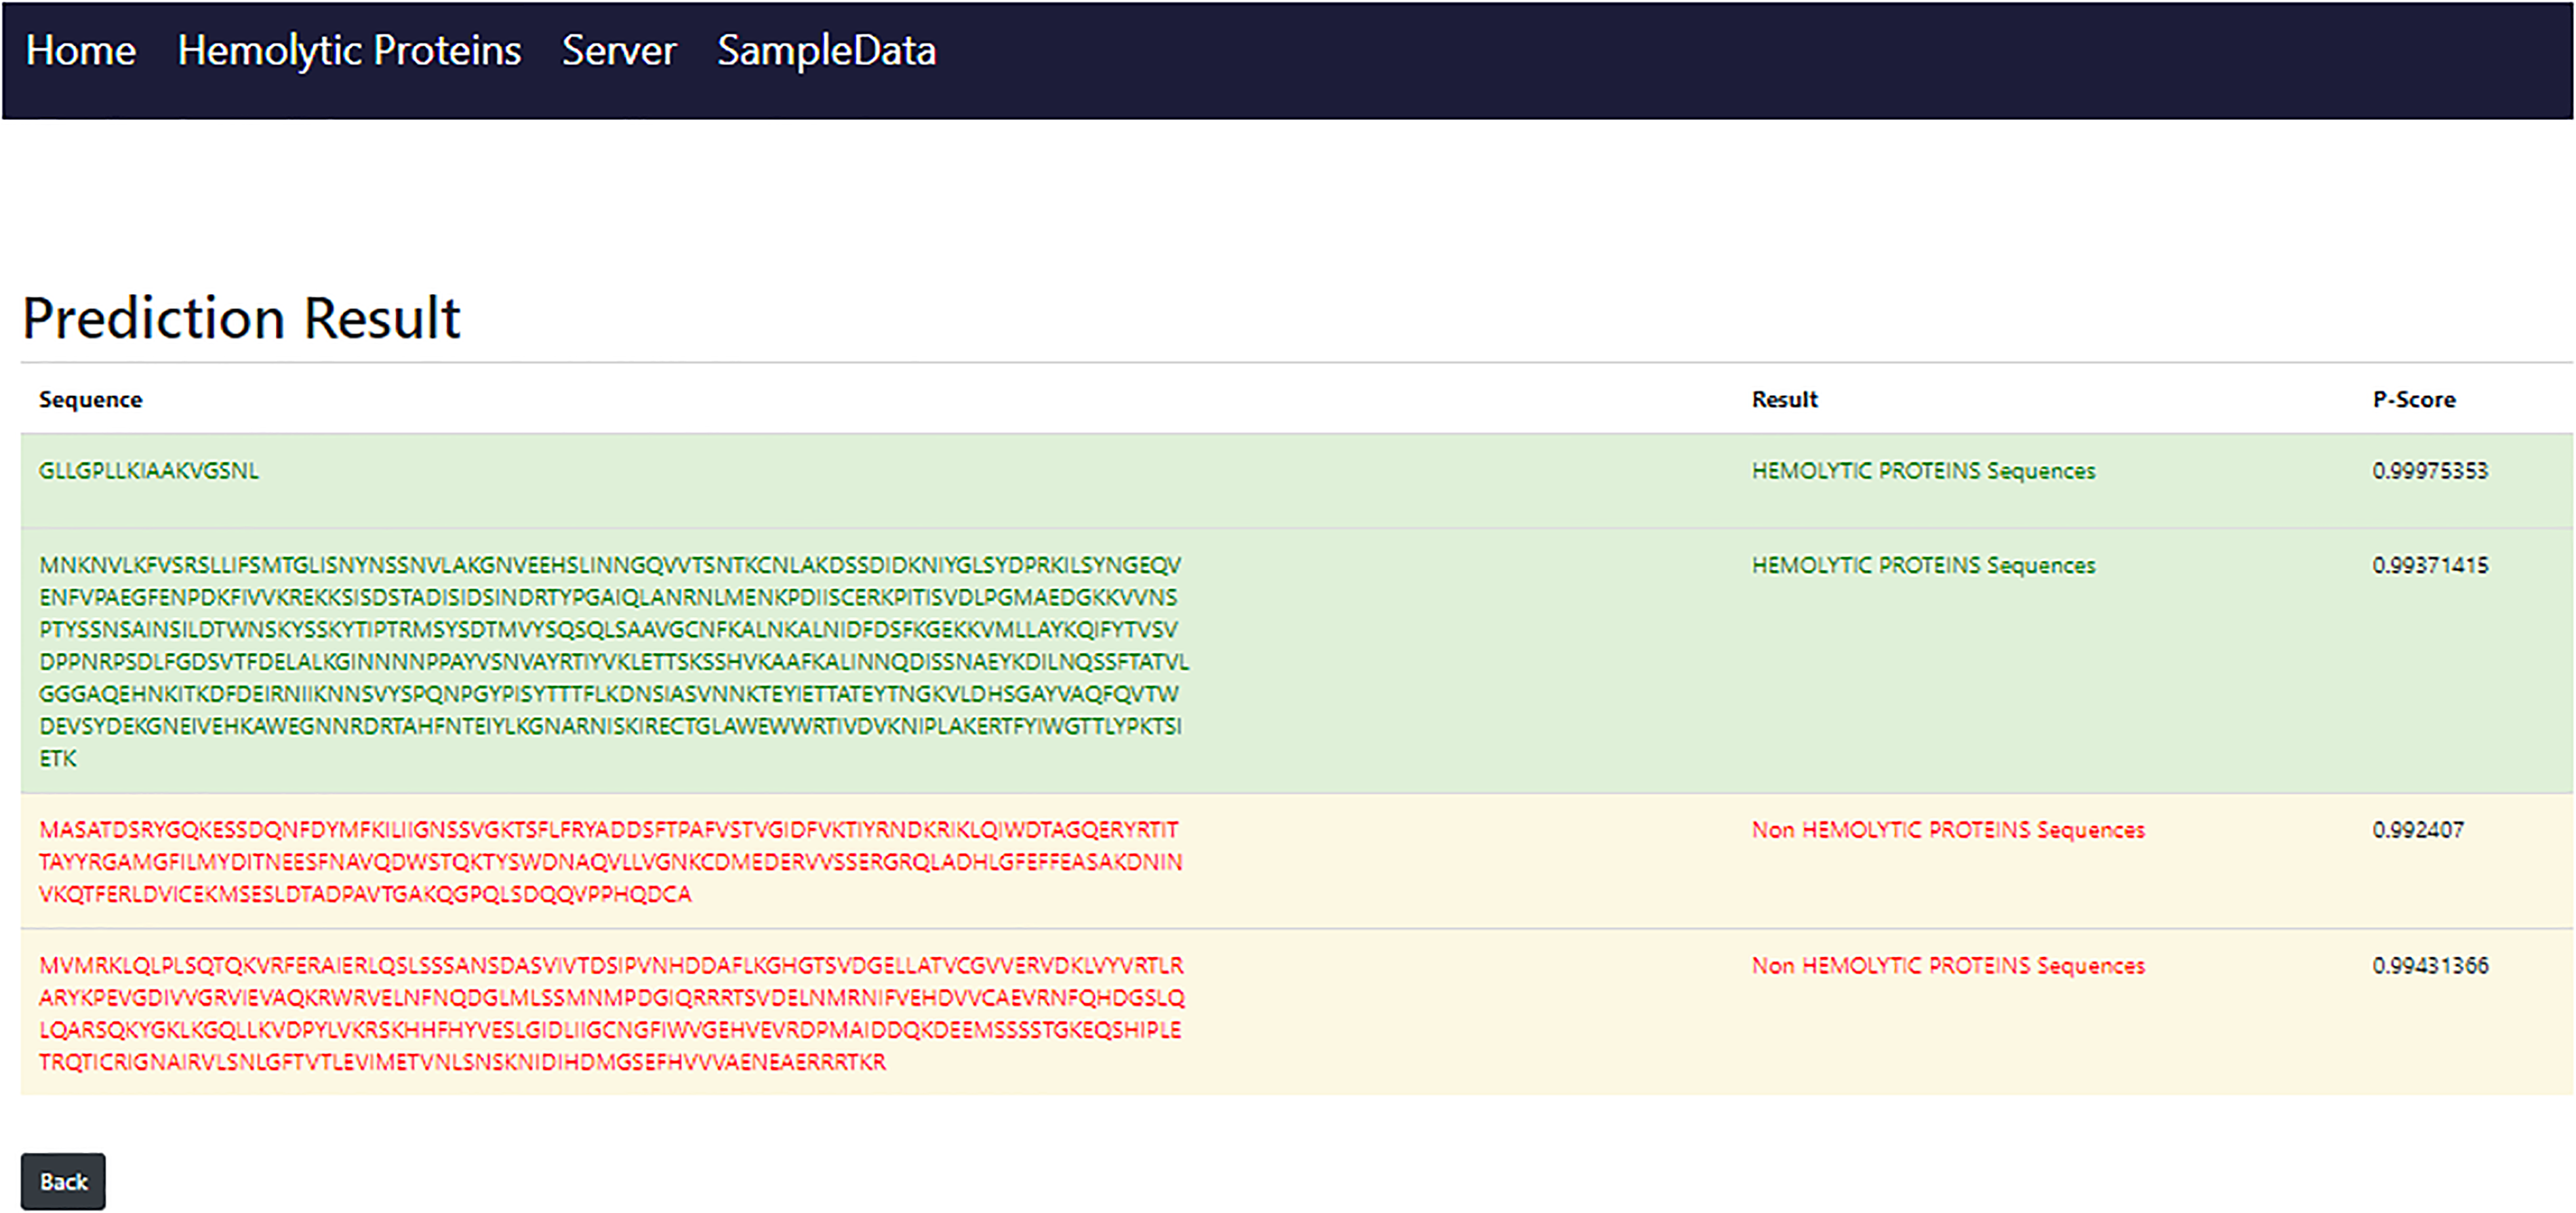
Result page.
Step 3
Click on the sample data tab to find some hemolytic and non-hemolytic sequences for an experiment.
Conclusions and future work
We have proposed a novel tool for the identification of hemolytic proteins as a supplement to experimental approaches. Our model, which extracts features based on statistical moments and position relative features incorporated of proteins and exploits efficient feature selection, was shown to be robust and high performing according to cross-validation and jackknife testing. It is associated with various diseases, mainly tumors, autoimmune, leukemia, sickle cell anemia, lymphoma, and thalassemia. In the present study, out of all the classifiers evaluated, XGBoost outperformed others, giving the most accurate results for the prediction of the HP. The system’s overall accuracy on the jackknife testing is 93.85%, sensitivity value is 91.6%, and specificity is 95.03%. It is concluded that the proposed model has the capability of more improvement in the computational result. XG-Boost is an iterative learning method where the model self-analyzes its mistakes and gives more weightage to misclassified data points in the next iteration, making it a reliable model. XGBoost uses a similarity score to prune trees and prevent overfitting. It is a better option for unbalanced data sets and more efficient in optimizing hyperparameters compared to Random Forest and other classifiers.XGBoost is a more preferable choice in situations like Poisson regression and rank regression.
As the biological sequence data increases day-by-day at high speed in a different type of database like the Swiss Prot database, in the future, the space to improve efficiency in this field still exists due to the increasing number of data sets. A number of diseases are associated with HPs, including sickle cell anemia, glucose-6-phosphate dehydrogenase (G6PD) deficiency, hemolytic uremic syndrome, thalassemia, autoimmune hemolytic anemia, pyruvate kinase deficiency, spherocytosis, G6PD deficiency, and paroxysmal nocturnal hemoglobinuria. In order to treat or cure the aforementioned diseases, scientists would need to determine whether a protein is hemolytic or non-hemolytic. The researcher could benefit from our reliable and accurate model in this case. Using this model, it might be possible to design and discover drugs for the diseases listed above.
Supplemental Material
sj-fasta-1-dhj-10.1177_20552076231180739 - Supplemental material for Hemolytic-Pred: A machine learning-based predictor for hemolytic proteins using position and composition-based features
Supplemental material, sj-fasta-1-dhj-10.1177_20552076231180739 for Hemolytic-Pred: A machine learning-based predictor for hemolytic proteins using position and composition-based features by Gulnaz Perveen, Fahad Alturise, Tamim Alkhalifah, and Yaser Daanial Khan in DIGITAL HEALTH
Supplemental Material
sj-fasta-2-dhj-10.1177_20552076231180739 - Supplemental material for Hemolytic-Pred: A machine learning-based predictor for hemolytic proteins using position and composition-based features
Supplemental material, sj-fasta-2-dhj-10.1177_20552076231180739 for Hemolytic-Pred: A machine learning-based predictor for hemolytic proteins using position and composition-based features by Gulnaz Perveen, Fahad Alturise, Tamim Alkhalifah, and Yaser Daanial Khan in DIGITAL HEALTH
Footnotes
Acknowledgements
Researchers would like to thank the Deanship of Scientific Research, Qassim University for funding the publication of this project.
Contributorship
GP conducted experimentation and validation, FA contributed in data collection, analysis and write up, TA was responsible for conceptualization and implementation, YDK supervised the work.
Declaration of conflicting interests
The author(s) declared no potential conflicts of interest with respect to the research, authorship, and/or publication of this article.
Ethical approval
The study did not involve any human or animal tests, further, no ethical approvals were required.
Funding
The author(s) received no financial support for the research, authorship, and/or publication of this article.
Guarantor
The submitting author FA is the guarantor of the article.
Supplemental material
Supplemental material for this article is available online. All data generated or analyzed during this study are included in this published article (and its Supplemental Material File S1.
References
Supplementary Material
Please find the following supplemental material available below.
For Open Access articles published under a Creative Commons License, all supplemental material carries the same license as the article it is associated with.
For non-Open Access articles published, all supplemental material carries a non-exclusive license, and permission requests for re-use of supplemental material or any part of supplemental material shall be sent directly to the copyright owner as specified in the copyright notice associated with the article.