
Abstract
Background
Diagnosis of pancreatic ductal adenocarcinoma (PDAC) is difficult due to the lack of specific symptoms and screening methods. Only less than 10% of PDAC patients are candidates for surgery at the time of diagnosis. Thus, there is a great global unmet need for valuable biomarkers that could improve the opportunity to detect PDAC at the resectable stage. This study aimed to develop a potential biomarker model for the detection of resectable PDAC by tissue and serum metabolomics.
Methods
Ultra-high-performance liquid chromatography and quadrupole time-of-flight mass spectrometry (UHPLC-QTOF-MS/MS) was performed for metabolome quantification in 98 serum samples (49 PDAC patients and 49 healthy controls (HCs)) and 20 pairs of matched pancreatic cancer tissues (PCTs) and adjacent noncancerous tissues (ANTs) from PDAC patients. Univariate and multivariate analyses were used to profile the differential metabolites between PDAC and HC.
Results
A total of 12 differential metabolites were present in both serum and tissue samples of PDAC. Among them, a total of eight differential metabolites showed the same expressional levels, including four upregulated and four downregulated metabolites. Finally, a panel of three metabolites including 16-hydroxypalmitic acid, phenylalanine, and norleucine was constructed by logistic regression analysis. Notably, the panel was capable of distinguishing resectable PDAC from HC with an AUC value of 0.942. Additionally, a multimarker model based on the 3-metabolites-based panel and CA19-9 showed a better performance than the metabolites panel or CA19-9 alone (AUC: 0.968 vs. 0.942, 0.850).
Conclusions
Taken together, the resectable early-stage PDAC has unique metabolic features in serum and tissue samples. The defined panel of three metabolites has the potential value for early screening of PDAC at the resectable stage.
Introduction
Pancreatic ductal adenocarcinoma (PDAC) is a highly lethal gastrointestinal cancer and is projected to be the second leading cause of global cancer death by 2030.1–3 At present, surgical resection is the only curative therapy for PDAC, which could improve the 5-year survival rate from 10% to 25% or more. 4 In the clinic, due to the high metastasis rate and lack of specific symptoms, less than 10% of PDAC is surgically resectable at the time of diagnosis. 5 Therefore, the survival rate of PDAC patients would increase if the disease could be diagnosed at the resectable stage. Currently, serum carbohydrate antigen 19-9 (CA19-9) is the only biomarker approved by the Food and Drug Administration for monitoring response to therapeutic treatment and recurrence. 6 But it is not recommended as a biomarker to efficiently diagnose PDAC due to its low sensitivity and specificity. In addition, CA19-9 can be also elevated in patients with biliary obstruction, chronic pancreatitis, and some precancerous lesions of the pancreas. 7 Hence, the identification of more accurate biomarkers for early detection of PDAC at the resectable stage is urgently needed.
PDAC develops in a harsh microenvironment that lacks nutrients and oxygen. To satisfy enough energetic and biosynthetic demands in this environment, the metabolism in cancer cells will be programmed driven by the Kras mutations. 8 Due to signal amplification in the direction of genome-proteome-metabolome, unique metabolites are closely related to the phenotype and allow more precise and earlier diagnosis of PDAC. 9 Metabolomics, which can profile the dynamic metabolic statuses of the living system, has been applied as a powerful tool for biomarker discovery in PDAC and other cancers. 10 Tissue metabolomics is the most powerful method for providing explicit metabolic alterations about the mechanisms of disease. 11 Due to the difficulty in pancreatic cancer tissues (PCTs) collection, a few studies focused on the alterations of tissue metabolic features in PDAC. Currently, metabolomics analysis of PDAC has been performed on many different biofluid samples such as serum, plasma, and urine, which are easily available and noninvasive. 9 However, the application of metabolomics in PDAC research is still in its infancy, and few studies have focused on resectable PDAC.
The primary aim of this study was to identify the potential differential metabolites based on the serum and tissue samples to distinguish resectable PDAC from healthy controls (HC), and further constructed a metabolite-based panel. To accomplish these objects, we employed an untargeted technique, ultra-high-performance liquid chromatography and quadrupole time-of-flight mass spectrometry (UHPLC-QTOF-MS/MS), to analyze the altered metabolites between resectable PDAC and HC. A total of 98 serum samples were assessed in combination with 20 paired matched PCTs and adjacent noncancerous tissues (ANTs). Screening the mechanism-associated serum biomarkers that could achieve an early diagnosis of PDAC at the resectable stage is of utmost importance for improving the 5-year survival rate of PDAC patients.
Methods
Study design and patients
In this study, a total of 49 patients with resectable PDAC were enrolled from the Affiliated Hospital of Nanjing University of Chinese Medicine and the First Affiliated Hospital of Nanjing Medical University between July 2019 and July 2020. Additional 49 sex- and age-matched HCs were enrolled from the physical examination center in the two hospitals. The clinical data, pathological features, and laboratory test values of all patients or HCs were collected. The PDAC stage was determined by the eighth edition of the American Joint Committee on Cancer Tumor-Lymph Node Metastasis staging system.
12
The inclusion criteria were as follows:
PDAC patients had received radical resection without metastasis and confirmed by surgical pathology; (2) HC had no history of any type of cancer and hepatopancreaticobiliary disease. The exclusion criteria were as follows: (1) PDAC patients had a recurrence of the tumor or the history of other cancers; (2) PDAC patients had radiation treatments and chemotherapy before enrollments. Written informed consent was obtained from each participant, and this protocol was approved by the Ethics Committee of the two hospitals. All procedures of this study followed the principles of the Declaration of Helsinki.
Sample preparation
The fasting blood samples of 49 patients with PDAC and 49 healthy volunteers were obtained between 8 a.m. and 9 a.m., before the initiation of any treatment. Each PDAC patient and healthy volunteer provided 5 ml of blood. Blood samples were stored at room temperature for 2 hours and centrifuged at 4°C for 10 minutes at 3000 r/min for 10 minutes. Then the supernatant was aspirated and stored at −80°C for later use. After thawing, 100 µl of samples were added to 400 µl protein precipitant and 10 µl internal standard solution. The mixture was vortexed for 30 seconds and centrifuged at 4°C for 15 min at 14,000 r/min. The supernatant of samples was transferred into new tubes and vacuum dried at 4°C for analysis.
Twenty paired PCTs and ANTs were collected from 20 patients diagnosed with PDAC. After resection, tissue samples were directly stored in liquid nitrogen, and then stored at −80° for later use. A piece of the tissue (50 mg) was mixed with 600 µl of prechilled methanol/water (8:2, v/v) solvent and homogenized using a bead beater. Subsequently, the samples were centrifuged at 14,000 g for 20 min at 4°C. The supernatant of samples was transferred into new tubes and vacuum dried at 4°C for analysis.
To evaluate the data quality and instrument stability, quality control (QC) samples were prepared by mixing an equal volume of each serum or tissue sample and inserted in each set of the run sequences. The pretreatment of the QC samples paralleled with the study samples.
HPLC-Q-TOF-MS metabolomics analysis
Metabolic profiling of serum and tissue samples based on untargeted analysis was performed on the liquid chromatography platform (1290 Infinity LC, Agilent Technologies) coupled to the quadrupole time-of-flight mass spectrometry (TripleTOF 5600). An ACQUIY UPLC BEH column (100 mm × 2.1 mm, 1.7 µm, Water) was used to separate the samples. Mobile phase A was 25 mM ammonium acetate and 25 mM ammonium hydroxide in water, and mobile phase B was acetonitrile. The gradient program was 85% B for 0–1.0 minutes, 85∼65% B for 1.0∼12.0 minutes, 65%∼40% B for 12.0∼12.1 minutes, 40% B for 12.1∼15.0 minutes, 40%∼85% B for 15.0∼15.1 minutes, and 85% B for 15.1∼20.0 minutes. The flow rate was maintained at 0.30 ml/min, and all the samples were kept at 4°C during analysis. The data were collected under the positive and negative ion modes of mass spectrometry. The scan range of the mass spectrum was 50–1000 m/z. In ESI positive mode, the ion spray voltage was 5500V, and the capillary temperature was 10, 20, or 40V; In ESI negative ion mode, the ion spray voltage was −4500V, and the capillary temperature was −10, −20, or −40V.
Statistical analysis
XCMS procedure was performed to pre-process the raw data, including peak extraction, peak matching, retention time correction, filtering missing values, and area normalization (R package “DMwR”). In detail, prior to the multivariate statistical analysis, all obtained data were transformed by log10 and then scaled by Pareto scaled to correct for heteroscedasticity and reduce the skewness of the data. Then the SIMCA-P software was used for multivariate statistical analysis to determine the differences in metabolic profile between PDAC and HC, including principal component analysis (PCA) and orthogonal partial least-squares discriminant analysis (OPLS-DA). The quality of the model was tested by the values of R2Y and Q2. When R2Y and Q2 value ≥ 0.4, OPLS-DA model was considered as valid empirically.13,14 The risk of overfitting for the model was tested by 200 times permutation test. When Q2 intercept values < 0.05 or 0, it means that the model is not overfitting, and the model is reliable. The differential metabolites with variable importance in the projection (VIP) > 1 represented that they had greater significance for the OPLS-DA model. The univariate analysis was also performed. P-value < .05 was considered statically significant. False discovery rates (FDRs) were calculated using the Benjamini and Hochberg method. Based on the Spearman correlation and cluster analysis, heatmaps were drawn by the MetaboAnalyst website. To evaluate the diagnostic performance of the individual metabolite and the regression model, the receiver operating characteristic (ROC) curve analysis was performed with Graphpad Prism software (Version 9.0.0, CA, USA) and logistic regression analysis was performed with SPSS software (Version 26.0, IBM SPSS Inc., Armonk, NY, USA). The study design and data analysis workflow were illustrated in Figure S1.
Results
Characteristics of the study population
A total of 98 individuals (49 PDAC patients and 49 HC) were enrolled in this study, including 98 serum samples and 20 paired samples with PCTs and ANTs. In the serum set, the age and gender were matched between resectable PDAC patients and HC. The clinical characteristic of the cohorts was shown in Table 1. Compared with HC cohort, a significant increase in levels of CA19-9 was found in PDAC cohort (16.83 ± 10.36 U/ml vs. 123.75 ± 202.38 U/ml, p < .05). In the tissue set, 20 paired samples were collected from 20 resectable PDAC patients (including 13 males and seven females).
Baseline characteristics of all subjects enrolled in serum and tissue set.
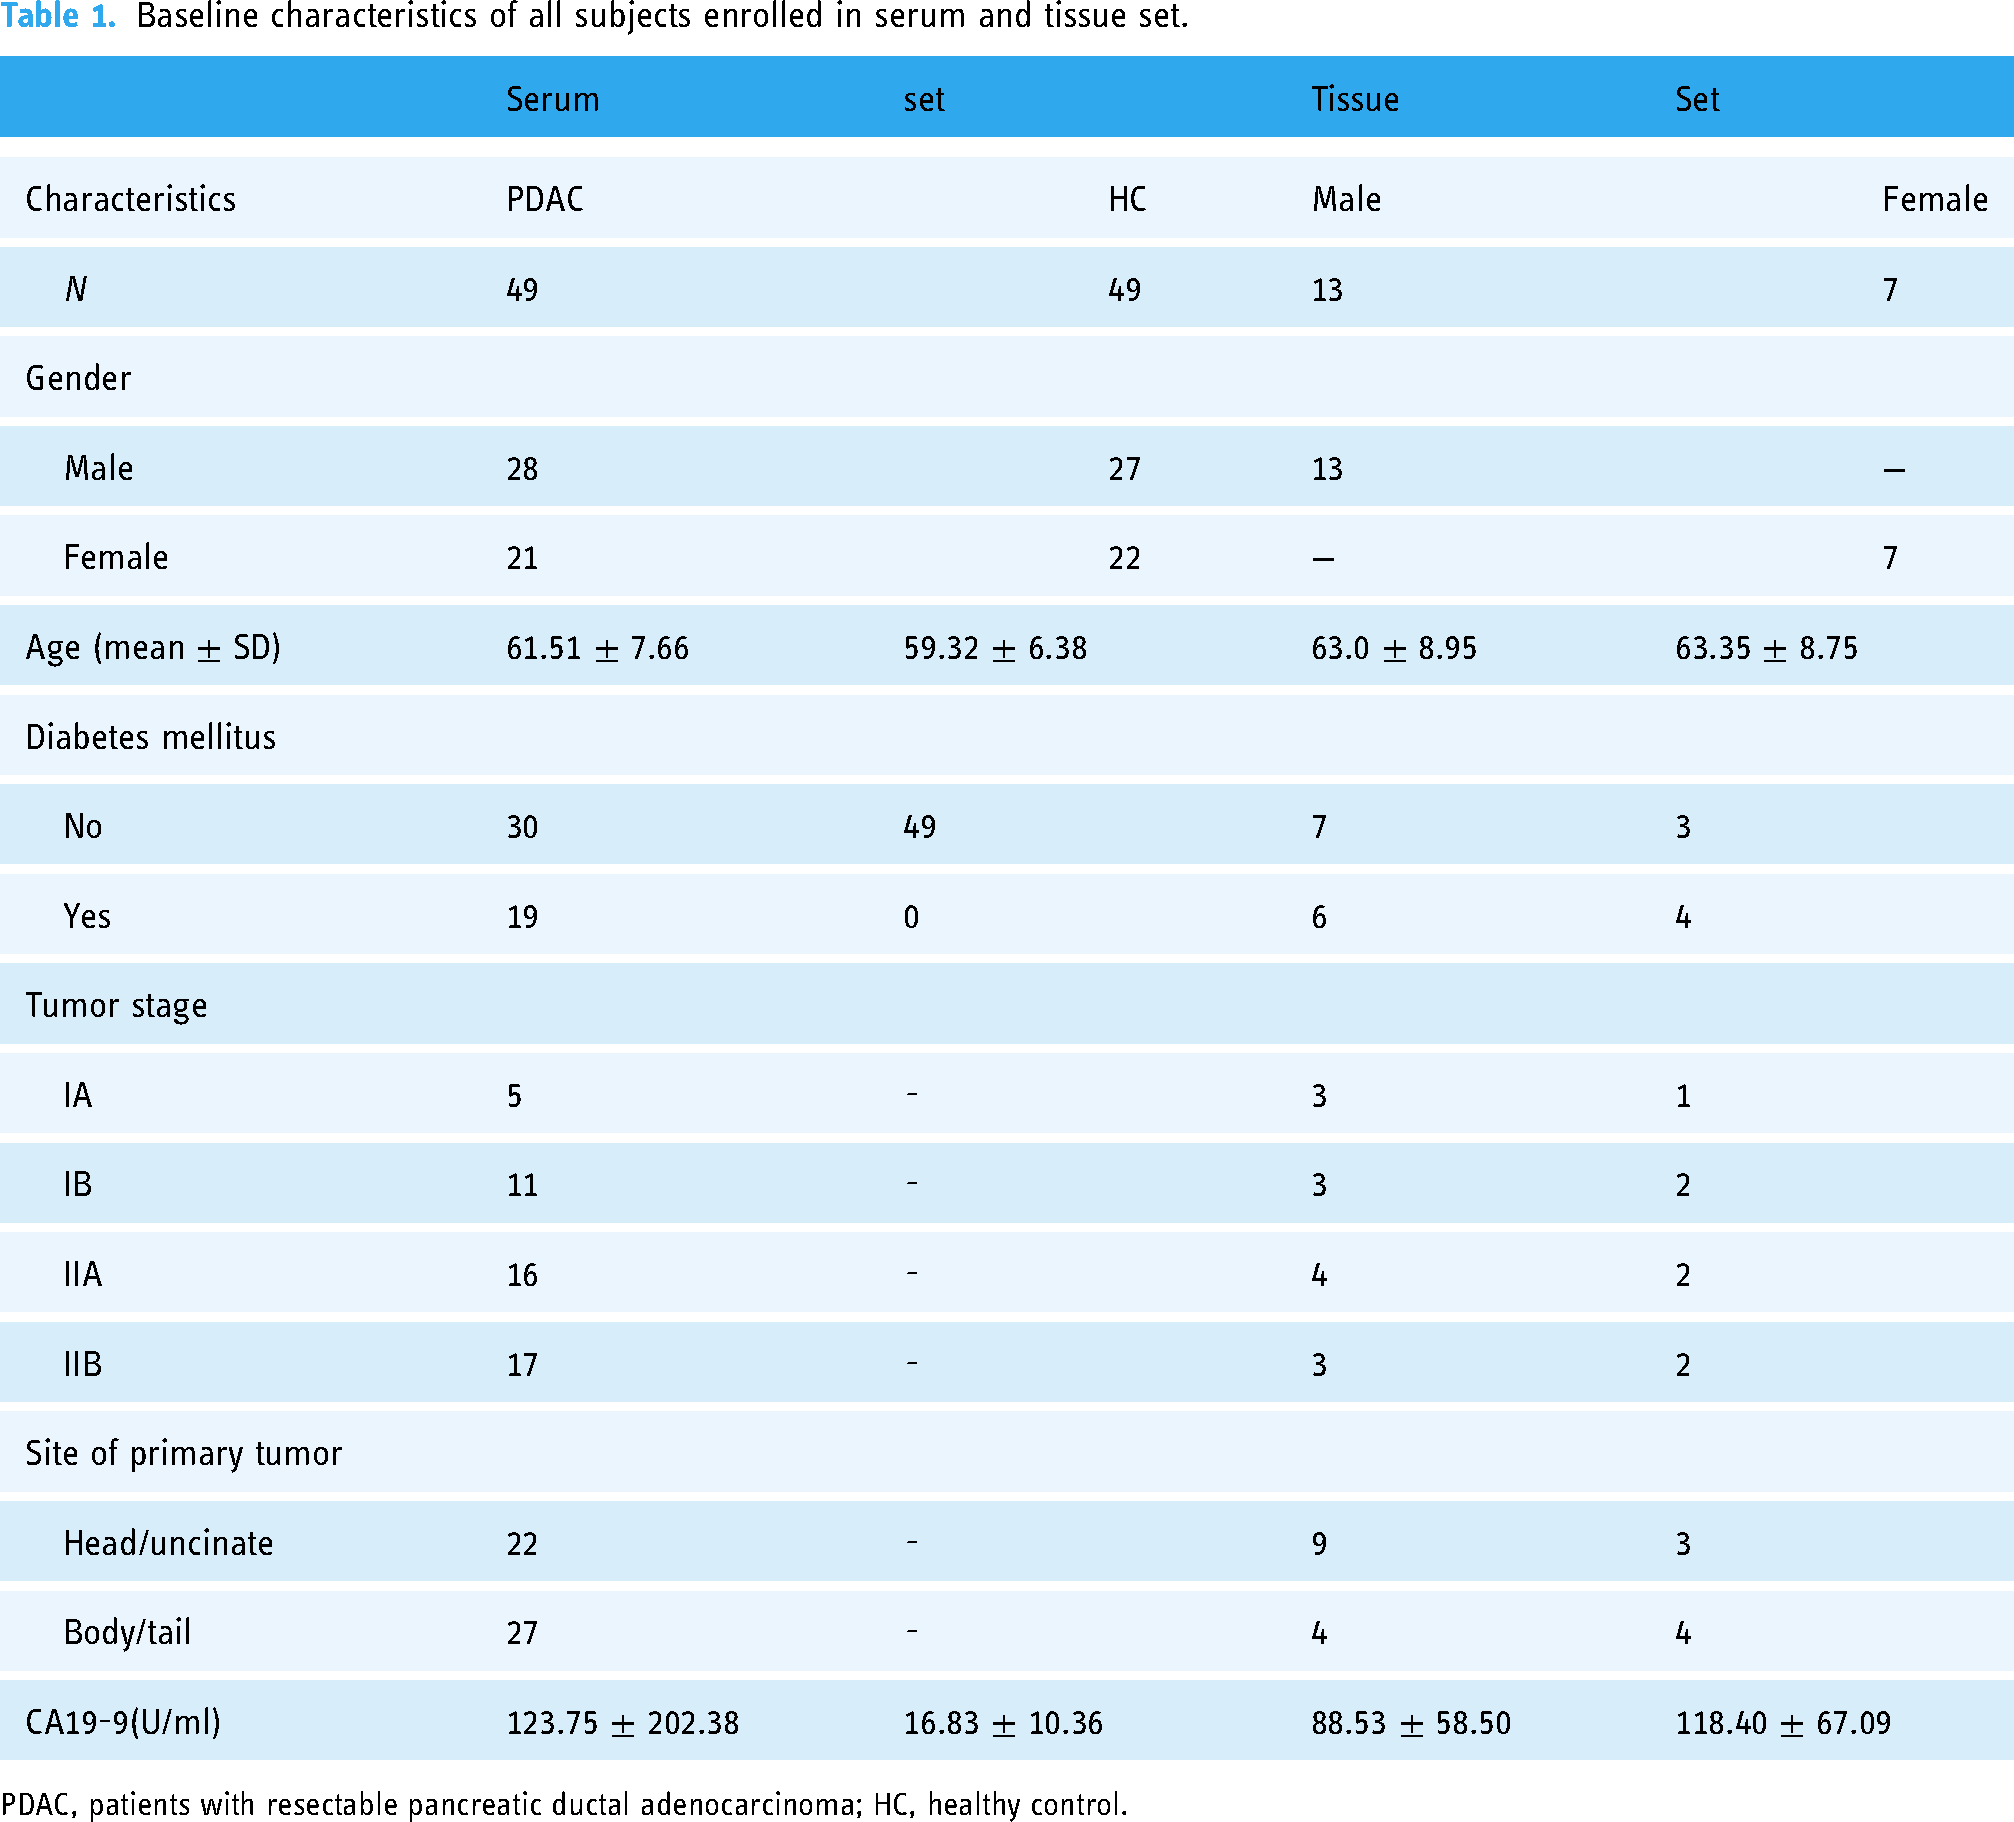
PDAC, patients with resectable pancreatic ductal adenocarcinoma; HC, healthy control.
Serum metabolic profile of patients with resectable PDAC and HCs
We performed an untargeted metabolomic analysis using UHPLC-Q-TOF-MS/MS, and detected a total of 9690 metabolic peaks, including 119 and 114 known metabolites in positive and negative ion modes, respectively. In PCA plots, the tight clustering of all QC samples indicated satisfactory analysis stability. However, the trends of separation between the groups of PDAC and HCs were unclear (Figures S2A–B). To visualize the greatest discrimination of the metabolic patterns between the groups, OPLS-DA analysis in both positive and negative ion modes was implemented. As expected, PDAC samples were separated well from HC samples, with acceptable values of R2Y and Q2 (positive ion mode, R2Y value = 0.98, Q2 value = 0.76; negative ion mode, R2Y value = 0.97, Q2 value = 0.73). After 200 permutations tests, no over-fittings were observed in the OPLS-DA models (Figure 1, Table S1). Therefore, the OPLS-DA model could be used to distinguish patients with resectable PDAC from HCs, with a favorable capacity for discrimination. Based on VIP > 1.0, a total of 80 metabolites were selected for the subsequent univariable analysis, including 30 and 50 metabolites in positive and negative ion modes, respectively. Then given FC > 1.2 or FC < 0.8 and p < .05, a total of 37 metabolites were selected further, including 13 and 24 metabolites in positive and negative ion modes, respectively. Among them, the levels of 22 metabolites were upregulated in the PDAC group, mainly concentrated in the class of lipids and lipid-like molecules (31.8%, 7/22) (Table S2). In contrast, 15 metabolites were downregulated in the PDAC group, mainly concentrated in the class of organic acids and derivatives (66.7%, 10/15) (Table S3).
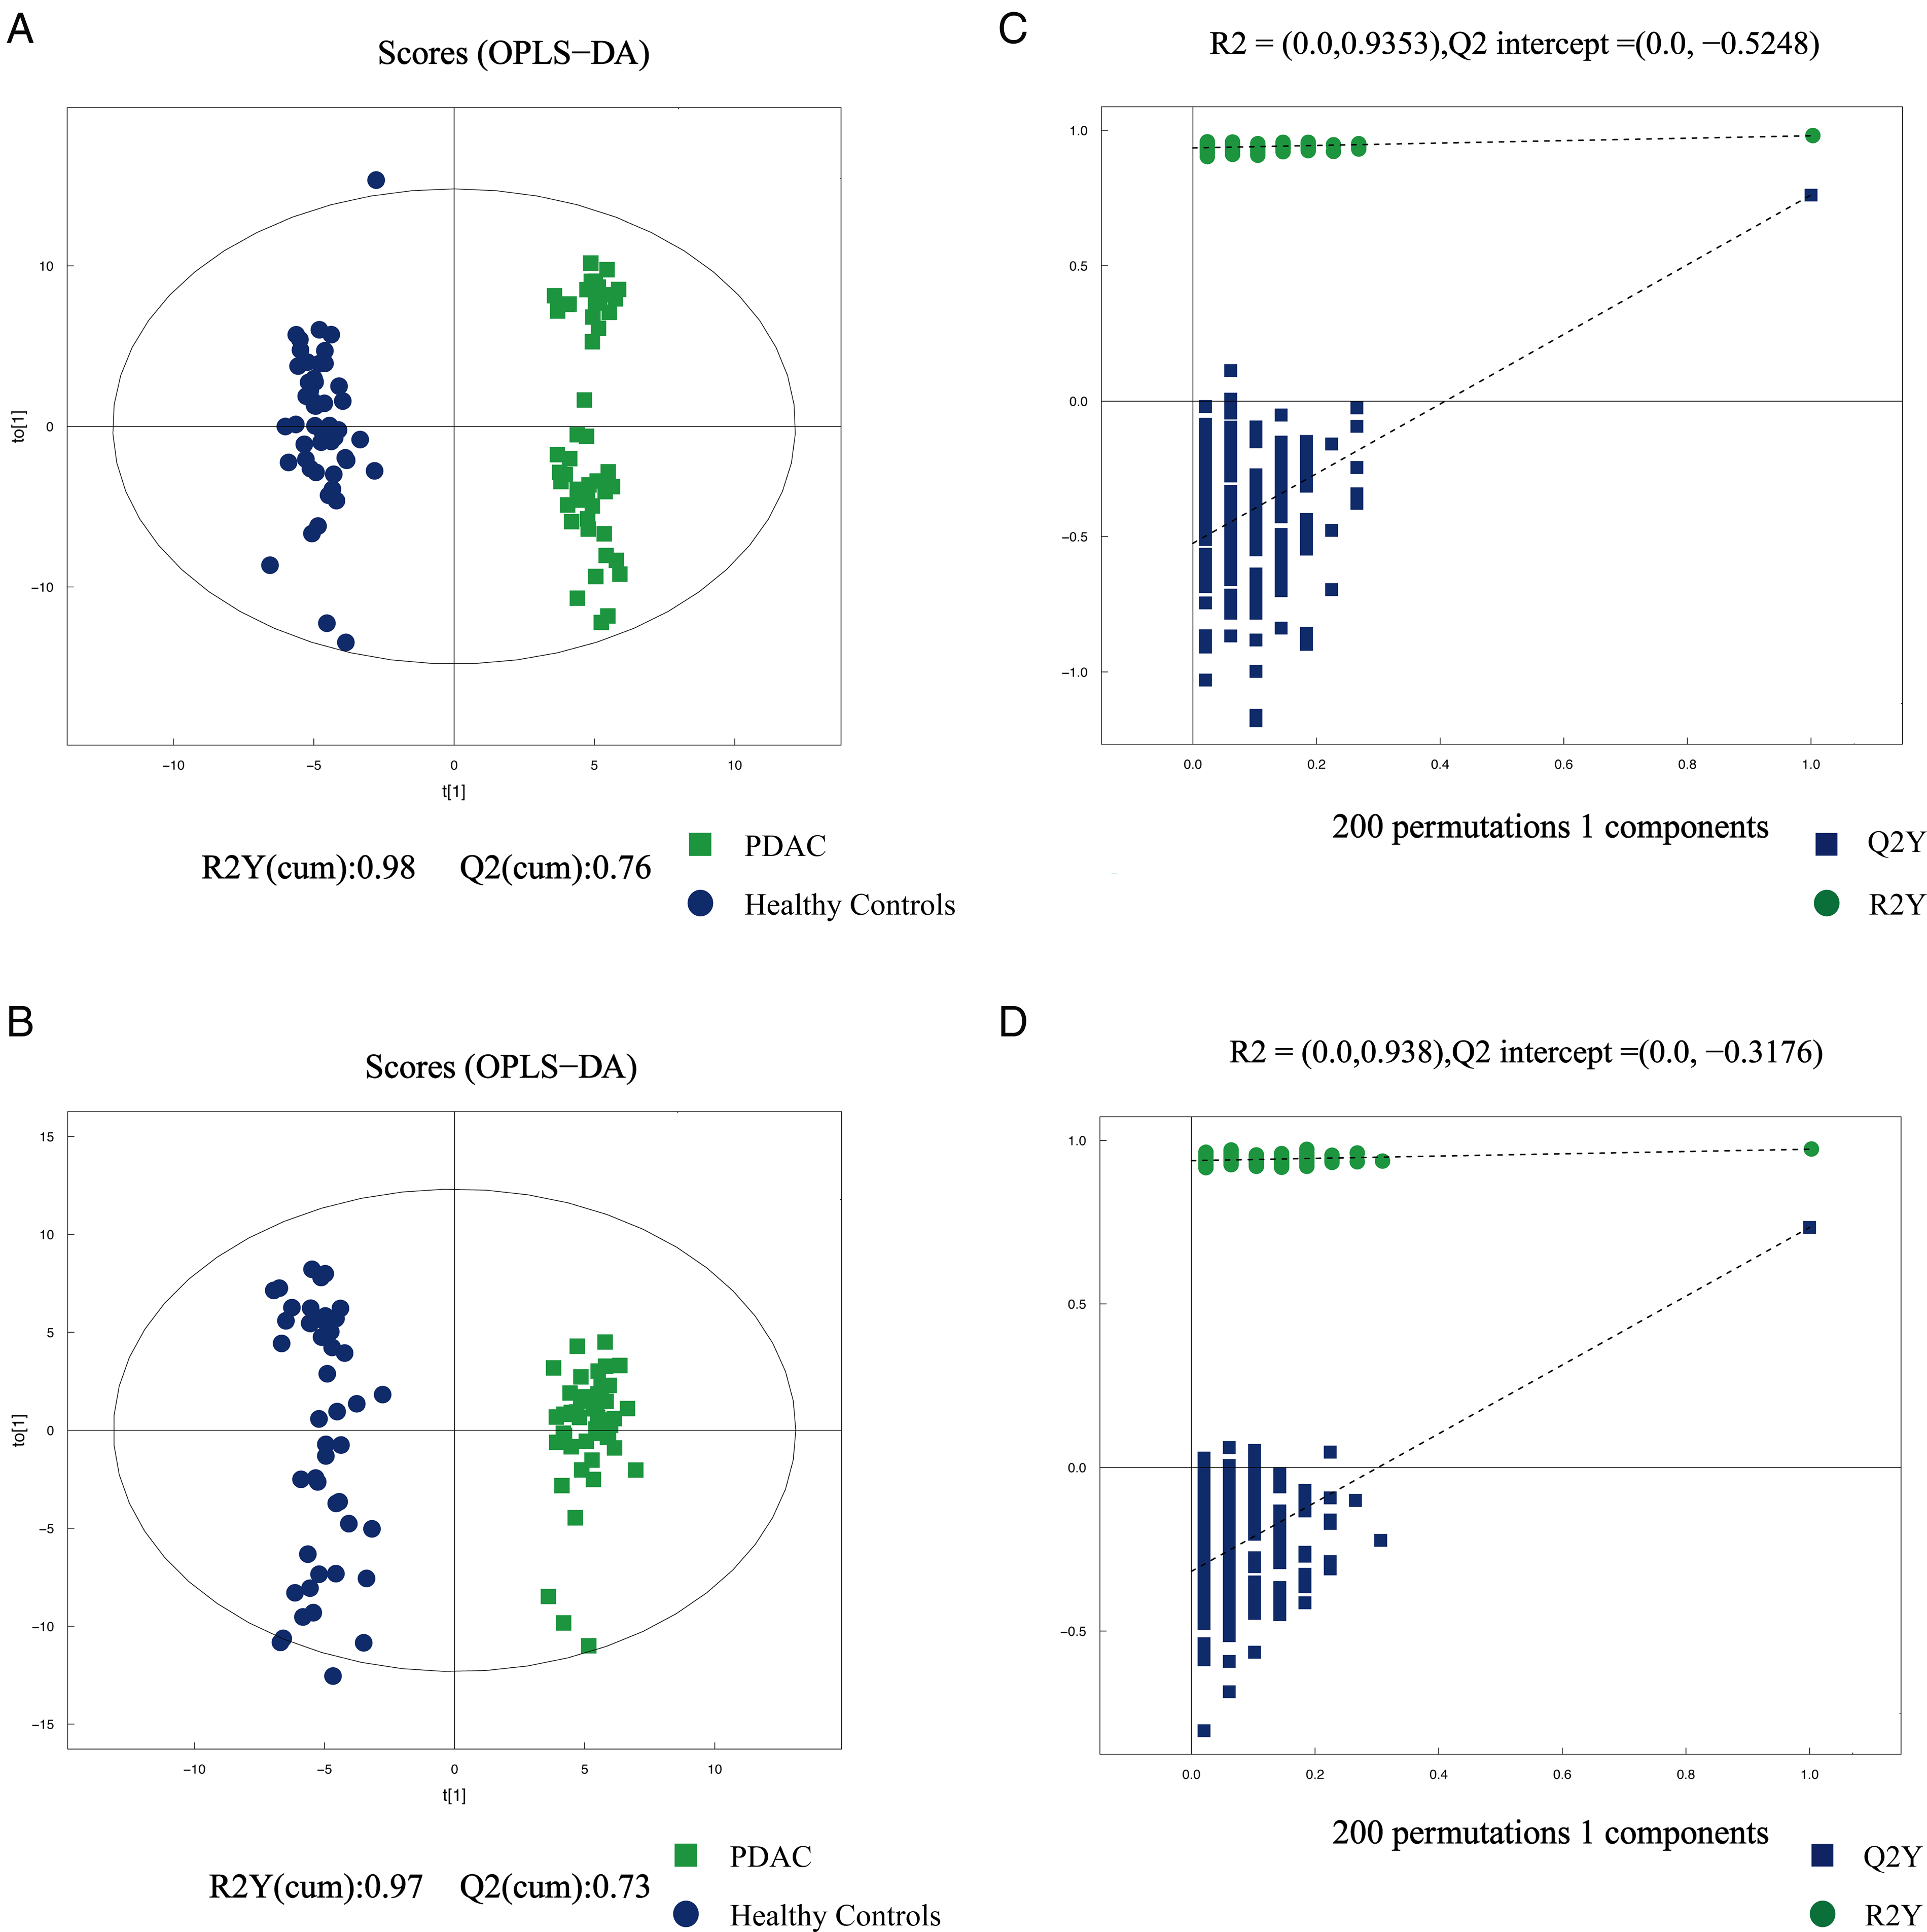
(A, B) Orthogonal partial least squares discriminant analysis (OPLS-DA) scatter plot between PDAC and healthy controls in serum samples in the positive and negative ion modes. (C, D) The statistical validation of the corresponding OPLS-DA models by permutation tests (200 times). Green plot indicates PDAC, blue plot indicated HC.
Defining potential serum biomarkers using tissue metabolomics
To further verify the diagnostic potential of serum metabolites in the diagnosis of resectable PDAC, 20 pairs of PCTs and ANTs were assessed using identical methods. In the PCA plots, the tight clustering of all QC samples indicated satisfactory analysis stability (Figures S2C–D). As shown in the OPLS-DA plots, PCT samples were also separated well from ANT samples with acceptable values of R2Y and Q2 value. After 200 permutations tests, no over-fittings were observed in the OPLS-DA models (Figure 2, Table S4). Based on VIP > 1.0, fold change (FC) > 1.2 or FC < 0.8, and p < .05, a total of 198 differential metabolites were identified in tissue samples, and 12 overlapping metabolites were both present in the tissue and serum samples (Table 2). The heatmaps were generated to visualize the specific patterns of differences in the serum and tissue metabolites between PDAC and HCs (Figure 3). Serum and tissue samples had the same change pattern of amino acid levels, which was lower in PDAC. Moreover, among the 12 metabolites, a total of eight differential metabolites had the same expressional levels in both serum and tissue samples, including four upregulated metabolites and four downregulated metabolites (Table 2).
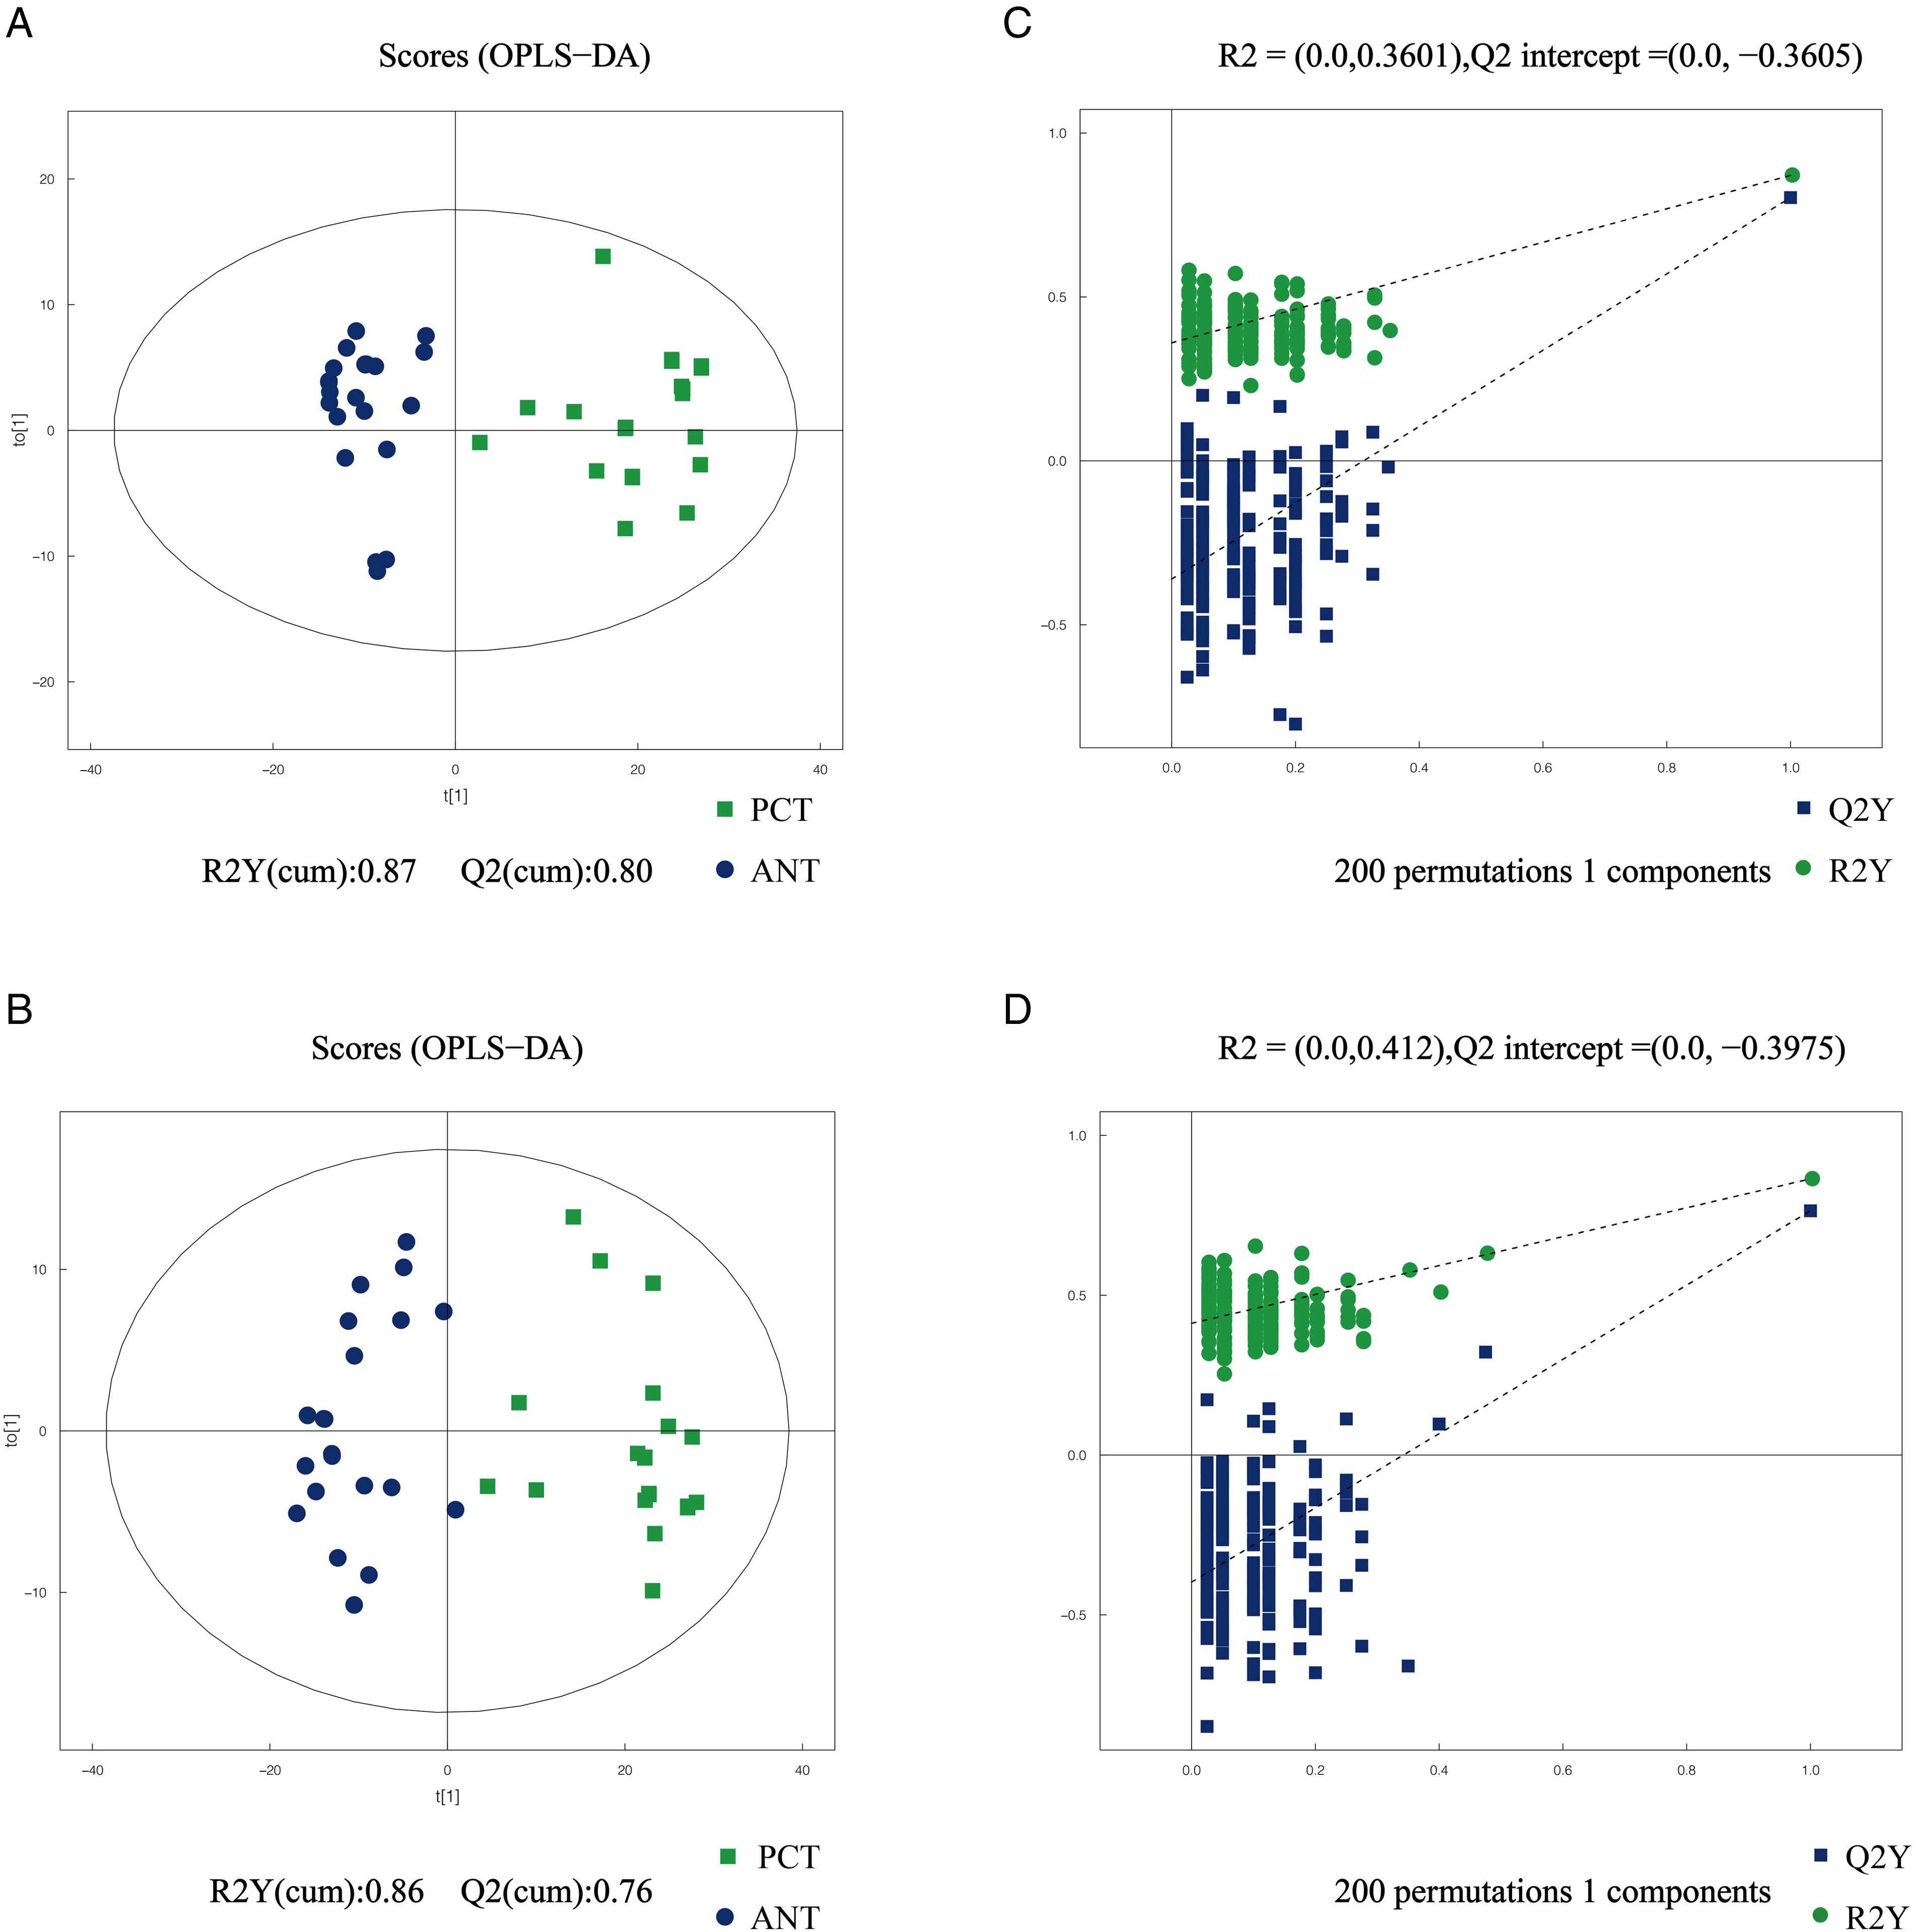
(A, B) Orthogonal partial least squares discriminant analysis (OPLS-DA) scatter plot between paired pancreatic cancer tissues (PCT) and adjacent noncancerous tissues (ANT) in the positive and negative ion modes. (C, D) The statistical validation of the corresponding OPLS-DA models by permutation tests (200 times). Green plot indicated PCT, blue plot indicates ANT.

(A) Heatmap visualization of the 12 overlapping metabolites from PDAC versus HC in serum samples. (B) Heatmap visualization of the 12 overlapping metabolites from paired pancreatic cancer tissues (PCT) versus adjacent noncancerous tissues (ANT). Blue color indicated lower level in PDAC. Red color indicated higher level of PDAC.
List of 12 potential metabolites presented both in serum and tissue samples of resectable PDAC patients.

Lyso PC(18:0),1-stearoyl-sn-glycerol-3-phosphocholine; LysoPE(16:0),1-Palmitoyl-2-hydroxy-sn-glycero-3-phosphoethanolamine.
*After adjusting by the false discovery rate method, the p-value was still less than .05.
According to the correlation analysis of metabolites, there was a positive correlation between phenylalanine and tyramine (correlation = 0.65), phenylalanine and norleucine (correlation = 0.37), norleucine and tyramine (correlation = 0.49), norleucine and glutamate (correlation = 0.46), lysoPC (18:0) and lysoPE (16:0) (correlation = 0.40), glutamate and lysoPC (18:0) (correlation = 0.21). In contrast, there was a negative correlation between tyramine and 16-hydroxypalmitic acid (correlation = −0.54), phenylalanine and 16-hydroxypalmitic acid (correlation = −0.49), 16-hydroxypalmitic acid and norleucine (correlation = −0.46), norleucine and lysoPE (16:0) (correlation = −0.30), tyramine and lysoPE (16:0) (correlation = −0.24), 16-hydroxypalmitic acid and glutamate (correlation = −0.20), lysoPE (16:0) and glutamate (correlation = −0.20) (Figure 4A).

(A) Correlation analysis of eight potential metabolites have the same changing patterns in both the serum and tissue samples of PDAC. LysoPC(18:0), 1-stearoyl-sn-glycerol-3-phosphocholine; LysoPE(16:0), 1-Palmitoyl-2-hydroxy-sn-glycero-3-phosphoethanolamine. (B). Receiver-operating characteristic (ROC) curves analyses of the serum metabolites panel for differentiating PDCA patients from healthy controls. AUC, area under the curve; PDAC, pancreatic ductal adenocarcinoma. Blue line indicates CA19-9. Green line indicates metabolites panel. Red line indicates metabolites panel plus CA19-9.
Construction of metabolites-based panel and diagnostic value
To evaluate the diagnostic values of the individual metabolites in serum samples of PDAC and HC (eight differential metabolites presented in both serum and tissue samples), univariate ROC curves were performed. As a result, the AUC values of these metabolites were in the range of 0.592–0.856 (Table 2). Among them, four metabolites showed high AUC values (AUC > 0.80), including 16-hydroxypalmitic acid, phenylalanine, norleucine, and tyramine. They were subsequently selected for a stepwise logistic regression model. Finally, three factors including 16-hydroxypalmitic acid, phenylalanine, and norleucine were considered as the most significant predictors (all p < .05). Therefore, a three-metabolites panel was constructed, and showed a satisfactory result in the ROC analysis, with an AUC value of 0.942 (higher than 0.850 of CA19-9 alone), a sensitivity of 89.8% (higher than 73.5% of CA19-9 alone), and a specificity of 85.7% (lower than 89.8% of CA19-9 alone) (Figure 4B, Table 3). Moreover, this panel showed a high positive predictive value of 86.3%, suggesting that the panel has a good clinical predictive value.
Receiver-operating characteristic (ROC) analysis of the metabolite panel, CA19-9 or both in the diagnosis of resectable PDAC.

3-Meta, panel of three metabolites (16-hydroxypalmitic acid, phenylalanine, and norleucine).
CA19-9 is widely used as a biomarker to diagnose PDAC in the clinic. Therefore, we analyzed the performance of this metabolites panel plus CA19-9, and this multimarker model showed a better performance than CA19-9 alone or the metabolites panel alone (AUC: 0.968 vs. 0.850, 0.942) (Figure 4B, Table 3). Moreover, this multimarker model increased the diagnostic sensitivity of CA19-9 alone (73.5% to 91.8%) (Table 3). As expected, with this multimarker model to classify the groups of PDAC and HCs, the accuracy rate was also higher than CA19-9 alone (90.8% versus 81.6%). Overall, the multimarker model based on CA19-9 and three-metabolites panel had a better diagnostic performance.
Discussion
The untargeted metabolomic analysis allows for the wide coverage of metabolite detection by an unbiased means and provides a detailed assessment of the metabolic changes. 11 In this study, we used a sensitive untargeted metabolomics platform, UHPLC-QTOF-MS/MS, to identify potential biomarkers which could be developed for early detection of PDAC at a surgically resectable stage. A total of eight metabolites were identified both in serum and tissue samples and a three-metabolite panel had shown an excellent diagnostic capacity for PDAC (16-hydroxypalmitic acid, phenylalanine, and norleucine).
We highlight our finding that the levels of several amino acids (phenylalanine, norleucine, glutamate) were lower in PDAC than those in HCs and change patterns of these metabolite levels in serum and tissue samples were consistent. A possible explanation for this result is that amino acids can be used by tumor cells as the nutrition source and main carbon source to meet the higher demand for biosynthesis and energy production.15,16 Similar results have also been reported in some previous studies of PDAC.17,18,19 In a metabolomic study based on LC-MS, decreased levels of amino acids were observed in PDAC plasma samples as compared to HCs, including phenylalanine and glutamine. 20 Another study using HRMS on serum samples of PDAC and HCs has proposed a nine-biomarker panel to diagnose PDAC, achieving an AUC of 0.992. 21 Interestingly, these studies showed a significant decrease of phenylalanine in PDAC compared to HCs, which was consistent with our result. In addition, the associated AUC value was 0.808 in our study, indicating that phenylalanine may help distinguish resectable PDAC from HC. Recent reports have indicated that phenylalanine is associated with the suppressive activity of myeloid-derived suppressor cells, which plays an important role in the reduction of immunosuppressive functions. 22
Norleucine is an antiviral metabolite of thermophile, and the inhibition of gastric and breast tumor metastases has been reported. 23 In our study, norleucine was found to be significantly lower in PDAC patients than in HC, with an AUC value of 0.802. However, the specific mechanism of norleucine in PDAC was never reported and requires further studies. In addition to amino acids, tumorigenesis is also associated with lipid metabolism disorders. 24 By tracing the dynamic metabolism of glucose in living cells, Li et al. have visualized the upregulation of de novo lipogenesis in pancreatic cancer cells. 25 In our study, two unsaturated fatty acids were elevated in PDAC, including oleic acid and 16-hydroxypalmitic acid, which largely supported the previous findings. Furthermore, significantly higher levels of the two phospholipids, lyso PC (18:0) and lyso PE (16:0) were observed in PDAC patients. The phospholipid is the major component of biological membranes, the elevated levels detected indicated that the rate of phospholipid usage for membrane may be less than the rate of synthesis in the early-stage PDAC. However, some previous studies regarding PDAC have observed an inverse alteration of several phospholipids in the serum of PDAC. 26 This discrepancy might be associated with the differences between metabolomics platform and PDAC cohorts. Most of the PDACs included in these previous studies were at an advanced stage.
In this study, the level of succinate in the serum of PDAC was lower than that in HC. As a key intermediate of the TCA cycle, the deceased level detected in PDAC indicated that pancreatic cancer cells consume a significant amount of succinate during the TCA cycle. Additionally, lactate which is the end product of glycolysis was significantly decreased in the serum of PDAC patients. According to previous research, the lower lactate level may indicate that some cancer cells increase the lactate uptake to fuel the TCA cycle.27,28 Glutamate as the intermediate product of glutamine can provide the carbon skeleton for the TCA cycle. 15 In our study, glutamate was found significantly lower in both serum and tissue samples of PDAC patients, and a similar result has also been reported in a previous study. 17 In general, these findings indicate the energy metabolic reprogramming in PDAC, which is consistent with the Warburg effect.
With the development of analytical techniques and bioinformatics methods, metabolomics has become a powerful tool for biomarker discovery. 9 As the metabolomics platform, mass spectrometry (MS) is the most widely used to identify biomarkers for various cancer. 29 There have been several previous metabolomic studies that used MS-based technology to analyze the unique metabolome on the blood samples of PDAC. Xie et al. used LC-MS combined with GC-MS to search for plasma biomarkers of PDAC, two of the metabolites were also found to be altered in our cohort of PDAC: glutamine and glutamate. 30 Fukutake et al. utilizing LC-MS on plasm samples of PDAC patients and HCs have demonstrated that serine was significantly increased, and a total of 14 other amino acids were significantly decreased in PDAC patients. 31 However, most of the previous studies were limited by the number of PDAC samples in the resectable early stage. Compared to the previous study, our study had larger samples of early-stage PDAC samples, and this was the first study using serum-combined tissue samples to analyze the metabolic profile of resectable PDAC.
The main limitation of this study is the lack of an external validation set; therefore, the power of the metabolic panel requires further confirmation in large-scale cohorts. The untargeted metabolomics we used is a relative quantification method of the metabolites. In this study, we only compared the expressional trends of different metabolites in both serum and tissue samples and the relative metabolite expression of the two datasets were not directly compared. In the future, targeted metabolomics should be established to obtain quantitative comparisons between serum and tissue metabolite. Indeed, the lack of reproducibility in metabolic signatures across different studies is of concern.32,33 Among the three metabolites identified in this study, only phenylalanine obtained a level of reproducibility across 24 PDAC metabolomics studies as significantly changing between HCs and PDAC patients. 33 More research is needed to support the reproducible expression of 16-hydroxypalmitic acid and norleucine for PDAC patients. In addition, with the advent of surgical techniques and chemoradiation therapies, for a special category of stage III PDAC, borderline resectable pancreas cancer (BRPC), margin negative resection would be also achieved after neoadjuvant chemotherapy. 34 Therefore, future studies should involve the performance of this panel (16-hydroxypalmitic acid, phenylalanine, and norleucine) in the BRPC, aiming to improve the resection rates of PDAC patients.
Supplemental Material
sj-docx-1-dhj-10.1177_20552076231179007 - Supplemental material for Untargeted metabolomics characterization of the resectable pancreatic ductal adenocarcinoma
Supplemental material, sj-docx-1-dhj-10.1177_20552076231179007 for Untargeted metabolomics characterization of the resectable pancreatic ductal adenocarcinoma by Ying-Ying Cao, Kai Guo, Rui Zhao, Yuan Li, Xiao-Jing Lv, Zi-Peng Lu, Lei Tian, Shuai Ren and Zhong-Qiu Wang in DIGITAL HEALTH
Footnotes
Acknowledgements
We will thank the patients for their great help in this report. Ying-Ying Cao, Kai Guo, and Rui Zhao contributed equally to this work. Shuai Ren and Zhong-Qiu Wang are co-correspondence authors for this study.
Authors’ Note
Ying-Ying Cao, Kai Guo, and Rui Zhao contributed equally to this work.
Ethical approval
This prospective study obtained approval from the independent Ethics Committee of the Affiliated Hospital of Nanjing University of Chinese Medicine (2017NL-135-05). All patients had signed informed consent.
Guarantor
Zhong-Qiu Wang.
Contributorship
ZQW, SR, YYC, and RZ obtained funding for the project; YYC, KG, RZ, SR, and ZQW contributed to the conception and design, and gaining ethical approval; YYC, KG, YL, XJL, ZPL, and LT were involved with data acquisition and analysis; RZ and YYC interpreted the data; YYC, RZ, and KG drafted the article; SR and ZQW revised and finalized the article. All authors reviewed and approved the final submitted version.
Data availability statement
All data generated for this study are available from the corresponding author.
Conflicts of interest
All author(s) have reviewed the final version of the manuscript and approved it for publication.
Funding
The author(s) disclosed receipt of the following financial support for the research: the National Natural Science Foundation of China (Grant numbers 82202135 and 82171925), Foundation of Excellent Young Doctor of Jiangsu Province Hospital of Chinese Medicine (Grant number: 2023QB0112), Innovative Development Foundation of Department in Jiangsu Hospital of Chinese Medicine (Grant numbers: Y2019CX27 and Y2021CX19), Developing Program for High-level Academic Talent in Jiangsu Hospital of TCM (Grant number. y2021rc03), and Postgraduate Research & Practice Innovation Program of Jiangsu Province (Grant numbers: KYCX21_1702 and KYCX23_2175).
Supplemental material
Supplemental material for this article is available online.
References
Supplementary Material
Please find the following supplemental material available below.
For Open Access articles published under a Creative Commons License, all supplemental material carries the same license as the article it is associated with.
For non-Open Access articles published, all supplemental material carries a non-exclusive license, and permission requests for re-use of supplemental material or any part of supplemental material shall be sent directly to the copyright owner as specified in the copyright notice associated with the article.