
Abstract
Objective
The Eastern Cooperative Oncology Group performance status (ECOG PS) is a widely recognized measure used to assess the functional abilities of cancer patients and predict their prognosis. It plays a crucial role in guiding treatment decisions made by physicians. This study aimed to build a stacking ensemble-based prognosis predictor model for predicting the ECOG PS of a liver cancer patient undergoing treatment.
Methods
We used Light Gradient Boosting Machine (LightGBM) as the meta-model, and five base models, including Random Forest (RF), Extra Trees (ET), AdaBoost (Ada), Gradient Boosting Machine (GBM), and Extreme Gradient Boosting (XGBoost). After preprocessing the data and applying feature selection method, the stacking ensemble model was trained using 1622 liver cancer patients’ data and 46 variables. We also integrated the stacking ensemble model with a LIME-based explainable model to obtain model prediction explainability.
Results
According to the research, the best combination of the stacking ensemble model is ET + XGBoost + RF + GBM + Ada + LightGBM and achieved a ROC AUC of 0.9826 on the training set and 0.9675 on the test set.
Conclusions
This explainable stacking ensemble model can become a helpful tool for objectively predicting ECOG PS in liver cancer patients and aiding healthcare practitioners to adapt their treatment approach more effectively.
Introduction
Liver cancer is the sixth most prevalent type of primary cancer and the fourth leading cause of mortality due to cancer worldwide. 1 Liver cancer accounts for about 906,000 new cases and 830,000 fatalities annually, and the numbers are continually rising, according to GLOBOCAN 2020. 2 Eastern Asian nations, including South Korea, reported the highest liver cancer incidence rates. 3 For patients with liver cancer, poor performance status is an independent and significant prognostic predictor of survival. 4 In particular, performance status is used as an indicator of treatment and a predictor of long-term survival. 4 Therefore, developing a prognosis predictor model to predict a patient's performance status is essential for comprehensive customized therapy for liver cancer.
The ECOG Performance Status Scale (ECOG PS), 5 which was devised by the Eastern Cooperative Oncology Group, is a widely utilized method for assessing a patient's actual level of function and self-care capacity. 6 ECOG PS is a single-item rating scale determined by the physician, ranging from Grade 0 (0, fully active without symptoms) to Grade 5 (dead). The ECOG PS is widely employed in oncology trials to evaluate the functional capacity of patients undergoing treatment. 6 It was shown that ECOG PS has a strong prognostic influence on survival and facilitates physician decision-making in treatment choice. 4 Nonetheless, this evaluation is highly heterogeneous and dependent on the individual physician's subjective categorization, so different physicians in various centers may evaluate a single patient differently, resulting in a heterogeneous group of patients within a single ECOG PS level. 7 Consequently, an objective prediction model for ECOG PS is required to obtain an accurate and homogeneous for each patient in order to aid physicians in selecting an effective treatment for a patient.
In recent years, due to the rapid development of artificial intelligence, an increasing number of researchers have turned to machine learning (ML) techniques to address clinical problems, 8 and liver cancer has been the subject of a substantial number of studies. 9 For instance, Książek et al. 10 employed patient-specific attributes, including viral status, comorbidities, and laboratory findings, to anticipate the onset of hepatocellular carcinoma (HCC) using a dataset of 23 quantitative and 26 qualitative features. In this work, the support vector machine (SVM) (type C-SVC) model achieved remarkable accuracy and F1-Score of 0.8849 and 0.8762, respectively, indicating its effectiveness in predicting HCC progression., indicating its effectiveness in predicting HCC progression. In a more recent study, Zhang et al. 11 devised an innovative liver cancer diagnosis approach by building a patient similarity network using three distinct liver cancer omics datasets. They introduced a novel method that combined similarity network fusion, denoising autoencoder, and dense graph convolutional neural network (DenseGCN) to leverage patient similarity network and multi-omics data effectively. The proposed method exhibited impressive performance, with an accuracy reaching up to 0.9857. Fa et al. 12 employed a combination of high-throughput genetic expression data and support vector machines (SVM) to predict the survival of HCC patients. This approach provided valuable insights into the prognosis of HCC patients, contributing to personalized treatment strategies. Another notable study by Morshid et al. 13 leveraged the power of convolutional neural networks (CNN) to analyze pretherapeutic quantitative CT images and predict the responses of HCC patients to transcatheter arterial chemoembolization. By extracting relevant information from medical images, their model showcased the potential of ML in aiding treatment decisions.
The aforementioned studies10–13 showcase the wide-ranging applications of machine learning (ML) techniques in liver cancer research, highlighting their potential to enhance diagnostics, prognosis, and treatment outcomes. However, there remains a scarcity of research focused on prediction models for the ECOG PS, specifically in liver cancer patients. While a few studies14–16 have developed ML models for predicting ECOG PS, these investigations have primarily focused on lung cancer patients. Moreover, these studies utilized single classifier models, such as Logistic Regression (LR), XGBoost, and AdaBoost, while a stacking ensemble method can combine multiple classifiers to improve prediction accuracy compared to a single base classifier. 17
In light of these research gaps, we have introduced a novel stacking ensemble-based prognosis predictor model specifically for predicting the ECOG PS of liver cancer patients undergoing treatment. In addition to accuracy, interpretability is a crucial aspect in Clinical Decision Support Systems (CDSS). Recently, many studies18–23 have used LIME (Local Interpretable Model-Agnostic Explanation) to provide interpretability to ML models in tabular data. Therefore, we have integrated a LIME-based explainability model with the stacking ensemble model. This integration allows us to comprehensively and accurately explain the interpretability of the prediction model, making it more transparent and interpretable for clinical professionals and improving the trustworthiness and applicability of the model in real-world healthcare settings. To the best of our knowledge, this study is the first to develop an explainable stacking ensemble model for predicting ECOG PS specifically in liver cancer patients.
The main contributions of this work are given below:
We developed a stacking ensemble-based prognosis predictor model for predicting the ECOG PS of a liver cancer patient. To evaluate the effectiveness of our stacking model, we conducted performance comparisons against various base classifier models. We also compared the stacking model with TabNet
21
model, a recently released deep learning model that outperforms numerous prediction models on tabular data. By doing so, we demonstrate the competitiveness of our approach against an advanced deep learning technique. In recognition of the critical importance of interpretability in clinical decision-making, we integrated the LIME-based explainability model into our stacking ensemble approach. This innovative hybrid model offers comprehensive and accurate explanations of the prediction results, enabling medical professionals to better understand and trust the model's decisions.
Literature review
In order to predict the ECOG PS in lung cancer patients, Andreano et al. 14 suggested a LR model employing administrative healthcare data from 4488 patients with 11 features. The target feature was divided into two categories: “poor” (ECOG PS values between 3 and 5) and “good” (ECOG PS values between 0 and 2). The training and validation portions of the dataset were split 50:50 randomly. On the training set and validation set, the model achieved “Area under the receiver operating characteristic curve” (ROC AUC) values of 0.76 and 0.73, respectively.
Agrawal et al. 15 developed models using LR or XGBoost to predict ECOG PS at various diagnosis stages using a dataset of 31,425 Non-Small Cell Lung Cancer patients. Laboratory testing, physical examinations, comorbidities, medications, age, and metastatic status were used to identify key features. The ROC AUC score for the LR model improved to 0.73 when only 220 features were utilized. Using 22,000 features and the XGBoost model, the patient's final ECOG PS could be evaluated with a ROC AUC of 0.81. The ROC AUC score of the XGBoost model was 0.77 when generating more interpretable models with 110 or 40 characteristics.
Nguyen et al. 16 utilized clinical data from 2063 lung cancer patients to create a prediction model using the AdaBoost classification model for predicting the ECOG PS of lung cancer patients. According to the results, the AdaBoost model achieved the highest ROC AUC score of 0.7890, outperforming other benchmark models such as LR, K-Nearest Neighbors (KNN), Decision Trees (DT), Random Forest (RF), XGBoost, and TabNet. In addition, the interpretability of the model was evaluated by combining the AdaBoost model with a LIME-based explainable model.
Materials and methods
Data source and study design
The Korean Central Cancer Registry reported 3067 cases of liver cancer in 2016. In order to examine clinical characteristics, treatment information, and outcomes of Korean lung cancer patients, data was taken from 13 cancer centers across the nation using a systematic sampling method. The Korean Association for Liver Cancer and the Korean Central Cancer Registry collected standardized information including age, gender, BMI, smoking history, symptoms, histopathologic type, clinical stage, ECOG PS after treatment, mode of treatment, and survival status. Clinical characteristics were collected at the time of initial cancer diagnosis, prior to treatment. The ECOG PS score, a key prognostic factor on survival, 4 evaluates the patient's performance status based on medical records at the time of diagnosis, encompassing admission records, progress notes, nursing records, and nursing assessment forms. Patient survival information was gathered from the National Health Insurance database, telephone interviews, and medical records. The study protocol was approved by the Institutional Review Board of the National Cancer Center, and informed consent was waived due to the retrospective nature of the study.
This study carried out various procedures, as shown in Figure 1, in order to develop an accurate prediction model for ECOG PS in liver cancer patients after treatment. The dataset was initially processed to ensure its suitability for analysis. A feature selection process was conducted to select relevant attributes that were highly predictive of liver cancer patients’ ECOG PS. Subsequently, several single base models and stacking models were trained and evaluated, in order to explore the model with the best prediction performance. Finally, the LIME technique was utilized to gain insights into the prediction made by the superior stacking ensemble model and enhance its interpretability. Detailed explanations of each method and model used in this study are provided in the following subsections.

Study design.
Data preprocessing
The raw dataset included 3067 patients and 65 columns of identifying data. We started pre-processing by removing 9 unnecessary columns relating to serial numbers and date/time variables. The categorical variables in the dataset were then encoded with ordinal encoding. The “performance” column, abbreviated “ECOG PS,” was chosen as the study's target variable.
To handle missing values, columns containing 50% null values and rows with missing values on “performance” were eliminated. This dataset contained both numeric and categorical variables; therefore, we used a hybrid of the forward-fill (ffill) and back-fill (bfill) approaches to fill in missing values. The dataset was condensed to 2170 patients with 56 variables and the target feature after removing redundant columns and filling in missing values.
The target feature “performance” assesses a patient's level of functioning with regard to daily tasks, self-care, and physical capacities. The specific description of each score is shown in Table 1, along with the total number of values for each score in the dataset. The values of score 0 are severely out of proportion to the other scores, as seen in Table 1. Due to the imbalanced data, machine learning algorithms may overfit when making predictions. In order to address the imbalanced issue, we decided to combine the values of scores from 1 to 4 into one group denoting “restricted performance status”, encoding as value 1. The significance and value of score 0 remain unaltered. Only two values remained in the “performance” column following processing: 0 = “fully active, able to carry on all pre-disease performance without restriction” and 1 = “restricted performance status”. The ratio between the number of score 0 (class 0) and the number of score 1 (class 1) is 1537:633. Because the dataset was still imbalanced, we then utilized the SMOTE-ENN 24 approach to rebalance it.
Performance Status scale and the number of each score value in the dataset.
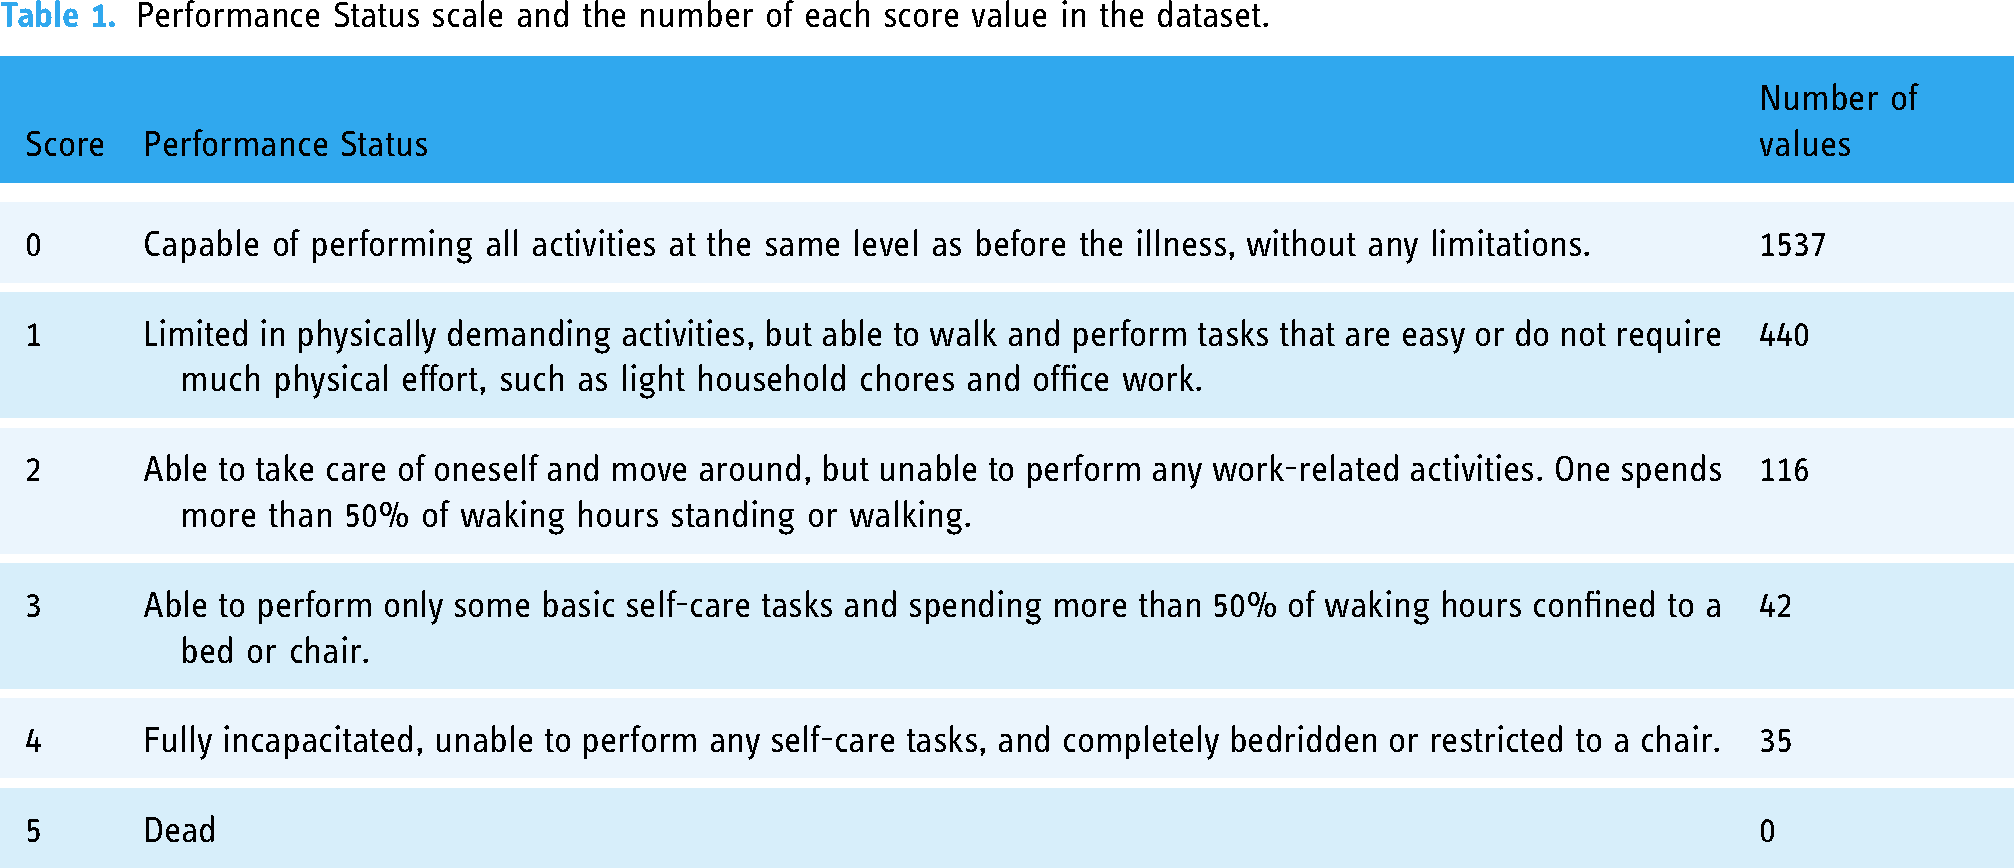
The synthetic minority over-sampling technique (SMOTE) method, developed by Chawla et al., 25 is an enhanced technique for balancing out imbalanced data. Essentially, the SMOTE algorithm generates new samples by randomly interpolating between a small number of samples and the neighbors of those samples. In order to enhance the classification impact of an imbalanced dataset, the ratio of imbalanced data is increased by generating a specified number of artificial minority samples. 26 The core idea of edited nearest neighbor (ENN) 27 is to eliminate samples whose class differs from that of its k-nearest neighbors in the majority. The main objective of the algorithm is to remove most of the noise samples. In principle, the SMOTE-ENN technique combines the SMOTE capability to generate synthetic instances for the minority class with the ENN capability to eliminate observations from both classes that are identified as belonging to a different class than the majority class's k-nearest neighbor and the observation's class. In this study, the dataset was stratify-split into a training set and a test set at a ratio of 70:30 before the SMOTE-ENN approach was applied. The SMOTE-ENN approach only rebalanced the training dataset. The test set (also called holdout set), comprising 651 patients, was left unaltered to ensure that model performance was evaluated on representative data, representative of real-world scenarios. The final train set consisted of 971 patients, with a ratio of 376:595 between class 0 and class 1 patients. This study finally analyzed clinical data from 1622 liver cancer patients.
Feature selection
Feature selection methods aid in identifying and prioritizing the most important and highly regarded features of a dataset. Wrapper, filter, and embedded method are the three techniques to select features. 28 Since the embedded technique combines the advantages of both the filter method and the wrapper method, it serves as a middle ground solution. 29 Particularly, the embedded technique is computationally simpler than the wrapper method while remaining computationally intensive compared to the filter method. Despite allowing interactions with the classifier (i.e., incorporating the bias of the classifier into feature selection, which tends to increase classifier performance) in a similar way to wrapper approaches, the embedded method has a lower computing cost.
Feature selection is integrated or built into the classification algorithm in an embedded approach. For the best classification accuracy during the training phase, the classifier adjusts its internal settings and selects the appropriate weights/importance given to each feature. Consequently, procedures of identifying the optimum feature subset and creating the model are merged into a single step in an embedded technique. 30
The Random Forest (RF), 31 Extra Tree (ET), 32 AdaBoost (Ada), 33 Gradient Boosting Machine (GBM), 34 Extreme Gradient Boosting (XGBoost), 35 and Light Gradient Boosting Machine (LightGBM) 36 models, which are component models of stacking ensemble model in this study, have built-in feature selection methods as instances of embedded methods. As a result, we used the feature selection techniques of the RF, ET, Ada, GBM, and XGBoost models to extract significant features from the dataset. We employed the default models of RandomForestClassifier, ExtraTreeClassifier, AdaBoostClassifier, GradientBoosting-Classifier, and XGBClassifier in Python version 3.11.3 to fit the training set, then selected features with an importance score of 0.01 or higher.
Development of stacking ensemble model
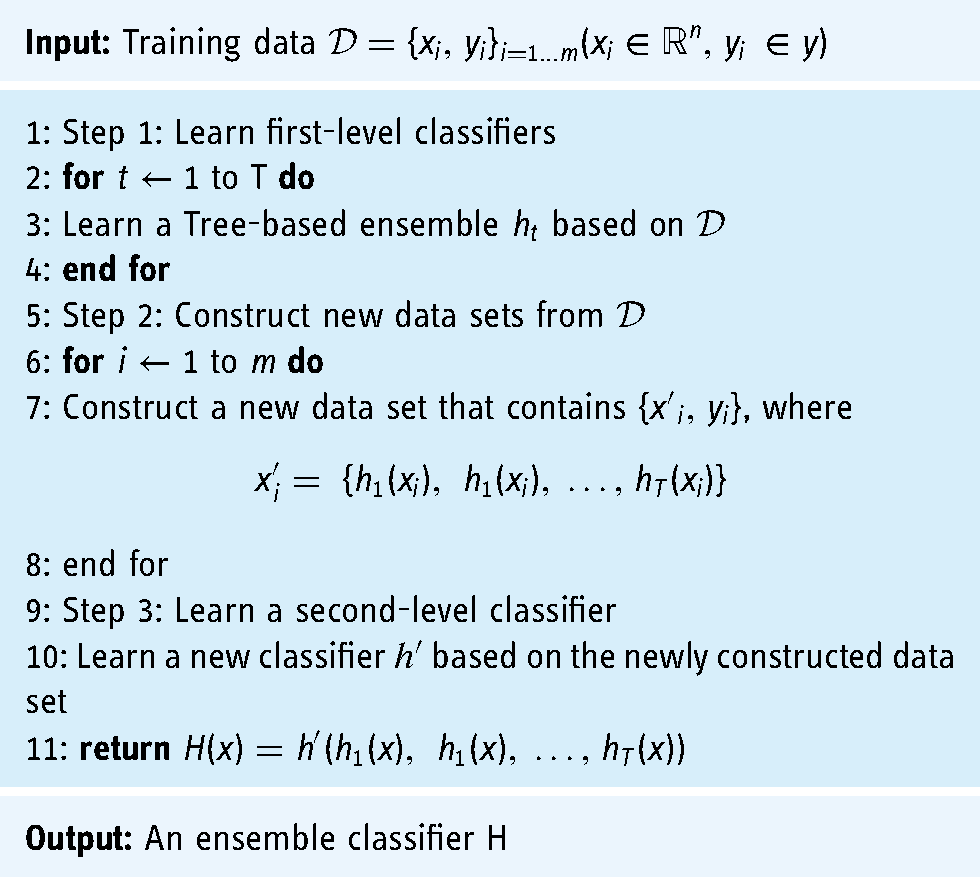
Stacking 37 is a type of heterogeneous ensemble model in which multiple base classifiers are combined via a meta-classifier to generate a final prediction model. The base classifiers employ several learning techniques and are trained using the entire training dataset. The results of the base classifiers are used as a training set for the meta-classifier in order to construct the final prediction model. The stacking ensemble algorithm is outlined in the pseudo-code in Algorithm 1. The algorithm adopts a training data set D with m instances as input, with each instance having the values (x, y), where x is a feature vector and y denotes a class label. After three primary stages, it returns a stacking ensemble model H.
Stacking ensemble
The first-level classifiers create the second-level training set during the training phase of the ensemble model based on the stacking algorithm. If the training set of the first-level classifiers is directly utilized to generate the second-level training set, overfitting is probably to occur. Consequently, the cross-validation method was employed to generate training samples for the second-level classifier using the unused samples from the first-level classifiers’ training process. In this manner, the overfitting can be reduced. Therefore, the stratified 10-fold cross-validation (CV) method was applied in this research to implement the stacking ensemble model.
This study employed a stacking ensemble model using RF, ET, Ada, GBM, and XGBoost as the base models and the LightGBM model as the meta-model. This study deployed a stacking ensemble model with RF, ET, Ada, GBM, and XGBoost as the base models and LightGBM as the meta-model. Before stacking base models and meta-model, we used the Optuna
38
framework to fine-tune these models’ hyperparameters on the optimized train set with features obtained from the best feature selection method in our study. These tree-based ensemble models and their optimized hyperparameters are briefly described below:
Random Forest (RF)
31
is a bagging algorithm that leverages the power of multiple small decision trees generated from random subsets of the dataset. The tree diversity is enhanced by randomly selecting a subset of features at each node to find the best split. Due to the randomness in both the dataset and features, overfitting is effectively reduced. In classification tasks, the ultimate class label is determined by a majority vote, consolidating the collective decisions of the individual trees. Hyperparameters of RF in this study are n_estimators = 300, criterion = ‘entropy’, max_depth = 11, min_samples_leaf = 2, max_features = 0.4, min_impurity_decrease = 8.65e-07, bootstrap = False, class_weight = ‘balanced’. Extra Trees (ET),
32
also known as extremely randomized trees, resemble the RF algorithm while adding more randomness. However, ET deviates from RF in two notable ways: (1) it constructs each decision tree using the entire dataset, and (2) it adopts a random split selection strategy at each node, disregarding the pursuit of optimal splits. Hyperparameters of ET in this study are min_samples_leaf = 1, min_samples_splits = 2, n_estimators = 100, criterion = ‘gini’. AdaBoost (Ada),
33
also called adaptive boosting, is a well-established boosting algorithm pioneered by Freund and Schapire. Ada iteratively constructs a collection of base classifiers while adapting the instance weights. In particular, misclassified instances are assigned increased weights, and the updated instance weights are utilized for training subsequent base classifiers. The final prediction is derived by aggregating the outputs of the base learners using a weighted majority vote, where each classifier's contribution is weighted based on its performance. Hyperparameters of Ada in this study are n_estimators = 300, learning_rate = 0.5, algorithm = ‘SAMME’, base_estimator = ‘deprecated’. Gradient Boosting Machine (GBM)
34
is an extension of the Ada ensemble technique that offers flexibility in choosing various loss functions. Unlike Ada, GBM constructs base classifiers based on gradients rather than misclassified instance weights. Adopting GBM enhances the efficiency of base classifier fitting; nevertheless, it may result in suboptimal memory usage and increased processing time. Hyperparameters of GBM in this study are learning_rate = 0.08, n_estimators = 199, subsample = 0.8, min_samples_split = 7, min_samples_leaf = 4, max_depth = 8, min_impurity_decrease = 1.6e-08, max_features = 0.468. Extreme Gradient Boosting (XGBoost)
35
bears similarities to the GBM algorithm. However, in contrast to GBM, XGBoost constructs a new base classifier by utilizing second-order derivatives of the loss function. This approach in XGBoost is believed to offer increased precision and effectiveness compared to GBM. Hyperparameters of XGBoost in this study are objective = ‘binary:logicstic’, colsample_bytree = 0.5, learning_rate = 0.5, min_child_weight = 4, n_estimators = 161, reg_alpha = 1e-10, reg_lambda = 10, scale_pos_weight = 22.79. Light Gradient Boosting Machine (LightGBM)
36
is a novel gradient-boosting framework that has been widely applied to machine learning tasks and facilitates efficient parallel training, similar to XGBoost. The LightGBM algorithm integrates two cutting-edge techniques, respectively referring to the gradient-based one-side and the exclusive feature bundling methods. In contrast to GBM or XGBoost, LightGBM grows the tree vertically (i.e., leaf-wise tree growth), whereas other alternative algorithms extend their structures horizontally (i.e., level-wise tree growth). This makes LightGBM an effective algorithm for processing large-scale and high-dimensional data. Hyperparameters of LightGBM in this study are num_leaves = 185, learning_rate = 0.5, n_estimators = 300, min_child_samples = 100, reg_alpha = 0.04, reg_lambda = 1.097.
This study developed five base models and five stacking ensemble models ((1)ET + LightGBM, (2)ET + XGBoost + LightGBM, (3)ET + XGBoost + RF + LightGBM, (4)ET + XGBoost + RF + GBM + LightGBM, (5)ET + XGBoost + RF + GBM + Ada + LightGBM) to predict ECOG PS in liver cancer patients (Figure 2). The combination of base models in each stacking ensemble was determined based on their performance ranking using the “Area under the receiver operating characteristic curve” (ROC AUC) value. For instance, the stacking ensemble model (1) consisted of the top-performing base model and the meta-model. Similarly, the stacking ensemble model (2) included the two highest-performing base models along with the meta-model, and so on. Our first goal was to evaluate the efficacy of a single ML model that sought to predict ECOG PS in patients with liver cancer. The following goal was to explore the stacking model with the best prediction performance by stacking different base models with the meta-model.

Process flow diagram for predictive models.
The Python programming language was used to create all classification experiments. To facilitate the implementation of these models and to perform a rigorous evaluation, we leveraged several well-established Python libraries. Specifically, we utilized the “scikit-learn” library, a comprehensive machine learning toolkit, to access and utilize classifiers such as “AdaBoostClassifier”, “GradientBoostingClassifier”, “RandomForestClassifier”, and “ExtraTreesClassifier”. Additionally, we harnessed “lightgbm” and “xgboost” libraries for employing the “LGBMClassifier” and “XGBClassifier”, respectively.
In addition, the stratified 10-fold cross-validation (CV) technique was used to evaluate the models’ performance. The preprocessed training set with 971 patients was used for the CV process. During the stratified 10-fold CV process, the dataset was divided into 10 equal parts. In each iteration, nine of these folds (approximately 90% of the data, approximately 874 samples) were utilized for training the model, while the remaining one fold (approximately 10% of the data, approximately 97 samples) was reserved for validation to evaluate the model's performance. This process was repeated 10 times, with each fold serving as the validation set once, thereby ensuring a comprehensive and reliable assessment of the model's generalization capabilities. To implement the stratified 10-fold CV, we used the “StratifiedKFold” function from “scikit-learn”.
Benchmark deep learning model: TabNet
TabNet 21 is a deep learning model built on the framework of sequence multi-step processing. The architecture of TabNet facilitates feature selection and improves the capacity to learn high-dimensional features. After handling a d- dimensional feature vector, the nth stage of a Feature Transformer block produces an output. There are multiple levels in this feature transformer block, which are either universal to all decision stages or unique to a particular decision phase. Each block contains a batch normalization layer, a Gated Liner Unit (GLU) activation, and fully linked layers. Additionally, the GLU is connected to a normalization residual connection, which lowers the overall network's variance. This multi-layered block increases the efficiency of the network's parameters and helps with choosing features.
Figure 3 provides a full explanation of TabNet's architecture. Each phase consists of an attentive transformer, a mask, a feature transformer, a split node, and a ReLu activation. The steps are gradually raised by up to N steps before connecting to a fully linked layer and the output. Attentive Transformer includes a fully linked layer, batch normalizing, prior scaling, and sparsemax dimensionality reduction. The mask function yields significant feature contributions for aggregate.

Tabnet's architecture.
The TabNet model used in this study was created with pytorch_tabnet version 4.0. The Optuna framework also fine-tuned TabNetl's hyperparameters. The optimized hyper-parameters of the TabNet model in this work are as follows: ‘mask_type’ = ‘entmax’, ‘n_da’ = 64, ‘n_steps’ = 6, ‘gamma’ = 1, ‘n_shared’ = 4, ‘lambda_sparse’ = 2.53e-06, ‘bn_momentum’ = 0.9997, ‘patienceScheduler’ = 10, ‘patience’ = 24, ‘epochs’ = 92, ‘optimizer_fn’ = ‘torch.optim.adam.Adam’.
Performance evaluation metrics
In this study, the performance of prediction models was assessed using accuracy, precision, recall, and F1-score. These metrics are computed using the formulas below:


In addition, we also employed the “Area under the receiver operating characteristic curve value” (ROC AUC) to evaluate the performance of models. The ROC AUC is given as
In our investigation, it was presumed that a model with the highest ROC AUC had the best prediction ability. If the ROC AUC remained constant, the model with the greatest F1 score was deemed the best.
Local interpretable model-agnostic explanations (LIME)
The LIME 39 framework is an interpretable machine learning approach that provides explanations for predictions produced by “black box” machine learning models at the instance level. LIME conducts experiments by manipulating data instances and observing the impact on model predictions. By generating a new dataset via adjustments such as noise addition, word removal, or image manipulation, LIME trains an interpretable model (e.g., linear regression, decision tree) that is weighted based on the sampled instances’ proximity to the target instance. This methodology enables LIME to approximate the local behavior of the underlying model and generate more interpretable explanations.
LIME's primary goal is to offer an explanation that is reliable and comprehensible. To achieve this, LIME minimizes the following objective function:
Results
Evaluation of SMOTE-ENN method
We assessed the performance of base models with default hyperparameters to determine whether rebalancing the dataset using the SMOTE-ENN method would be necessary. The evaluation results are presented in Table 2. When utilizing the original training set, the default base models achieved a minimum ROC AUC of 0.7503 (ROC AUC of the default Ada model). However, due to the issue of imbalanced data, the default GBM model only achieved a recall of 0.4626 for this training set. Notably, the prediction models exhibited significant improvement in performance when trained on the rebalanced training set using the SMOTE-ENN technique. In particular, the default ET model demonstrated superior performance compared to other models in this dataset. It achieved an excellent ROC AUC of 0.9699, accuracy of 0.9125, precision of 0.9080, recall of 0.9544, and F1- score of 0.9301. These results highlight the importance of rebalancing the training set in this study, as it played a crucial role in significantly enhancing the performance of the prediction models.
Comparison performance between imbalanced data and rebalanced data.

Random Forest Classification model = RF, Extra Tree Classification model = ET, AdaBoost Classification model = Ada, Gradient Boosting Classification model = GBM, Extreme Gradient Boosting Classification model = XGBoost.
Results of feature selection
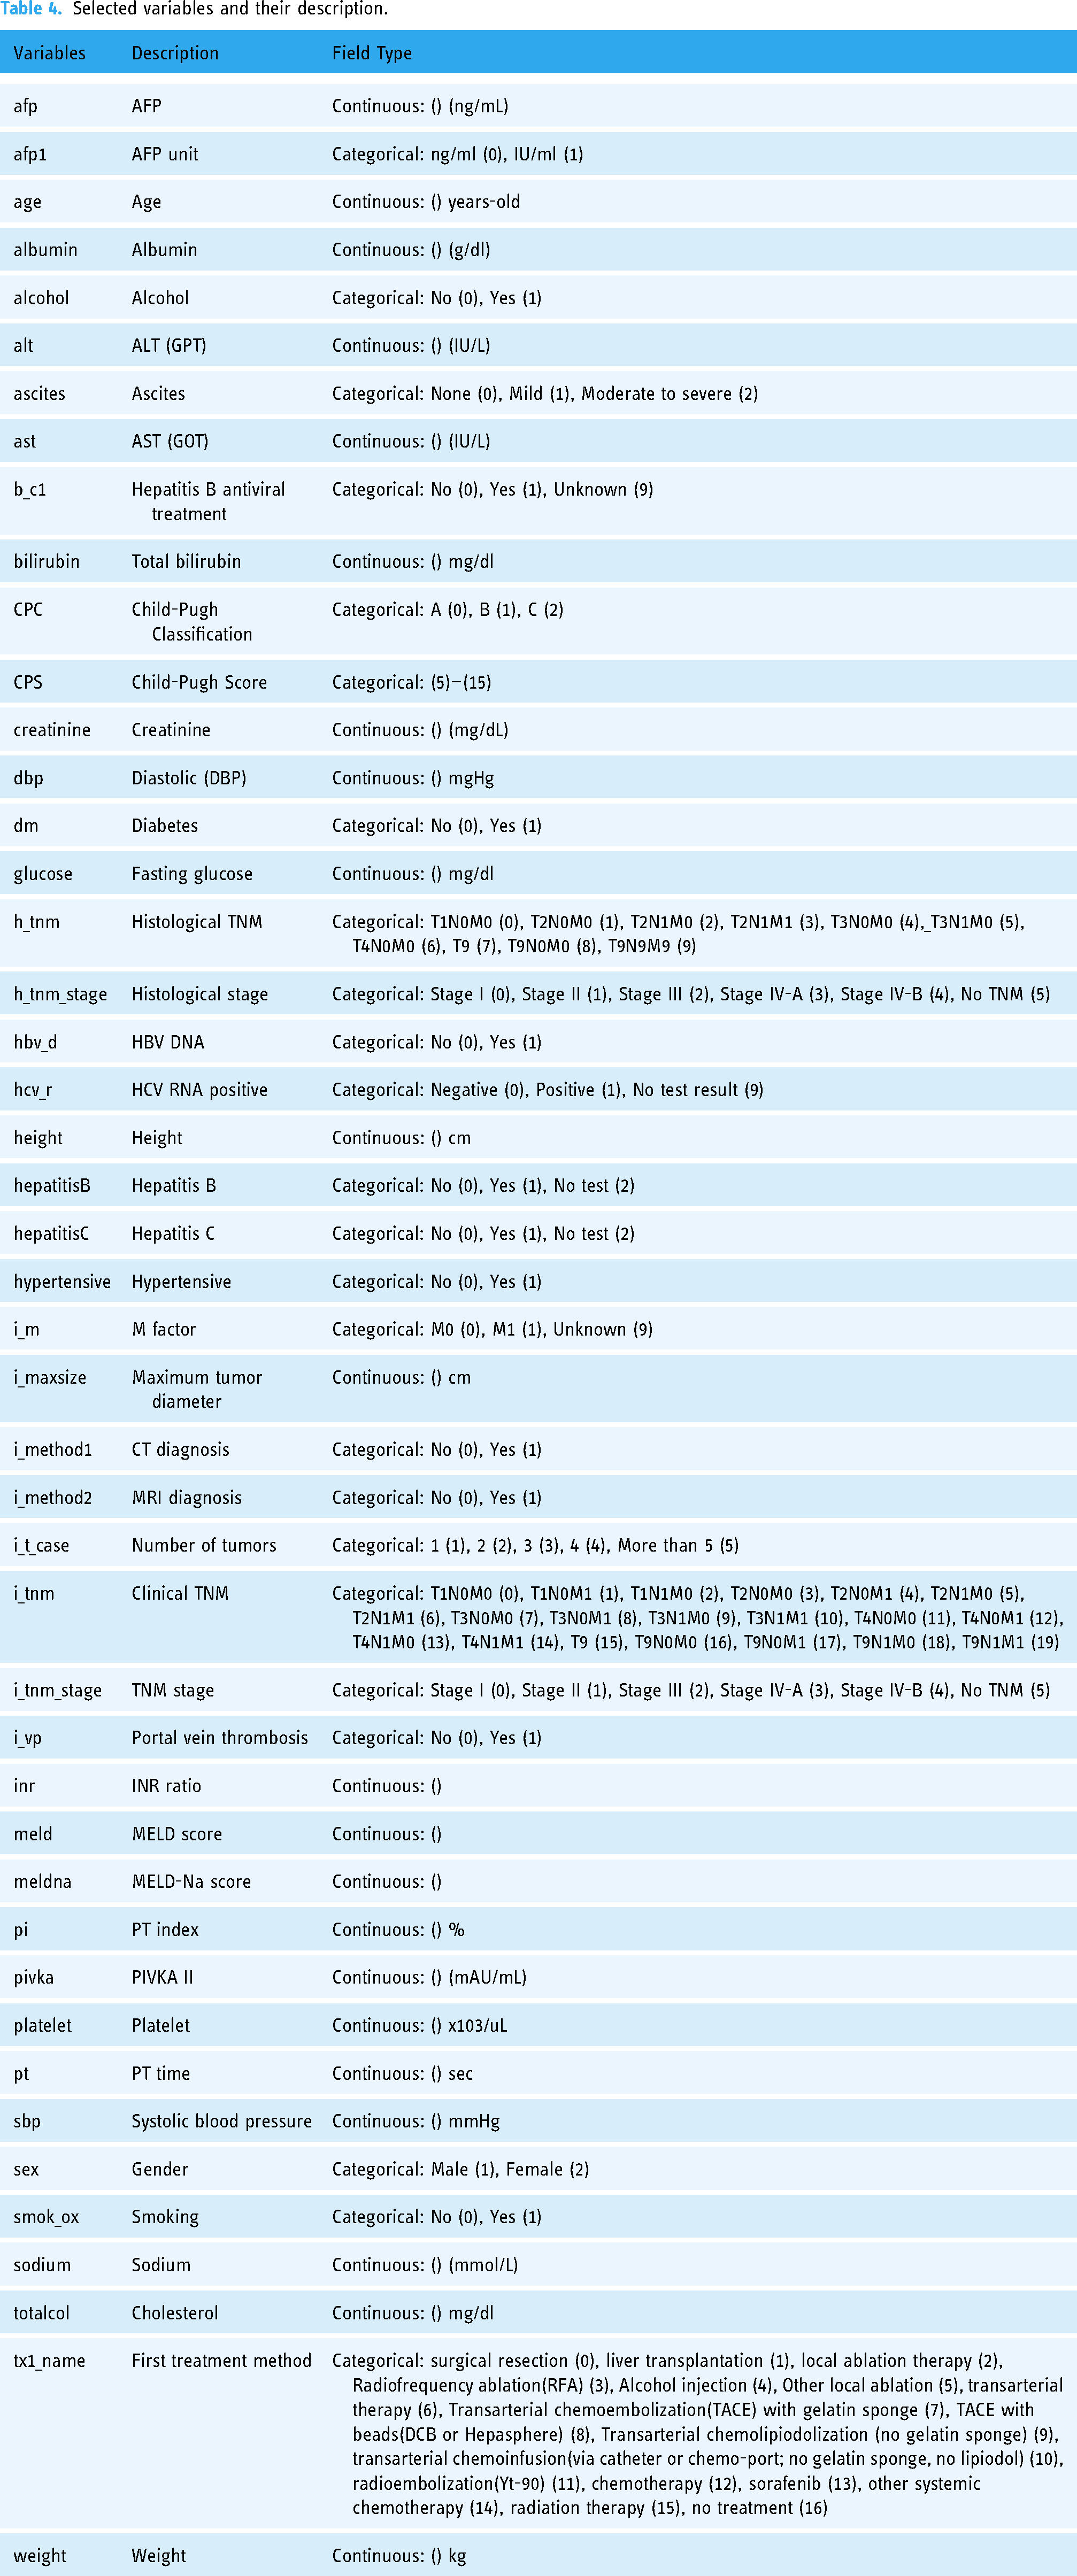
After obtaining key features selected by RF, ET, Ada, GBM, and XGBoost embedded methods, we utilized the base models with default hyperparameters to assess the performance of feature selection methods. Table 3 displays the comparison results. When all features were included, the default ET model outperformed other models with a ROC AUC of 0.9699. The default ET model was also superior to the different models when applying all feature selection methods. The highest ROC AUC of the default ET model was 0.9722 when features were picked using the ET feature selection approach. In this study, out of 56 variables, only 46 features selected by the ET feature selection method were used to optimize single prediction models and identify the best stacking ensemble model. The details of these 46 variables are provided in Table 4.
ROC AUC of the default base models for each feature selection method.
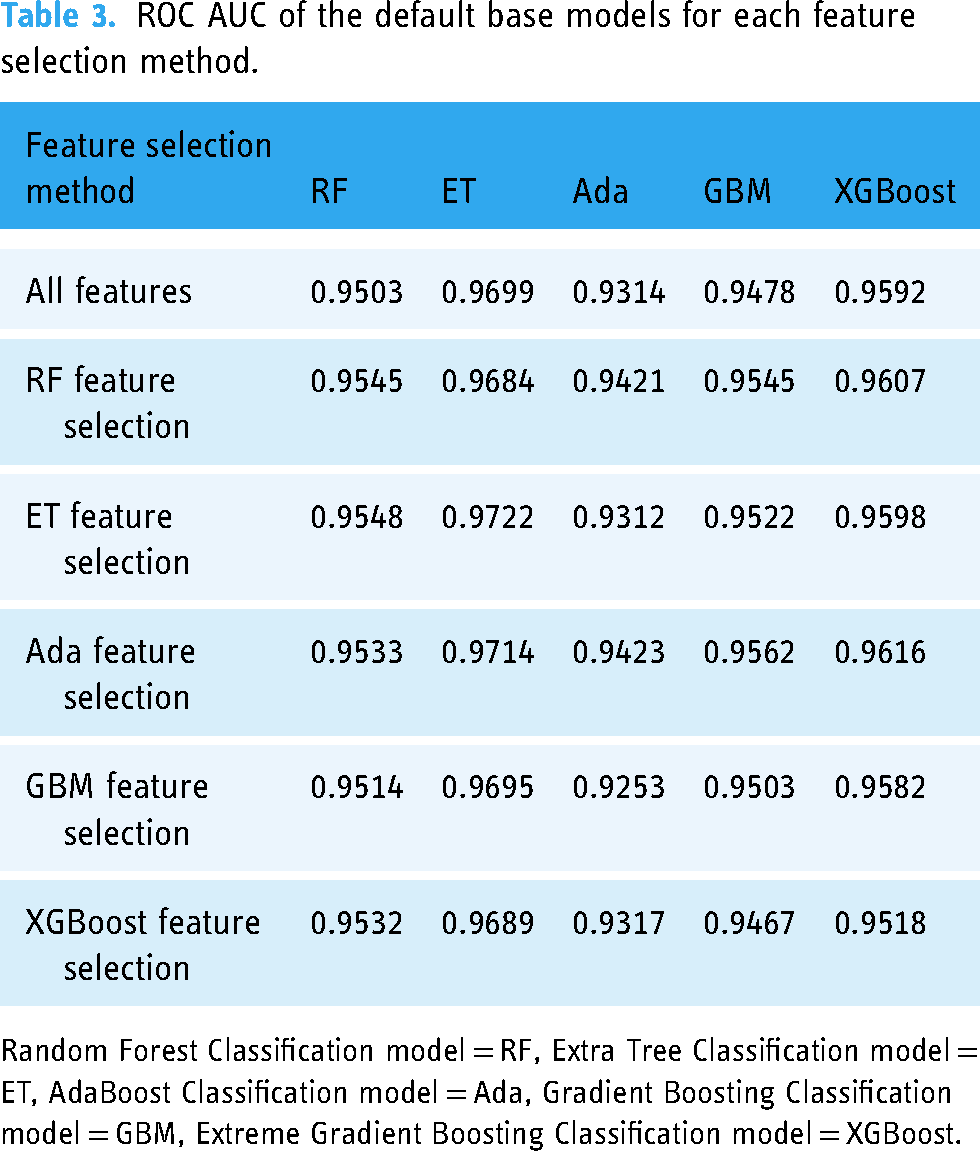
Random Forest Classification model = RF, Extra Tree Classification model = ET, AdaBoost Classification model = Ada, Gradient Boosting Classification model = GBM, Extreme Gradient Boosting Classification model = XGBoost.
Selected variables and their description.
Comparison of optimized models
Table 5 displays the predictive performance of optimized single models, including five base models (RF, ET, Ada, GBM, and XGBoost) and the benchmark deep learning model (TabNet), for predicting ECOG PS in patients with liver cancer. Among numerous single models, the ET model's ROC AUC of 0.9722 was the highest. In terms of F1-score (0.9341) and accuracy (0.9177), the ET also outperformed other models. According to Table 3, the ROC AUC of base models were 0.9722 (ET), 0.9522 (GBM), 0.9598 (XGBoost), 0.9522 (GBM), and 0.9312 (Ada) before optimization. Except for the ET model, which did not exhibit a significant increase in ROC AUC when the value was rounded to four decimal places, the other base models exhibited a significant improvement in ROC AUC after optimization. On the other hand, the TabNet model obtained a ROC AUC of 0.8774. Other evaluation metrics, such as accuracy, precision, recall, and F1-score, also demonstrated that TabNet did not perform as well as tree-based ensemble models for our dataset. TabNet was outperformed by all of the base models in this study.
Comparison performance of optimized single models.

Random Forest Classification model = RF, Extra Tree Classification model = ET, AdaBoost Classification model = Ada, Gradient Boosting Classification model = GBM, Extreme Gradient Boosting Classification model = XGBoost, TabNet Classification model = TabNet.
The performance of the five stacking models is outlined in Table 6. All stacking models outperform single models, with ROC AUC values greater than 0.98. ROC AU C score increased proportionally when further the base models were combined. The analysis results confirmed that the Stacking 5 mode (ET + XGBoost + RF + GBC + Ada + LightGBM), which combines all five base models with the LighGBM metamodel, was superior. This model achieved ROC AUC of 0.9826, accuracy of 0.9352, precision of 0.9474, recall of 0.9477, and F1-score of 0.9464.
Performance of five stacking models.

Stacking 1 = ET + LightGBM, Stacking 2 = ET + XGBoost + LightGBM, Stacking 3 = ET + XGBoost + RF + LightGBM, Stacking 4 = ET + XGBoost + RF + GBM + LightGBM, Stacking 5 = ET + XGBoost + RF + GBM + Ada + LightGBM, Random Forest Classification model = RF, Extra Tree Classification model = ET, AdaBoost Classification model = Ada, Gradient Boosting Classification model = GBM, Extreme Gradient Boosting Classification model = XGBoost.
During the evaluation on the test set, the Stacking 5 model exhibited superior performance compared to other models, achieving a ROC AUC of 0.9675, as depicted in Figure 4. Notably, all other stacking models also outperformed single base models, with ROC AUC values surpassing 0.96. The confusion matrix presented in Figure 5 illustrates the performance of the Stacking 5 model on a total of 651 patients in the test set. Among the patients belonging to class 0, the model correctly predicted 403 out of 461 cases, resulting in a true negative rate of 87%. For patients in class 1, the model accurately predicted 186 out of 190 cases, yielding a true positive rate of 98%. These results further validate the efficacy and effectiveness of the proposed stacking model for predicting the ECOG PS in liver cancer patients.

All models’ ROC curves on the test set.

Confusion matrix of stacking five model on the test set.
Evaluation of LIME-based stacking ensemble model
To demonstrate how the LIME model collaborates with the stacking ensemble model to predict the ECOG PS of a patient with liver cancer, we specifically selected one instance to analyze. Figure 6 describes a liver cancer patient with “restricted performance status”. The patient's condition and the contributing factors are outlined in Figure 6(c). In a total of 46 variables, we compiled the states of a patient by the 10 features that had the most impact as follows:
hypertensive = 0 (Hypertensive: No) CPC = 0 (Child-Pugh Classification: A (0)) i_m = 1 (M factor: M1 (1)) CPS = 5 (Child-Pugh Score: 5) afp = 100,000 (AFP: 100,000 ng/mL) ascites = 2 (Ascites: Mild (1)) ast = 232 (AST (GOT): 232 IU/L) albumin = 3.6 (Albumin: 3.6 g/dl) smok_ox = 1 (Smoking: Yes (1)) i_vp = 1 (Portal vein thrombosis: Yes (1))

Example of a prediction for a lung cancer patient with physical activity restricted.
Our stacking ensemble model predicted that the patient would have restricted performance status with a probability of 100%, shown in Figure 6(a). Figure 6(b) depicts the LIME methodology. The blue bars represent the variables that significantly contribute to the prediction's rejection, whereas the orange bars represent the states and factors that considerably contribute to the prediction's support. According to the explanation, at the time of the prediction, “i_m”, “afp”, “ast”, “albumin”, “smok_ox”, and “i_vp” were the target's main factors and states that most contributed to the prediction.
After applying LIME to all testing data in cases of liver cancer patients with restricted performance status, we assessed the relative contributions of factors for predicting ECOG PS in liver cancer patients. With a weight of 11.83%, the “hypertensive” contributed the most to model prediction, while the “CPC” contributed 10.09%. The “i_m”, “totalcol”, and the “CPS” were responsible for 9.05%, 8.22%, and 7.62% of the weights, respectively. The best five variables contributed nearly 47% to the prediction. The top variables for liver cancer patients’ ECOG PS prediction were arranged in detail, as shown in Figure 7.

LIME-based stacking ensemble model's top features for predicting “restricted performance status.”
Discussions
This study compared the performance of ten machine learning algorithms and one deep learning algorithm in predicting ECOG PS in patients with lung cancer and confirmed that the ET + XGBoost + RF + GBM + Ada + LightGBM model obtained the highest predictive performance. The results were in line with earlier studies18,40,41 that discovered the accuracy of the stacking ensemble model to be superior to that of the single machine learning model. Byeon 41 demonstrated that the stacking ensemble model outperformed the single machine learning model in terms of accuracy, variance of errors, and index of agreement, suggesting that it might perform better in terms of prediction for structured data. Our investigation confirms this assertion.
This study also discovered how crucial the feature selection strategy was to the effectiveness of the model. Once the number of selected features exceeds a certain threshold, the prediction outcomes of all models become stable, and adding more features does not improve the accuracy of the models but significantly increases the computational burden. Using the ExtraTree feature selection method, Arya et al. 42 outperformed earlier studies with their diabetes disease prediction model. Our model also utilized the ExtraTree feature selection method to reduce from 56 to 46 variables, thereby decreasing execution time and enhancing performance. Additionally, by lowering noise, the hyperparameters can be tweaked with a broader range of values without taking excessive time to execute, leading to a more efficient model.
Currently, there is a notable scarcity of studies focusing on prediction models for the ECOG PS in liver cancer patients. Only a few studies14–16 have developed machine learning models to predict ECOG PS, and these studies primarily concentrated on lung cancer patients. Among these studies, the XGB model proposed by Agrawal et al. 15 achieved the highest performance, with a ROC AUC of 0.81. However, our proposed model in this study surpassed the performance of previous studies, achieving a ROC AUC of 0.9826 on the training set and 0.9675 on the test set. This noteworthy improvement in performance highlights the effectiveness of our approach. The key distinction lies in the fact that previous studies solely employed single classifier models, such as LR, XGBoost, and Ada. In contrast, our proposed model harnessed the power of the stacking ensemble method, which combines multiple base classifiers to generate a more accurate and reliable meta classifier. 17 By leveraging the strengths of various classifiers, our model outperforms any single base classifier alone. Furthermore, to the best of the authors’ knowledge, this study is the first to develop an explainable stacking ensemble model for predicting ECOG PS specifically in liver cancer patients.
According to previous research, Arik et al. 21 revealed that TabNet outperforms eXtreme Gradient Boosting (XGBoost), a well-known performance leader for learning from tabular data. Shwartz-Ziv et al. 43 and Fayaz et al. 44 countered that XGBoost outperforms TabNet across all datasets, including the datasets used in the study that established the TabNet model. In the previous study, while developing an Adaboost model for predicting ECOG PS of lung cancer patients, Nguyen et al. 16 also compared the AdaBoost model to the TabNet model and demonstrated that AdaBoost outperformed TabNet in the case of predicting ECOG PS in lung cancer patients. This study confirmed that AdaBoost and other boosting models, such as GBM and XGBoost, were also superior to the TabNet model in the case of predicting ECOG PS in liver cancer patients. In addition, the stacking ensemble models also achieved higher performance than the TabNet model in this study. Until recently, studies comparing the performance of TabNet and boosting models utilizing disease data have been insufficient; thus, further study is needed in the future.
The significance of this work is that we developed a LIME-based stacking ensemble model to predict ECOG PS in liver cancer patients in order to explain the patient's ECOG PS assessment of AI in a way that medical practitioners can understand. Moreover, our model might contribute to a more objective prediction of ECOG PS, thereby reducing heterogeneity and reliance on subjective classification by individual doctors during patient evaluation. Therefore, our LIME-based stacking ensemble model has the potential to become a helpful tool for predicting patients’ ECOG PS in liver cancer objectively and to aid healthcare practitioners can adapt their treatment approach more effectively.
Limitations
The limitations of this investigation are as follows. First, the dataset is unbalanced and insufficiently large; hence, our model is unable to generate the same results with 5- score levels as the ECOG measurement. In order to have a complete state of ECOG PS in the target feature and a balanced dataset, we need to collect more data in future studies to develop a superior model. Second, we only got important features utilizing embedded feature selection methods such as RF, ET, Ada, GBM, and XGBoost. Future studies need to go deeper into methods for feature selection, such as filter methods, wrapper methods, ensemble feature selection methods, and features chosen by medical specialists in order to improve the model's performance. Lastly, LIME explanations may lack stability or consistency as they can vary depending on the samples used or the selection of local data points for the local model. Therefore, the interpretations provided by LIME for our model should be subject to thorough discussion and evaluation by medical experts.
Conclusions
The Eastern Cooperative Oncology Group performance status (ECOG PS) is a crucial measure used to evaluate the functional abilities of cancer patients and predict their prognosis. It holds significant importance in guiding treatment decisions made by medical professionals. In this research, we developed a novel prognosis predictor model for predicting the ECOG PS of liver cancer patients undergoing treatment. Our proposed model is based on a stacking ensemble approach, which combines several base models, including Extra Trees (ET), XGBoost, Random Forest (RF), Gradient Boosting Machine (GBM), and AdaBoost. The meta-model used in our ensemble is LightGBM. In addition, the proposed model integrated a LIME-based explainability model with the stacking ensemble model to explain the interpretability of the prediction model comprehensively and correctly. The evaluation of our proposed model yielded highly promising results, with a ROC AUC of 0.9826 on the training set and 0.9675 on the test set. These outcomes outperformed the results obtained from single classifier models used in previous studies. Our LIME-based stacking ensemble model demonstrates significant potential in becoming a valuable tool for objectively predicting patients’ ECOG PS in liver cancer cases. By offering more accurate predictions, it can assist healthcare practitioners in adapting their treatment approach more effectively, leading to improved patient outcomes.
Footnotes
Contributions
Conceptualization, H.V.N. and B.H; software, H.V.N.; methodology, H.V.N. and B.H; validation, H.V.N. and B.H; investigation, H.V.N. and B.H; writing—original draft preparation, H.V.N.; formal analysis, B.H; writing—review and editing, B.H; visualization, H.V.N.; supervision, B.H; project administration, B.H; funding acquisition, B.H. All authors have read and agreed to the published version of the manuscript.
Data Availability Statement
The data presented in this study are provided at the request of the corresponding author. The data is not publicly available because researchers need to obtain permission from the Korea Centers for Disease Control and Prevention.
Declaration of conflicting interests
The authors declared no potential conflicts of interest with respect to the research, authorship, and/or publication of this article.
Funding
The author(s) disclosed receipt of the following financial support for the research, authorship, and/or publication of this article: This research Supported by Basic Science Research Program through the National Research Foundation of Korea (NRF) funded by the Ministry of Education (NRF-2018R1D1A1B07041091, NRF-2021S1A5A8062526) and the National R&D Program for Cancer Control through the National Cancer Center (HA23C02410061582062860001) and local government-university cooperation-based regional innovation projects (2021RIS-003).
Institutional Review Board Statement
The study was carried out in accordance with the Helsinki Declaration and was approved by the Korea Workers’ Compensation and Welfare Service's Institutional Review Board (or Ethics Committee) (protocol code 0439001, date of approval 31 January 2018).
Informed Consent Statement
Informed consent was obtained from all subjects involved in the study.