
Abstract
Objective
In this study, we propose a method for removing artifacts from superficial electromyography (sEMG) data, which have been widely proposed for health monitoring because they encompass the basic neuromuscular processes underlying human motion.
Methods
Our method is based on a spectral source decomposition from single-channel data using a non-negative matrix factorization. The algorithm is validated with two data sets: the first contained muscle activity coupled to artificially generated noises and the second comprised signals recorded under fully unsupervised conditions. Algorithm performance was further assessed by comparison with other state-of-the-art approaches for noise removal using a single channel.
Results
The comparison of methods shows that the proposed algorithm achieves the highest performance on the noise-removal process in terms of signal-to-noise ratio reconstruction, root means square error, and correlation coefficient with the original muscle activity. Moreover, the spectral distribution of the extracted sources shows high correlation with the noise sources traditionally associated to sEMG recordings.
Conclusion
This research shows the ability of spectral source separation to detect and remove noise sources coupled to sEMG signals recorded during unsupervised daily activities which opens the door to the implementation of sEMG recording during daily activities for motor and health monitoring.
Introduction
The adoption of new technologies by large population groups has paved the way for the emergence of what is known as the “digital health era”, in which people are encouraged to take up new digital media technologies to engage in health self-monitoring.1,2 This trend has been further accentuated since 2020, when the COVID-19 pandemic triggered a situation in which people were requested to socially distance and reduce visits to hospitals and other health centers.3,4 Governments and health organizations have promoted the development and implementation of self-monitoring networks to reduce health care system burden and improve societal health.5–7
Feasible self-monitoring is usually based on cheap and easy-to-use technologies that actually target societal needs. Some examples are self-measurement of blood glucose by people with diabetes 8 and heart beat monitoring for athletes and people with heart disease.9,10 It is likely that new self-monitoring technologies will be adopted by the general populace in the coming years.
The monitoring of muscle activity during daily life has been proposed for the early diagnosis and treatment of the age-related loss of muscle mass known as sarcopenia, 11 head, neck, and back pain, 12 and anxiety. 13 Moreover, superficial electromyography (sEMG) has been extensively studied and correlated to the basic neuromuscular processes underlying human motion. 14 For these reasons, daily logging of sEMG signals will likely play an important role in the future of health monitoring. Although the recording of muscle activity during daily life presents several challenges, 15 sEMG can now be acquired using wearable and increasingly inexpensive devices.16–19
In general, sEMG signals present a high signal-to-noise ratio (SNR) compared with other physiological signals such as electroencephalography and magnetic resonance images. In the laboratory, it is relatively simple to create experimental conditions in which artifacts affecting sEMG are suppressed or controlled. However, it becomes more challenging in the analysis of large amounts of data recorded during unsupervised daily tasks. The wide range of environmental and behavioral changes during daily activities generates huge variability in signal quality because the noises affecting muscle recordings during these conditions present heterogeneous distributions and are difficult to predict. Therefore, the identification and removal of noises during unsupervised recordings are one of the main challenges facing the implementation of daily health logging systems based on this technology.
Noise sources for sEMG signals are mainly divided into three groups: white Gaussian noise (WGN), which has an equally distributed spectrum; power line interference (PLI), which mainly affects 50/60 Hz (depending on the country); and low-frequency artifacts (LFAs), which include electrocardiography (for electrodes around the chest) and a range of disturbances produced by motion (e.g. electrode vibration, hanging wires, and wireless data loss).20,21
Raw sEMG signals have a bandwidth in the approximate range of 10–200 Hz.22,23 Regular bandpass filtering is normally accepted to reduce LFAs and WGN while a common technique to remove PLI is the application of a 50/60-Hz Notch filter.24,25 However, this approach is not time discriminant; that is, it requires a priori knowledge of the noises affecting the signals and also assumes that the noises have a homogeneous distribution and temporal modulation. These assumptions can be true under controlled conditions but should not be made during unsupervised recordings.
Previous studies with high-density sEMG (HD-EMG) arrays have proposed noise removal methods based on source separation approaches such as canonical correlation analysis21,26 and independent component analysis (ICA). 27 Their aim was to separate sEMG from noise components by using redundant information recorded from several electrodes placed on the same muscle. These approaches are strongly dependent on the amount of spatial information available.
For daily logging of sEMG data, the use of HD arrays is not always a feasible option. Apart from the increased cost associated with HD-EMG arrays, not all muscles are large enough to allow multiple simultaneous sEMG recordings. Aware of this issue, Mijovic et al. proposed a generalized noise source separation method from single-channel biological signal recordings that combines empirical-mode decomposition (EMD) (to decompose a signal into spectrally separated sources) and ICA (to extract statistically independent sources). 28 This technique was successfully validated with experimental data recorded under laboratory conditions and compared with other similar approaches. However, EMD decomposition assumes that the spectral components extracted are present throughout the signal under analysis. In this case, the limitations of EMD analysis during fully unsupervised conditions are unclear.
However, it is clear that the development and validation of a method for sEMG artifact removal during fully unsupervised activities is currently lacking a state-of-the-art application of this technology. For this reason, the current work proposes a novel algorithm for the analysis of sEMG data with the two following main goals: (a) the effective detection of noise sources from data recorded during fully unsupervised conditions, and (b) the development of a noise removal technique that allows the discrimination of valid sEMG data from large and highly contaminated signals.
Our approach targets the separation of muscle activity from noise sources by using a non-negative matrix factorization (NMF) over the signal spectrum. To perform such a decomposition, the NMF algorithm extracts common spectral patterns from a number of signals. Redundancy is achieved by the temporal segmentation of the signal into overlapping epochs. The data used for source extraction are the normalized spectral magnitude of those epochs. This article describes the proposed methodology and compares its performance with that of regular bandpass filtering and of the method proposed by Mijovic et al. 28 Two different data sets were used to validate methodology performance. A set of sEMG signals combined with artificially created noises was used to compare the signal reconstruction performance among methods. In addition, to show the effects of each method on real data, a second set of signals recorded during fully unsupervised conditions was used.
Materials and methods
Conceptual source decomposition
In general, most of the power of raw sEMG signals is contained in a frequency range between 10 and 200 Hz,22,23 with an approximate energy distribution as presented in Figure 1(A). Although the noise sources might overlap the spectral distribution of sEMG data, they present independent modulation. This means that, with enough information, the spectrum of sEMG signals contaminated with different noise sources (Figure 1(B)) can be decomposed into signal and noise components. Figure 1(C) shows an approximate graphical representation of the spectral distribution associated with the three main noise sources affecting sEMG signals (LFAs, PLI, and WGN). 21 The present work focuses on the detection and removal of these sources by using redundant information extracted from temporally shifted signal epochs.

Spectral sources. (A) Spectral distribution associated with sEMG signals. (B) Spectral distribution of sEMG activity coupled to noise sources. (C) Spectral distributions of the main noise sources affecting sEMG signals: white Gaussian noise (WGN), low-frequency artifacts (LFAs), and power line interference (PLI).
General workflow
Figure 2 shows the general workflow of the methodology presented in this work. First, single-/multi-channel signals are segmented (Figure 2—segmentation) and the spectrum of each epoch is computed and normalized (Figure 2—spectral computation). Standardized spectrums undergo a NMF where the noise sources are decoupled from the sEMG spectrum (Figure 2—source separation). Then, noise source contributions are removed from each epoch, leaving only the contribution related to sEMG activation (Figure 2—filter design/noise removal). Clean epochs are shifted back to the time domain and the final signal is reconstructed by the temporal arrangement of all of the clean epochs. The technical details of each stage are provided in Appendix 1.

General workflow. Stages of the proposed algorithm for sEMG noise removal. Temporal signals are segmented into L-length epochs with an O-overlap prior to a spectral extraction and normalization through a fast-Fourier transform. Spectral information undergoes non-negative matrix factorization to separate the sEMG information from the noise sources. Based on this decomposition, epoch-specific filters are designed to remove the relative spectral contributions associated with the noise sources. After filtering, the remaining spectral distribution, associated with sEMG information, is turned into the time domain. Finally, the original signal is reconstructed from all clean signal epochs.
Noise removal
After source decomposition, the spectrum of each epoch (


Method comparison
To test the proposed methodology, the extraction and removal of noise sources was compared among three different methods. The first comprised a regular bandpass and notch filtering (hereinafter, RFilt), the second was based on the approach introduced in this work (hereinafter, FFT-NMF), and the third used the EMD-ICA approach previously introduced in the literature. 28 The technical details of the parameter tuning for each method can be found in Appendix 2.
The NMF and ICA source separation techniques require a priori selection of the number of sources from which data will be decomposed. Four sources were selected in both methods (FFT-NMF and EMD-ICA) (one source representing the sEMG data and three sources representing WGN, PLI, and LFA noises). Both source separation algorithms return randomly arranged components. Therefore, to avoid biases generated by a visual component arrangement, the sources extracted were rearranged according to their similarity to the model spectrums shown in Figure 3. These signals are a simplification of the spectral magnitudes associated with each expected spectral source. Similarity was tested by computing the coefficient correlation matrix between the sources extracted from each session and the modeled spectral distributions. The highest coefficient values were used to rearrange the data.

Modeled spectral distributions. A simple model of the spectral distribution associated with sEMG signals and the three main noise sources described (WGN, LFAs, and PLI). This model is used as a common reference point for the rearrangement of the sources extracted from the FFT-NMF and EMD-ICA methods.
Two data sets were used to validate and compare methodology performance. The first data set included single-channel sessions in which sEMG data recorded under laboratory conditions were combined with different distributions of artificially generated noise sources (including LFAs, PLI, and WGN). The second data set comprised sessions of sEMG data recorded during unsupervised daily activities.
Data set 1: artificial noises
Artificial noise data generation
Figure 4 describes the process followed to include artificial noises into sEMG data recorded under laboratory conditions. A 10-min session of sEMG recordings was combined with three types of noises with spectral distributions corresponding to those associated with LFA, PLI, and WGN noises.
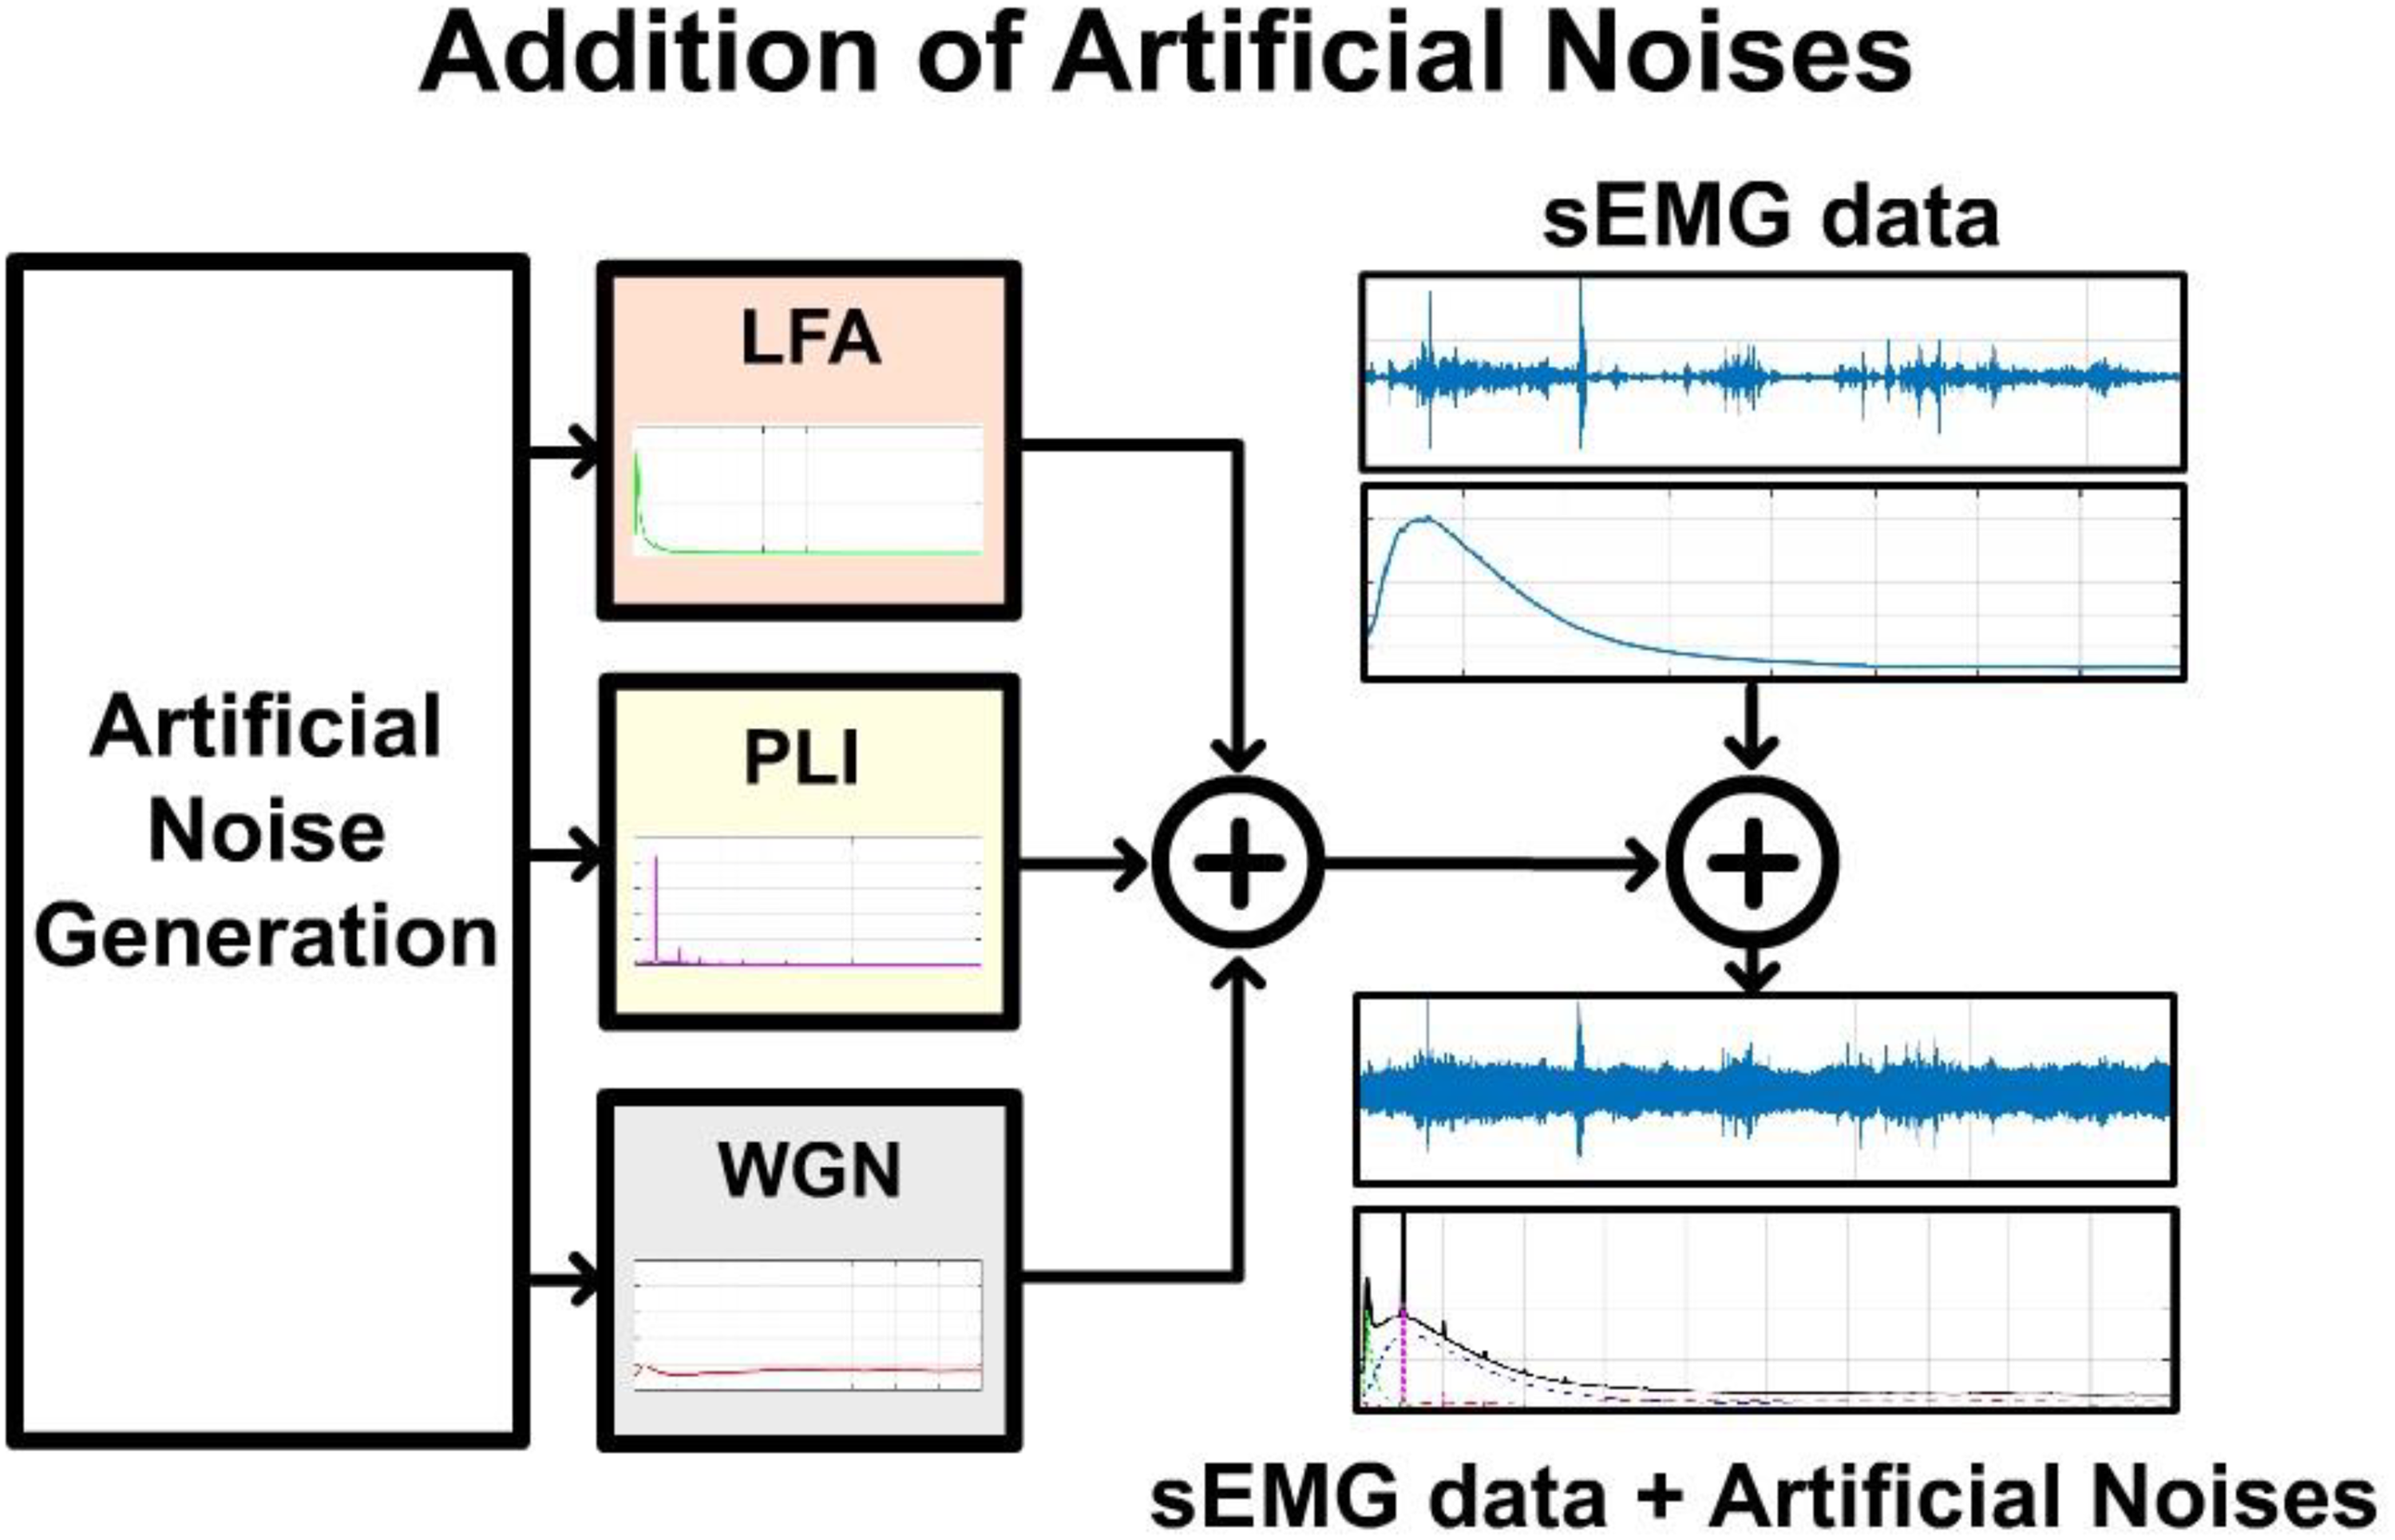
Addition of artificial noises. sEMG signal recorded under controlled conditions is coupled with three different noise sources generated artificially following the spectral distributions associated with white Gaussian noise, low-frequency artifacts, and power line interference.
Noise source modulation and their temporal features were randomized to achieve the unstable behavior expected from unsupervised recordings. Figure 5 describes the details for noise generation and sEMG data acquisition. Figure 5(A) shows a 10-min sEMG signal recorded from the sternocleidomastoid muscle of a healthy subject under laboratory conditions. The subject was instructed to sit in a chair and wait for 10 min. During the waiting period, the subject was allowed to perform any desired postural changes and head motions. The fast-Fourier transform (FFT) of the data presented in the right graph of Figure 5(A) shows the spectral distribution of the power of the data.

Artificial noise generation. (A) A temporal and spectral representation of the sEMG data used to generate the data from data set 1. (B) Each artificial noise source added to sEMG data was described by two vectors: the normalized noise source (NNS) (containing time data with the spectral distribution associated with a specific noise source) and the noise appearance vector (NAV) (containing information about noise appearance timings and amplitude). (C) The normalized noise sources were computed from white Gaussian noise generated from random values. The spectral magnitude and phase of each vector were computed through a fast-Fourier transform (FFT). Magnitudes were modified according to the expected spectral distribution of each noise source. Finally, the NNS was computed as the inverse fast-Fourier transform (IFFT) of the original phase and the modified magnitude. (D) Algorithm followed for the computation of the noise appearance vector. An iterative process generates activation periods with a length, amplitude, and position randomly selected from an amplitude vector (AV), length vector (LV), and the available positions given by the length of the sEMG signal (P). The iterative process finishes when noise activations reach 80% of the total signal length.
Figure 5(B) shows the elements required for noise generation. Each noise source was described by two vectors. The first was a 10-min normalized noise source (NNS) in which the spectral distribution corresponded with one of the three main noises affecting sEMG data. The second was a 10-min vector defining the noise appearance periods and modulating its amplitude (NAV) during the 10-min session. The element-by-element multiplication of both vectors defined the features and behavior of a single noise source during a single session. Figure 5(C) shows the process followed to generate the NNS. First, a random 10-min vector was generated with values between 1 and −1 (top-left graph—Figure 5(C)). The spectrum of this vector was computed through a FFT and divided into its magnitude and phase (note that its magnitude behaves as WGN with an equally distributed spectrum). The noise source spectral distributions modeled in Figure 3 were used to fit the computed magnitude into the spectral distribution expected for LFAs, PLI, or WGN. The modified magnitude and its original phase were used to reconstruct the signal in the temporal domain by an inverse FFT (IFFT). Finally, the temporal signal was normalized between 1 and −1.
For NAV generation (Figure 5(D)), several parameters were considered. Each noise source was set to be active for 80% of the total session duration (8 out of 10 min). Moreover, to decide the length and amplitude of each activation period, two vectors were used. These vectors, amplitude vector (AV), and length vector (LV), were defined as:


Data set generation
The process described in Figure 4 was repeated 100 times for each
Method performance validation
The results obtained from this data set were used to compare the performances of each method regarding the separation of sEMG signals from noise sources. For that purpose, the original SNR data were compared to the SNR predicted from each method after source decomposition. Efficiency in signal and noise reconstruction was quantified by two parameters. The first parameter was the root mean square error (RMSE), computed as:
Data set 2: unsupervised sEMG recordings
Experimental set-up
Unsupervised sEMG data were acquired using a medium density band recording 8 channels from 16 bipolar electrodes (Figure 6(B)) with a sampling frequency of 2000 Hz. A single electrode located in the area of the sternocleidomastoid muscle was selected for analysis. The system included a belt pouch with a battery providing autonomy of around 10 h. Every 10 min, a data file was stored in a SD card (Figure 6(C)).

sEMG recording system and set-up. (A) A subject wearing the whole system for neck sEMG recordings. (B) Detailed view of the neck sEMG band. (C) sEMG recording system including the SD card for data storage, battery for 10-h autonomy, and hand button for external flag generation.
Participants
Five patients with neck pain were requested to wear the sEMG band shown in Figure 6(A). They were instructed on how to set up the recording device and all of them provided signed informed consent according to the Declaration of Helsinki. No further instructions were given, and the participants were asked to continue with their normal daily activities.
Data set
Each patient recorded around 5 h of muscle activity. Thirty 10-min recordings were extracted from each patient, giving a total of 150 10-min sessions (30 sessions × 5 patients).
Data evaluation
This data set was used to visualize the spectral distribution of sEMG and the noise sources extracted by the RFilt, FFT-NMF, and EMD-ICA methods during real unsupervised sEMG recordings. Moreover, the separability between spectral component pairs was quantified for each method as their Bhattacharyya distance (Bdist), first introduced by Bhattacharyya et al. 29 This parameter is closely related to the Bhattacharyya coefficient, which measures the amount of overlap between two statistical samples or populations. Bdist can provide any value in the range 0 < Bdist < ∞, with larger values associated with higher class separability.
Details of the study
Patients’ sEMG data was fully recorded by them during their daily lives in Saitama and Tokyo Prefectures in Japan during periods that varied between 4 and 17 days. The conceptualization of the experiment, generation of artificial noises, and recordings of clean sEMG signals were performed at the same time in the facilities of Riken in Nagoya. Data analysis, results extraction, and interpretation were done during the following months also in Riken's laboratory in Nagoya.
Results
sEMG reconstruction performance
The signal/noise decomposition performance for each method was assessed by using the data set including real sEMG data coupled to artificially created noises (data set 1) in which the original sources and SNR were known. Figure 7(A) compares the SNR of the original data with that predicted from source decomposition using the RFilt, FFT-NMF, and EMD-ICA methods. Each boxplot represents the SNRs of 100 10-min sessions associated with different values of the SI, as shown on the x-axis (original SNR, blue; FFT-NMF-predicted SNR, green; EMD-ICA-predicted SNR, red; RFilt-predicted SNR, orange). As designed, the real SNR (blue) decreases with an increasing variability of noise appearance. The predicted SNRs presented significant differences for the RFilt, FFT-NMF, and EMD-ICA methods, both compared with original SNR and among each other. However, the SNR predicted by the FFT-NMF algorithm exhibited higher accuracy and less variability that predicted by the RFilt and EMD-ICA methods, which showed a significantly higher standard deviation for all values of the SI. Moreover, the RFilt method presented significantly lower performance in SNR prediction and was also more affected by noise stability than the methods based on source decomposition.

sEMG reconstruction performance. (A) Comparison between the signal-to-noise ratio of the signals from data set 1 (blue) and the signal-to-noise ratio predicted by FFT-NMF (green), EMD-ICA (red), and RFilt (orange) methods. (B) Root mean square error between the original sEMG data and the sEMG data reconstructed by FFT-NMF (green), EMD-ICA (red), and RFilt (orange) methods. (C) Correlation coefficient between the original sEMG data and the sEMG data reconstructed by FFT-NMF (green), EMD-ICA (red), and RFilt (orange) methods.
Figure 7(B) and (C) uses the same boxplot format to show the RMSE and correlation coefficients between the original sEMG data and the sEMG data reconstructed by each method (FFT-NMF, green; EMD-ICA, red; and RFilt, orange). For each SI value, the FFT-NMF method showed less RMSE (error recovering the energy of the original data) and a higher correlation coefficient (shape similarity to original data) than the RFilt and EMD-ICA methods. The increase in the noise variability (a decrease in the SI) produced, in the three methods, a decrease in the energy and shape reconstruction performance. This phenomenon was stronger in the sEMG data extracted using the RFilt method. Moreover, the FFT-NMF algorithm showed a more stable reconstruction (lower standard deviation) for lower stability values (0.7 ≥ SI ≥ 0.1).
Real data analysis

Sources extracted by FFT-NMF and EMD-ICA. sEMG and noise sources extracted from data set 2 and rearranged according to the model spectral distributions defined in Figure 3. (A) Sources extracted from FFT-NMF. (B) Sources extracted from EMD-ICA. (C) Bhattacharyya distances computed for each pair of sources. (D) Example of the FFT-NMF algorithm used to remove artificial noises coupled to clean sEMG signals.

Noise removal results. Two examples of the FFT-NMF algorithm applied to data recorded during fully unsupervised recordings. Graphs on the left show the temporal information of raw and clean recordings. Graphs on the right show the spectral properties of the signals under analysis. The three data periods labeled as 1*, 2*, and 3* show the ability of the algorithm to remove WGN, PLI, and LFA sources.
Finally, Figure 10 shows an example of the RFilt, FFT-NMF, and EMD-ICA methods applied to a highly contaminated session where most of the recorded data was noise. The blue data represent the raw recorded data while the orange data represent the signal after noise removal for each method. The effects on the spectral domain can be seen in the respective FFTs presented in the right graphs.
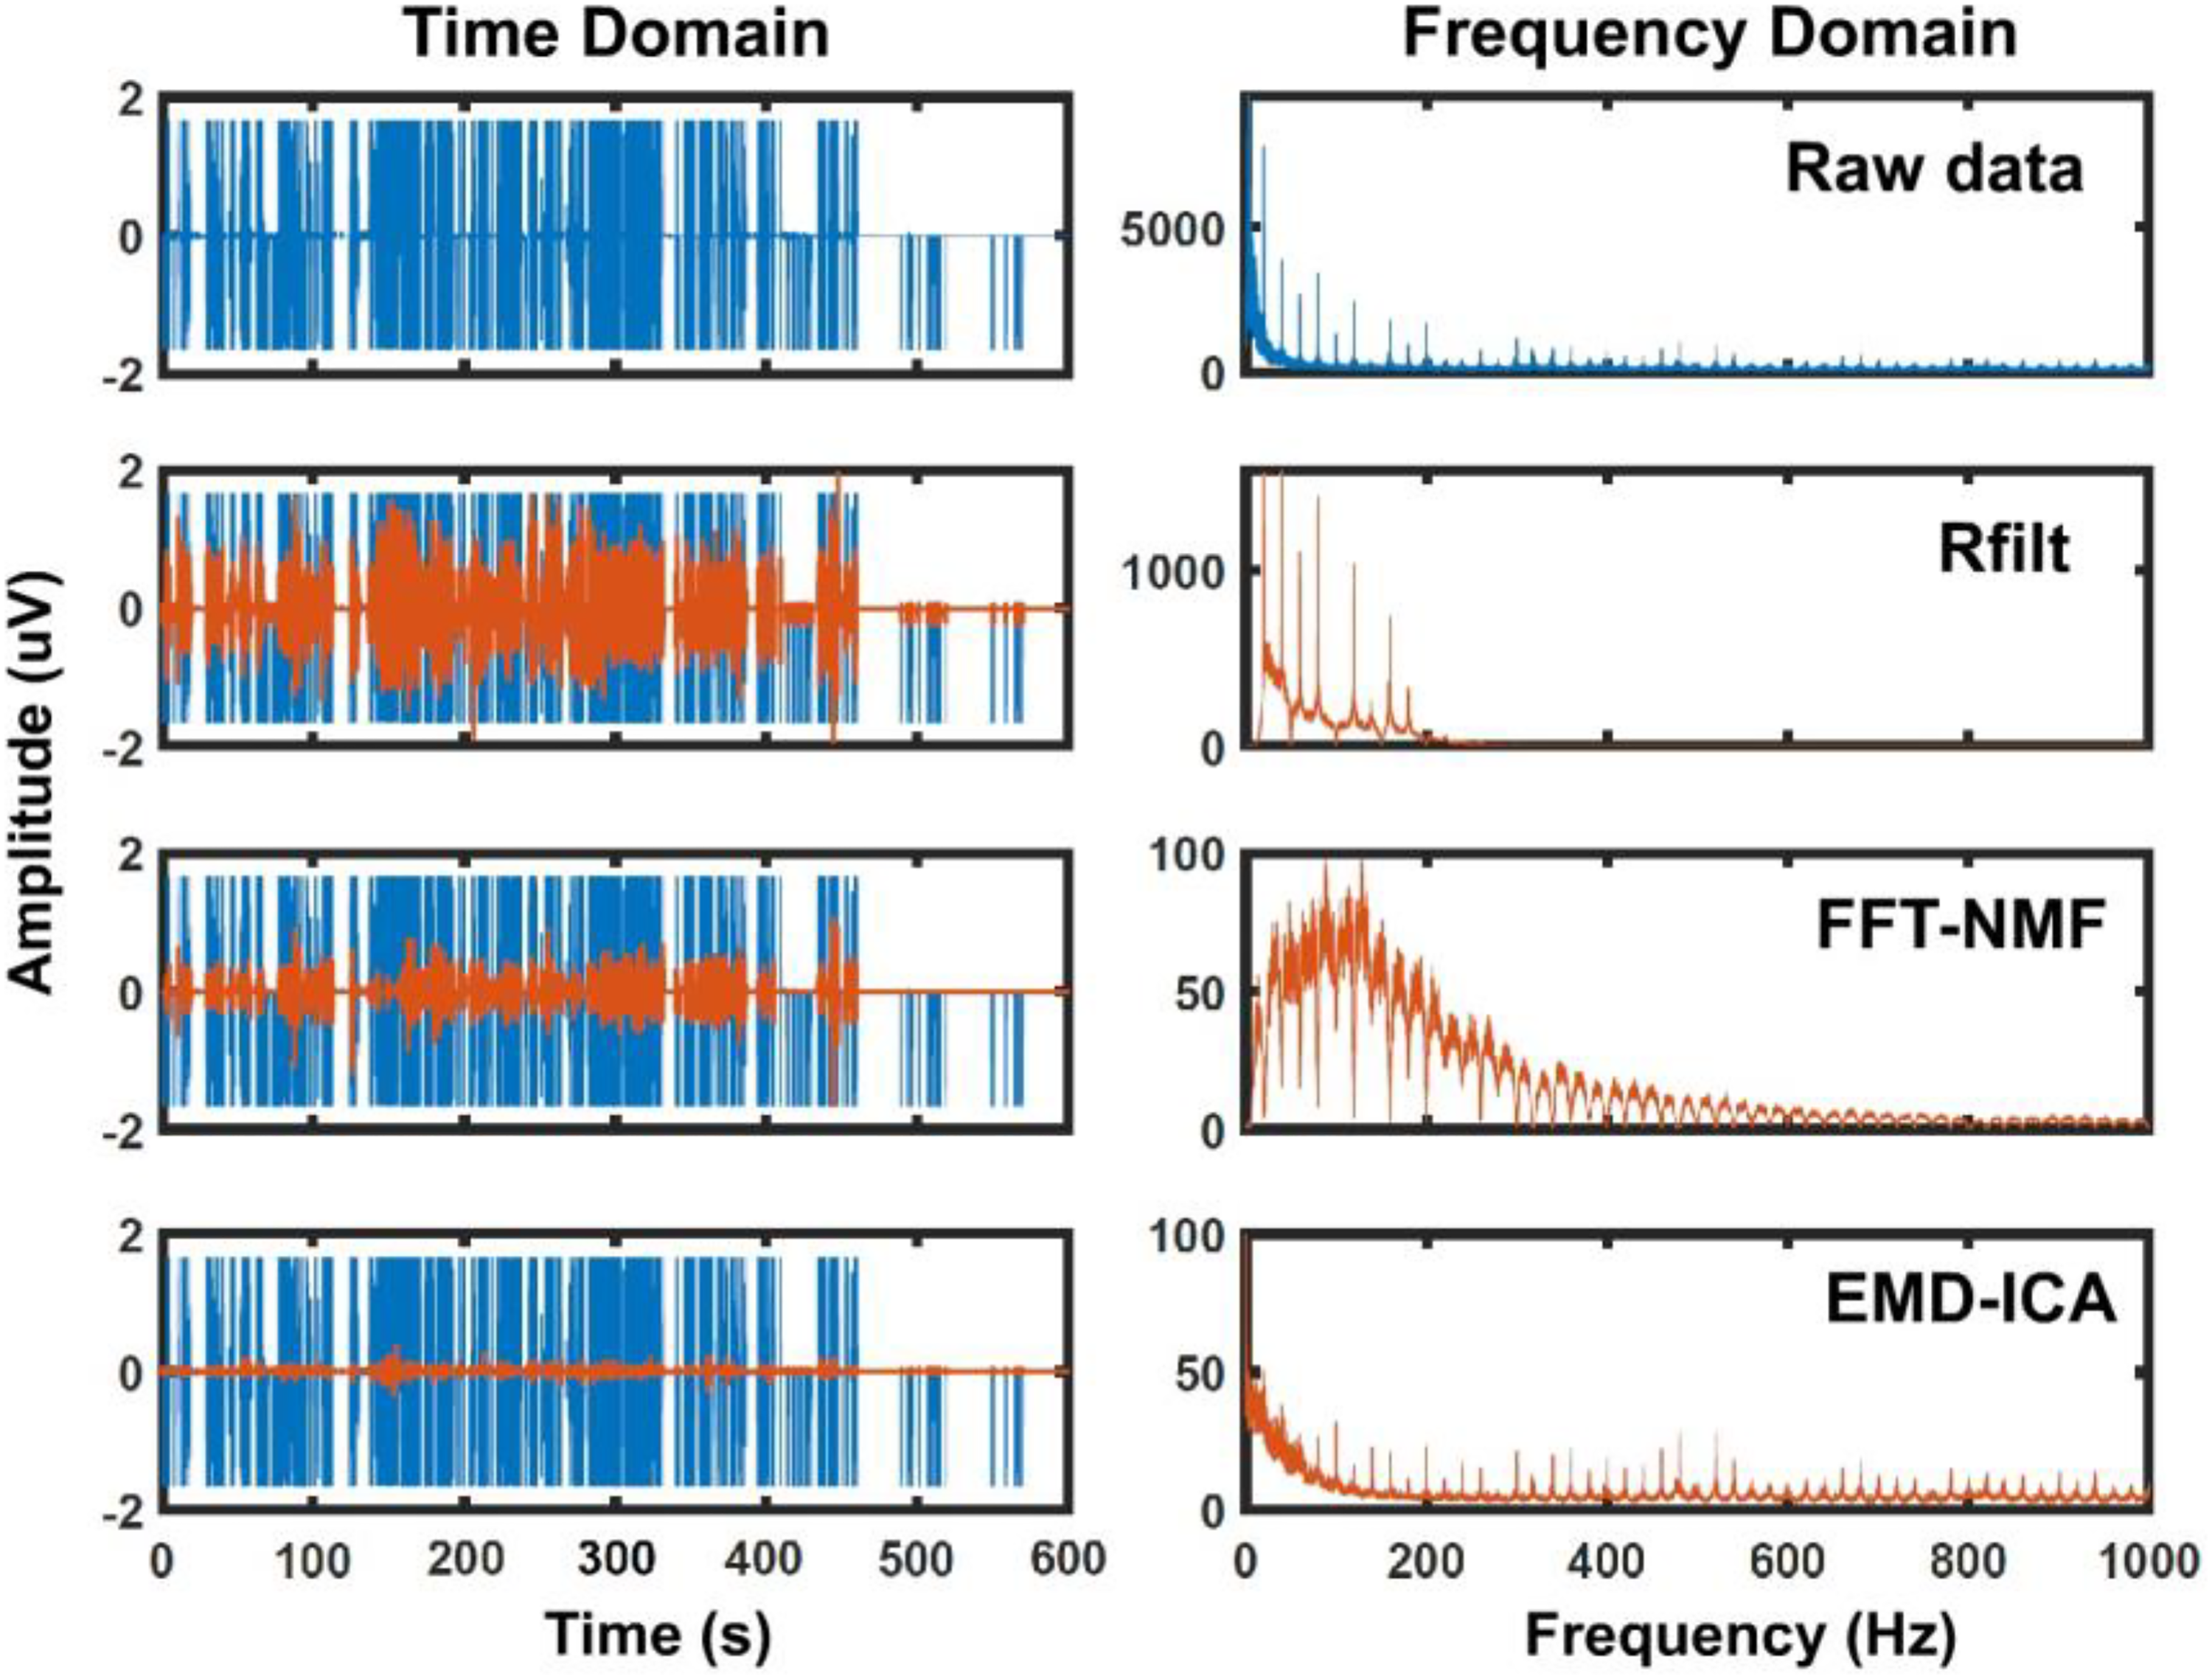
Example of highly contaminated data. Example of each method applied to highly contaminated data. The left graphs show the temporal domain of a single 10-min session. The blue signal shows the raw data while the orange signals represent the clean data after the application of each method. The right graphs show the frequency domain computed from a fast-Fourier transform between 0 and 1000 Hz.
Discussion
To the best of our knowledge, the current work presents the first method for the effective detection and removal of noise sources from sEMG recordings during fully unsupervised daily activities. The method can be fully automated after establishment of the number of sources (four in the case of this article) and their spectral distributions (Figure 3). Depending on the data set under analysis, the number of sources and the model of their spectral distribution can be tuned to increase method performance.
The method was compared to traditional signal filtering and to a state-of-the-art approach (EMD-ICA) previously introduced in the literature. 28 The FFT-NMF method showed higher performance both when reconstructing the original sEMG data and when predicting the SNR (Figure 7). The segmentation of the original data into overlapping epochs generates sufficient signal redundancy for the extraction of common spectral sources, which allows its application to both single- and multi-channel recordings. Moreover, epoching decouples time and frequency domains, which improves the detection of sources whose contributions are not stable in time. The results also show that traditional noise removal (RFilt) is more affected by higher noise variabilities than FFT-NMF and EMD-ICA methods (Figure 7). The sources extracted with the FFT-NMF algorithm present a spectral distribution that correlates with the main noises affecting sEMG data (Figure 8(A)). 20 Such a correlation was not found in the sources extracted using the EMD-ICA method, at least when applied to fully unsupervised recordings (Figure 8(B)). The epoch-specific filters generated by the FFT-NMF method allow fine-tuning of the spectral bands and power reduction in accordance with the noises affecting the data in each time period (Figure 9).
In addition, OSR and SNR indices allow the detection of temporal periods of interest that can be used to estimate the physiological meaning of the cleaned signals. Finally, the FFT-NMF algorithm allows a signal reconstruction for illustrating which spectral features present a similar distribution to the one expected from sEMG signals (Figure 10).
The effectiveness of the current algorithm is strongly related to the number of noises coupled to the sEMG signals because the redundancy in their spectral distributions over time allows the extraction of the spectral pattern associated with each noise. The algorithm might present limitations if applied to large data sets that present a very low amount of coupled noises because there will not be enough redundant noise information to extract common spectral patterns between epochs. Moreover, researchers interested in applying the current methodology should carefully check the origins of the LFA noises coupled to their signals. Given the multi-origin nature of these noises, the fine-tuning of their reference spectral distribution could be vital for the proper detection and removal of these artifacts.
Conclusion
This research shows the ability of spectral source separation to detect and remove noise sources coupled to sEMG signals recorded during unsupervised daily activities. The algorithm presented showed a better performance than traditional and other state-of-the-art methodologies for noise removal, which opens the door to the implementation of sEMG recording during daily activities for motor and health monitoring.
As mentioned in the Introduction, social trends toward subject engagement with self-health monitoring and the development of increasingly cheap and wearable sEMG devices put this technology in the early mass adoption stage. Under this scenario, the first big challenge of people in charge of sEMG big data analysis will be artifact removal and discrimination of valid muscle activity. In this regard, the current methodology was developed as a tool for the treatment of large sets of sEMG data recorded during fully unsupervised daily activities. Our method provides a robust basis for the preliminary treatment and classification of data recorded under highly variable conditions.
Nevertheless, there are still several challenges that remain to be addressed to further improve this implementation. One of the outstanding challenges is in the development and inclusion of hardware-specific modules in the amplification stage of sEMG sensors that apply the proposed algorithm during recording. Moreover, future researches must address the characterization of the spectral distribution of other potential noises affecting sEMG signals.
Finally, in future works, this methodology will be used to treat sEMG signals recorded during the daily lives of people in age ranges where muscle conditions such as back and neck pain, and sarcopenia present their first symptoms, potentially enabling for their early detection and treatment. The effects of artifact reduction on the later stage of signal processing and analysis of sEMG signals must also be discussed according to the results of future works.
Footnotes
Acknowledgments
The authors would like to thank the Toyota Motor Corporation for their promotion of this work and the Saitama Neuropsychiatric Institute for assisting with recruitment of participants for this research.
Authors’ Note
Álvaro Costa-García, National Institute of Advance Industrial Science and Technology, Chiba, Kashiwa, Japan; Shotaro Okajima, Nagoya University, Aichi, Nagoya, Japan; Shingo Shimoda, Nagoya University, Aichi, Nagoya, Japan.
Contributorship
ACG and SS researched the literature and conceived the study. ACG, NY, and SO were involved in methodology development, data recording, and analysis. SO and SS contributed to the recruitment of participants. ACG wrote the first draft of the manuscript. All authors reviewed and edited the manuscript and approved the final version of the manuscript.
Declaration of conflicting interests
The authors declared no potential conflicts of interest with respect to the research, authorship, and/or publication of this article.
Ethical approval
The study was conducted in accordance with the guidelines of the Declaration of Helsinki and was approved by the Institutional Review Board of Riken (Reference Wako3 28-13). Informed consent was obtained from all participants involved in the study.
Funding
The authors disclosed receipt of the following financial support for the research, authorship, and/or publication of this article: This research was supported by the Toyota Motor Corporation and a JSPS KAKENHI grant (number 18K18431).
Guarantor
ACG accepts responsibility for the overall integrity of the manuscript (including ethics, data handling, reporting of results, and study conduct).