
Abstract
Objective
Structured diabetes education has evidenced benefits yet reported uptake rates for those referred to traditional in-person programmes within 12 months of diagnosis were suboptimal. Digital health interventions provide a potential solution to improve diabetes education delivery at population scale, overcoming barriers identified with traditional approaches. myDiabetes is a cloud-based interactive digital health self-management app. This evaluation analysed usage data for people with type 2 diabetes focusing on digital structured diabetes education.
Methods
Descriptive quantitative analyses were conducted on existing anonymised user data over 12 months (November 2019–2020) to evaluate whether digital health can provide additional support to deliver diabetes education. Data was divided into two equal 6-month periods. As this overlapped the onset of COVID-19, analyses of its effect on usage were included as a secondary outcome. All data was reported via myDiabetes. Users were prescribed myDiabetes by National Health Service healthcare primary care teams. Those who registered for app use within the study period (n = 2783) were assessed for eligibility (n = 2512) and included if activated.
Results
Within the study period, n = 1245/2512 (49.6%) registered users activated myDiabetes. No statistically significant differences were observed between gender (p = 0.721), or age (p = 0.072) for those who activated (59.2 years, SD 12.93) and those who did not activate myDiabetes (57.6 years, SD 13.77). Activated users (n = 1119/1245 (89.8%)) viewed 11,572 education videos. No statistically significant differences were observed in education video views across age groups (p = 0.384), gender (p = 0.400), diabetes treatment type (p = 0.839) or smoking status (p = 0.655). Comparison of usage pre-COVID-19 and post-COVID-19 showed statistically significant increases in app activity (p ≤0.001).
Conclusion
Digital health is rapidly evolving in its role of supporting patients to self-manage. Since COVID-19 the benefits of digital technology have become increasingly recognised. There is potential for increasing diabetes education rates by offering patients a digital option in combination with traditional service delivery which should be substantiated through future research.
Introduction
Type 2 diabetes (T2D) is a serious and growing health concern affecting 90% of the 4 million patients with a current diagnosis of diabetes in the United Kingdom.1,4 Prevalence of T2D is increasing with many millions undiagnosed, and even more at risk. 2 The incidence of T2D could rise even further following COVID-19 where quarantine and lockdown have led to an estimated 41% of adults in England gaining weight.5,6 Being overweight or obese is a primary cause of T2D 3 leading to commitments within the National Health Service (NHS) Diabetes Prevention Programme for weight management and support. 7 Importantly T2D is preventable and manageable through lifestyle modifications.6,8 A sedentary lifestyle, poor diet, smoking and uncontrolled glycaemia are also major factors contributing to disease onset and progression.9,10
People with diabetes often have regular contact with healthcare providers but generally they must self-manage their health on a daily basis. 11 To achieve and maintain good health effectively, patients must be provided with diabetes-specific education to promote self-management. 12 Educating patients with long-term health conditions, and encouraging self-management leads to positive health outcomes and lessens the economic impact on healthcare services.4,8,9 Diabetes structured education meets a nationally agreed criteria as defined by NICE and should be offered at diagnosis. 13 It provides people with diabetes the skills, knowledge and confidence to stay healthy and prevent complications; promoting behaviour change and encouraging lifelong effective self-management skills.7,8,12,14,15
Regardless of the evidenced benefits of structured diabetes education, the National Diabetes Audit 2018 to 2019 reported that 73% of newly diagnosed patients were referred, with only 13.2% attending within 12 months of diagnosis in England. 4 Despite the likelihood of these figures being under reported, there are many people missing out on this essential education. 14 Barriers to attendance are multifactorial including personal circumstances such as work or caring commitments, individual perceptions and lack of interest, as well as distance and timing of course delivery.16,17 Prior to the COVID-19 pandemic, group based in-person courses were the established mode of delivery and varied in structure from half a day up to 5 days depending on location. 18 To promote increased attendance, alternative methods of delivery were, and are continuing to be, considered including online learning, and the use of digital interventions.
Digital health interventions such as wellness, self-care and activity applications (apps) have been shown to promote healthy behaviours such as smoking cessation, reduced alcohol intake, support exercise and eating a healthy diet. 19 Furthermore, recent evidence shows they can improve outcomes for patients with long-term conditions including diabetes, respiratory and cardiovascular disease.19,22 Importantly, they can provide remote access to healthcare. Pre-pandemic the uptake of digital health technologies was slow,23,24 however with the emergence of COVID-19, they became an immediate necessity and digital health adoption was greatly accelerated within healthcare service delivery.15,25 NHS Digital reported a 111% usage increase in NHS app registrations. 26
myDiabetes is a Qismet accredited interactive cloud-based digital self-management app. It has been available for use from 2016 and began its full integration into NHS service delivery in 2018 to 2019. For the patient, it provides a platform to enter and store data to track progress, and access relevant health and lifestyle information through educational videos including content to encourage exercise. In total, the app hosts 40 videos, of which 17 are structured diabetes education adhering to criteria set by The Patient Education Working Group 27 and 1 is an introduction to myDiabetes (see Supplementary 1). Additionally, there are a further 15 educational videos including how to use each app component, why self-management is important, connecting Bluetooth devices such as blood pressure and blood glucose monitors, as well as activity trackers. The remaining videos include a graduated 6-week exercise course for all abilities, seated or standing. In addition to the videos, the app enables users to record clinical measurements such as blood sugar, glycated hemoglobin (HbA1c), blood pressure, weight and body mass index, all of which are stored in easy to read graphs so users can track their progress. A checklist is provided to prompt users to input these metrics as well as reminding users to access certain videos such as smoking cessation, retinopathy screening, and structured education. Users can record their medication in the medication diary and set reminders. All app content is designed by diabetes clinical experts to promote and support self-management of diabetes.
Furthermore, myDiabetes provides a tool to improve service efficiency as clinicians can access patient data providing the opportunity for clinical oversight and co-management. A recent study evaluating 120 diabetes self-management mobile health applications rated myDiabetes highest for quality using the Mobile Application Rating Scale, content of provided persuasive system design principles and self-management tasks. 28 As yet, little is known about how users engage with a digital app for diabetes education.29,30 In particular, it is unclear whether patients with T2D are more likely to access diabetes education courses when provided through an app. This 12-month evaluation is the first review of myDiabetes retrospective real-world data, conducted to provide insight into app usage and its ability to promote structured diabetes education access.
Methods
The primary outcome of this study was to explore in-app education usage over 12 months between November 2019 to 2020. Secondary outcomes included app activation, clinical data input, other in-app usage including exercise and smoking videos, medication diary access, and any variations in app usage. For app activity, data were evenly split into two 6-month periods. This allowed comparison of activity across the two periods to assess any changes in usage. As these periods also included data during COVID restrictions, for simplicity these were labelled pre-COVID (November 2019–May 2020) and post-COVID (June 2020–November 2020). Despite COVID-19 affecting healthcare service delivery some months earlier in March 2020, this date split was chosen to minimise the risk of bias in favour of the app and reported as a secondary outcome only.
App users
NHS Trusts and primary care services who have access to myDiabetes licenses provide patients with the app to support self-management and remote monitoring through a registration process. To be able to use myDiabetes, patients must be aged 18 years and above, have access to the internet and use of mobile technology, are able to operate a web platform in English, and have been provided with access by their healthcare team.
Healthcare teams managing diabetes are provided with extensive training on how to use the app as the expectation is, they will then provide the users with detailed guidance and support. myDiabetes encompasses versions for both type 1 diabetes and T2D and users are required to select their diabetes type. Following registration to myDiabetes, patients must activate the app to be able to access it. At activation patients are asked which diabetes type they are diagnosed with to be able to access the appropriate app content, they are then able to specify subtype, that is, diet, medication or insulin controlled.
Study design and procedure
Secondary myDiabetes user data was extracted from the my mhealth app server to create an isolated dataset. Data is reported through myDiabetes and a non-attributable user key is created within the app to enable anonymised analysis. Criteria for evaluation included adults over 18 years of age, users who were registered and activated between the specified time period with a type 2 diagnoses.
Data collection and analysis
Ethical approval was obtained through the University of Southampton Ethics Committee (ERGO: 64680). 31 Patients who activated the myDiabetes app and agreed to the terms and conditions of use 32 and privacy policy 33 were granted access to the app. This process included agreeing to their anonymised data being used for evaluation purposes.
Descriptive quantitative analyses were conducted using IBM SPSS V26 to explore app usage. All data was reported via the app. Usage data was separated into video views and clinical data entries. Activity in the app was described for all users across the 12 months by the total number of different days the app was accessed during this time. Where data was skewed, analysis was conducted using median and interquartile range (IQR), and where data was normally distributed mean and standard deviation (SD) were used. Depending on data distribution, hypothesis testing of continuous data was analysed using Kruskal–Wallis and Dunn's pairwise comparisons if skewed. Where data was evenly distributed a two-tailed analysis of variance parametric t-test in pairwise comparisons was conducted.
Comparisons were made between video views, clinical data entries, days of app use and demographic data including age and gender. For analysis, age was grouped for all activated users in 5 year groups: < 33, 34 to 48, 49 to 64, 65 to 78 and ≥79 years. 34 For all hypotheses, alpha was set at 5% and 95% confidence intervals reported. Potential outliers were assessed visually through scatter and box plots. Where observations were identified as outliers they were checked against the myDiabetes server data to ensure no errors were made in data extraction. Outliers that were not data errors were kept to show typical variations that are expected within real-world settings.
Results
Sample characteristics
A total of 2512 users with a T2D diagnosis were registered by clinicians to use myDiabetes between November 2019 to 2020. After registration, 1245 (49.6%) users activated the app. Those who did not complete app activation were categorised as failed to activate (n = 1267 (50.4%); Figure 1).

Flowchart showing users included in evaluation according to inclusion criteria.
There were no statistically significant differences between gender where reported (n = 1,043, p = 0.721), or age between those who activated (59.2 years, SD 12.93) and those who did not activate the app (57.6 years, SD 13.77), p = 0.072. Of those who activated the app (n = 1245), the mean recorded age for males was 60.6 years (SD 12.75) and 57.7 years (SD 12.37) for females.
Diabetes treatment type was reported by 1167 (93.7%) users. The age of those reporting T2D tablet controlled was 57.7 (SD 12.13) years, T2D diet controlled 62.5 (SD 13.32) years and T2D tablet and insulin controlled 60.23 (SD 11.87) years. Smoking status was the least reported overall (n = 551 (44.2%)). The average age of current smokers was 53.6 (SD 12.47), ex-smokers 59.9 (SD 12.41) and non-smokers 58.2 (SD 12.14) years. App reported demographics for activated users can be seen in Table 1.
App reported demographics for fully activated myDiabetes app users.

*The first reported smoking status was used for analysis.
All 1245 activated patients accessed the app during the analysis period a median 2.0 times (IQR 1–2) over 1 to 262 days (8.6 months). There were no statistically significant differences in the mean number of active days for males (mean 8.8, SD 26.4) and females (mean 8.0, SD 25.3), p = 0.634. A comparison in the total number of days active suggested that those in the ≤33 years age group spent more days using the app (mean 10.97, SD 29.3) than those in the ≥79 year age group (mean 2.90, SD 21.3), however this was not supported by statistical evidence, p = 0.601.
Primary outcome
Education videos were viewed by 1119/1245 (89.8%) users a total of 11,572 times (median 4.0, IQR 1–17, range 1 to 160). The observed distribution of education video activity showed that 1046/1119 (93.5%) users viewed a total of 9830 education videos in the first 20 days of having myDiabetes access (median 3.0, IQR 1–15, range 1 to 115 times). A small proportion of users (n = 44) continued to view the education video material after 50 days of activation (median 7.0, IQR 4–27, range 1 to 95 times).
Figure 2 shows the number of education videos viewed over active app days for each user.
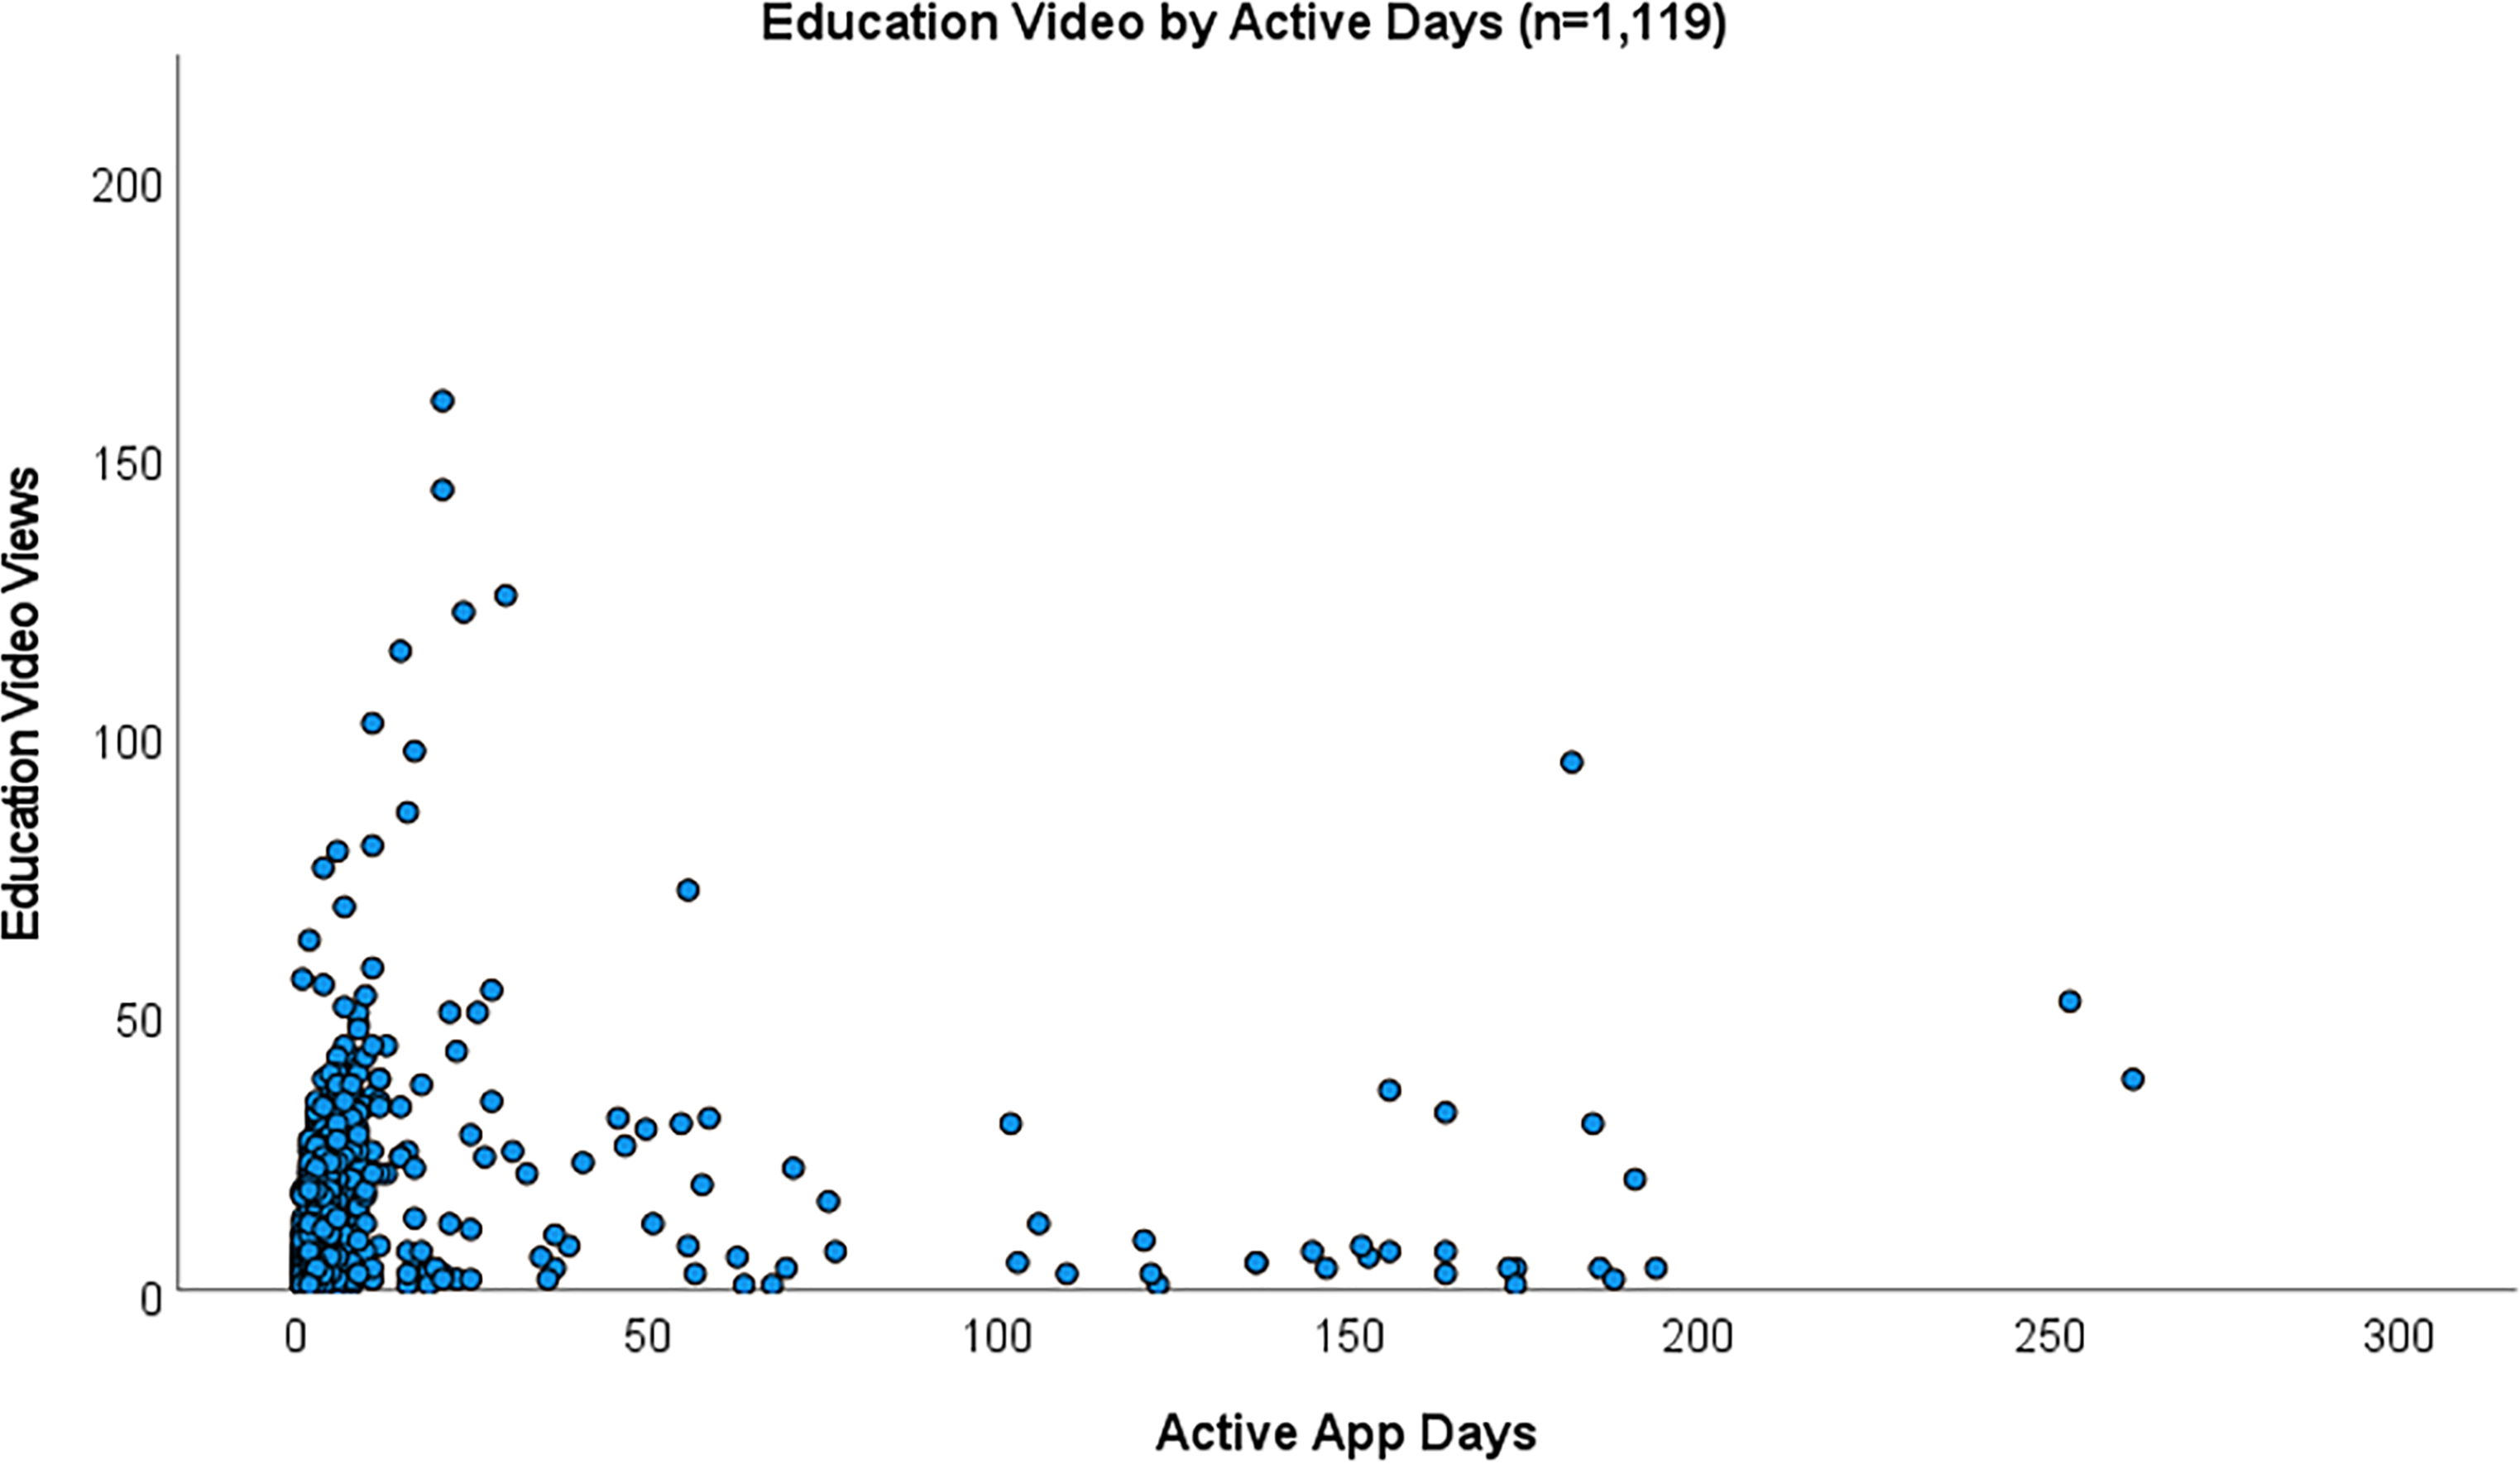
Scatter plot of active days by education video access.
There were no statistically significant differences observed between education video views and user age group. Comparisons across age groups showed those in aged ≥79 years watched more education videos than any other age group, however this was not statistically significant, p = 0.384. Equally, there was no statistically significant difference when comparing the numbers of educational videos viewed by gender (p = 0.400), education video views and diabetes treatment type (p = 0.839), or smoking status (p = 0.655). Table 2 shows education video activity for users by app reported characteristics.
App reported education video views by characteristics.
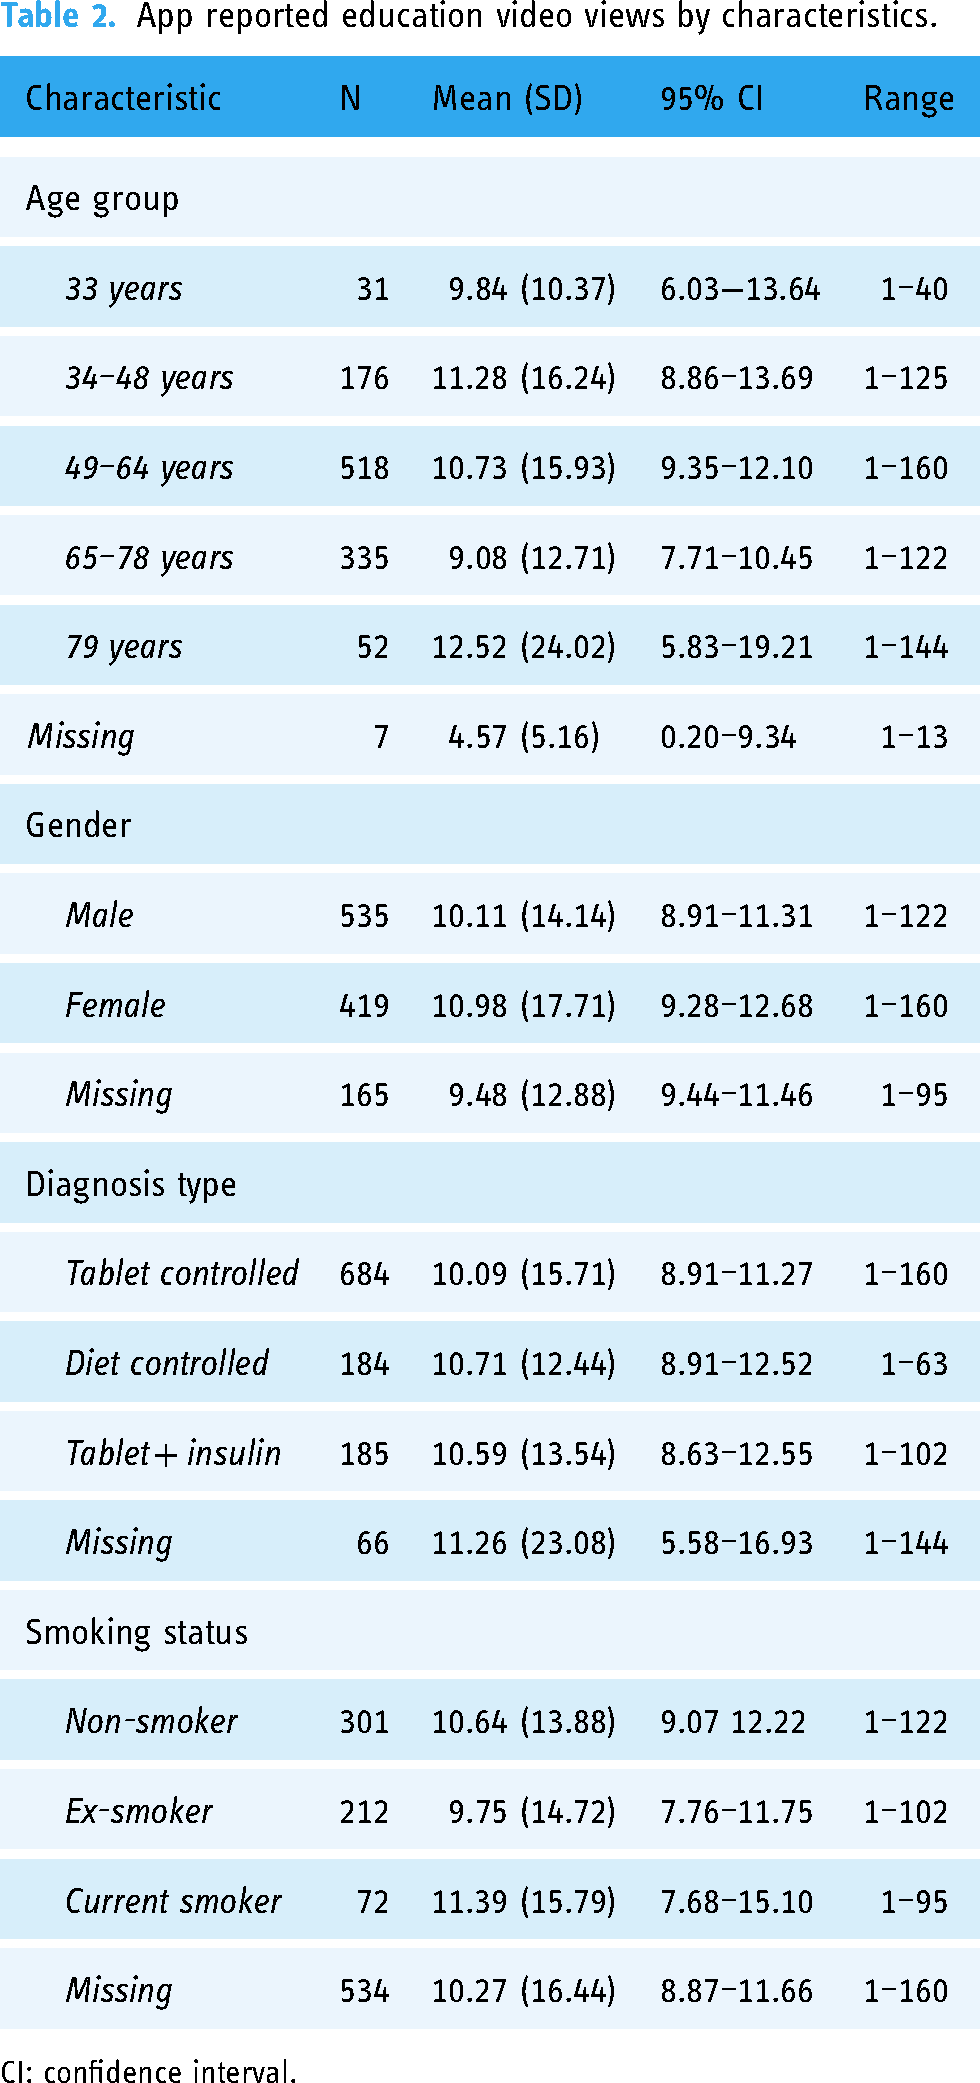
CI: confidence interval.
Secondary outcomes
Exercise
Exercise videos were accessed by 342 (27.4%) users viewing a total of 710 videos (median 1.0, IQR 1–2, range 1 to 41 times). There was a statistically significant difference observed between age groups and exercise video usage with those aged ≥79 years viewing an average of 5.53 (SD 11.03) exercise videos compared to the ≤33 year age group (mean 1.36, SD 0.64) with a mean difference of 4.17 (95% CI 0.21–8.13), p = <0.001. However, there was no statistically significant differences observed in exercise video views between males (mean 1.82, 95% CI 1.50–2.15) and females (mean 2.48, 95% CI 1.53–3.44), p = 0.305.
Clinical reporting
Analysis of app usage for clinical self-management showed n = 676 (54.3%) users reported 10,367 clinical entries a median 2.0 (IQR 1–4) times. Table 3 shows the number of users who reported at least one exercise and clinical use event. There were no statistically significant differences observed in clinical entries across age groups (p = 0.331), or between males (mean 14.92 95% CI 9.39–20.46) and females (mean 13.87, 95% CI 4.96–22.78), p = 0.169. In addition to Table 3, the apps medication diary was accessed by 486 (39.0%) users a total of 12,358 (median 3.0, IQR 1–6) times.
Total reported exercise and clinical events by age group over 12 months including total events reported.

CI: confidence interval.
Smoking
Smoking cessation videos were accessed 123 times by 200 users a median 1.0 (IQR 1–1, 95% CI 1.18–1.53, range 1–6) times. On average, those in the 34 to 48 year group accessed more smoking cessation videos than any other age group (median 1.0, IQR 1–1, 95% CI 1.02–2.41). Users in the 49–64 year age group viewed the least smoking cessation videos (median 1.0, IQR 1–1, 95% CI 0.45–2.05), though this was not statistically significant (p = 0.537). Additionally, there were no statistically significant differences observed in smoking video views between males (median 1, IQR 1–1) and females (median 1, IQR 1–1) times, p = 0.537.
Comparison of usage pre-COVID-19 and post-COVID-19
The impact of COVID-19 on app activity was analysed between the two 6-month groups, pre-COVID and post-COVID. Of the total users (n = 2512) registered to myDiabetes within the 12-month analysis period, 1315 were registered pre-COVID and 1197 were registered post-COVID, which was not statistically significant, p = 0.348. A statistically significant difference was observed between education video views and pre-COVID (mean 2.72, SD 7.61) and post-COVID (mean 8.73, SD 26.33), with a mean difference of 6.01 (95% CI 7.14–10.32, p≤0.001). Furthermore, comparisons between clinical data entries pre-COVID (mean 3.13, SD 9.29) and post-COVID (mean 10.55, SD 30.15) also showed a statistically significant increase in usage with a mean difference of 7.42 (95% CI 8.22–12.88, p≤0.001) (Figure 3).

Usage by active app days for video access and clinical data entry pre-COVID-19 and post-COVID-19.
Discussion
This evaluation has explored real-world app usage data to provide insight into mHealth usage among individuals with T2D, using myDiabetes, as a potential tool to promote structured education uptake. The National Diabetes Audit reports continued suboptimal structured education attendance rates for patients diagnosed within 12 months, which has been further influenced by COVID-19. 10 Since the pandemic, referrals to specialists and education programmes in 2020 were reported as being 35% lower than pre-pandemic levels. 35 In response to profound service disruption, effective and rapid solutions to manage service delivery were sought nationally, leading to digital technology uptake including telehealth, mobile health and digital interventions.36,37 Digital platforms such as myDiabetes can provide regular education reinforcement to promote diabetes self-management, offer the ability to track health trends, overcome attendance barriers and increase access to service delivery for those unable or unwilling to attend in-person, as well as facilitate a decrease in healthcare system burden at population scale.38,39
Despite digital health interventions offering numerous benefits, a great challenge is promoting user uptake and long-term engagement. Recent studies have shown that digital health can transform behaviours positively when engaged with the intervention.39,41 Evaluation results showed almost half of the registered patient users went on to activate the app during the specified time period, of which 89% viewed 11,572 diabetes education videos. Furthermore, myDiabetes app usage increased significantly (p = <0.001) in the subsequent pandemic and lockdown months, where it was likely clinicians placed greater emphasis on encouraging app usage to support remote monitoring during this time, and they were faced with limited options to deliver diabetes healthcare. As a result of the 6-month data split for pre-COVID-19 and post-COVID-19 there was no statistically significant increase in app registrations, likely due to many individuals being registered between Mar and May 2020 when the pandemic forced the first lockdown. Usage patterns in the post-COVID-19 era are likely to change and as healthcare services return to normality a subsequent drop in mHealth usage is probable. This article has identified app usage increased post-pandemic, where patients watch more videos and reported more clinical outcomes. However, further study into usage patterns in the post-COVID-19 era would provide insight into user engagement as healthcare service delivery gains greater knowledge of the potential benefits and challenges digital health may offer.
Most app activity was seen within the first 4 weeks following activation, demonstrating timely access to important health education immediately after diagnosis. Initial intense app use raises questions as to whether users benefitted from immediate access to the educational content and therefore do not necessarily require continuous long-term engagement for this purpose. This would be in keeping with effective engagement theories42,43 and align with the way in which long-term condition care is managed, such as annual reviews, and reviews around times of deterioration. 44 Subsequently, and not unexpectedly, there was a decline in app usage over time which compares favourably with recent studies of mHealth app usage. 45 There are a number of concepts concerning variable usage patterns in app-based interventions for those with long-term conditions such as age, social status, education and health literacy that influence behaviours. 45 However, depending on the desired use of the app directed by clinicians, for example for diabetes education, it is possible that users have received enough information to support self-management43,44 but can refer to it again when needed. Usage data shows 89% of users who activated took steps to self-manage their diabetes by watching at least one structured education video. Defining engagement with a digital intervention has caveats especially when classifying its clinical effectiveness. Despite health measurement parameters not being explored here, 54.3% of users reported 10,367 clinical entries including HbA1c, blood sugar levels and weight demonstrating the apps monitoring ability for both patients and clinicians. Little is known of the effective engagement threshold in diabetes education or self-management. Trials have shown that patients who were supported to use a web-based self-management platform had greater uptake, and registered a wider demographic of patients than those who were less supported. 39
The reasons for app non-activation are unknown, however it is possible that the access link to the app was not received, potential users were not technology enabled, did not have access to the internet, or would have been the cohort not to engage regardless of the additional digital option to support diabetes health management. 46 Moreover, there was no way of knowing how the app was initially presented to patients by clinicians, or how it is embedded within each clinical service. Despite there being attributable factors involved in patient engagement with digital health, age and gender did not appear to represent significant barriers to using myDiabetes. Age is often considered a barrier to technology use, yet these results show there was no significant difference in app education video views across age groups. However, a trend was observed indicating an increase in education video views from young to older users. Other factors related to user engagement come from healthcare providers involving culture, operation of healthcare delivery and practice 47 which must be addressed to fully imbed digital health service delivery. Nevertheless, studies have shown that providing patients with tools to promote engagement such as digital interventions, and skills to self-manage their health, experience better health outcomes which in turn contributes to healthcare cost savings. 47 As digital health continues to grow in popularity, observing uptake and usage is a priority to understanding its value in the real-world. Further research is needed to explore whether myDiabetes can benefit or better health outcomes for users with T2D.
Strengths
The uptake of structured education and individual education video usage has enabled an understanding of the use of this digital solution and evidenced there is an appetite for digital therapeutics. This evaluation of existing data has offered insight into usage patterns across a 12-month period which can provide clinical teams with relevant information of how their patients engage with a digital structured education salutation. This analysis also highlights the wide range of demographics that benefit from the offer of myDiabetes, where results show no large differences across age and gender. We established trends of usage over the study period which will help clinical teams to encourage user engagement, with the option for remote monitoring via the clinician dashboard.
Limitations
All data entered into the myDiabetes app is user reported, given this there was a large amount of missing data. Furthermore, demographic characteristics beyond age and gender are not collected within the app, such as ethnicity, socioeconomic factors and education. There was no clinical data collected outside of app reported data meaning health outcome measurements cannot be determined as a result of app implementation. There were a number of outliers within the data that may have exerted undue influence, although they remained in this analysis to reflect normal variation in real-world data, more research is needed to establish thresholds where outliers may not be valid. Additionally, app registrations and the increased use of in-app educational resources, and tracking functionalities are unlikely to be true reflections of patterns of use before the pandemic. As a result, further research is needed to assess other user demographics and potential selection bias of those who activated versus those who did not, all of which may have played a part in app provision. Exploration of the impact of clinical activity on user engagement was not possible due to the nature of this study, however this is an important consideration for future studies.
Study implications
Despite analysing just 12 months of existing data, this evaluation has explored and interpreted mHealth usage on a scale not seen before. Outcomes have revealed a number of opportunities for future research, including exploring digital intervention effectiveness for overall health improvement incorporating clinical outcome reporting measures. There is also a need to further understand user engagement with digital health, attrition rates and behaviours that influence self-management for individuals with diabetes. Studies focusing on clinician engagement and defining optimal app implementation strategies would provide knowledge of clinical and economic impact, benefits and challenges. In future, digital health studies assessing trends in clinical outcomes must consider the impact of how user tracking and reporting of clinical activity changes outcomes.
Conclusion
The modern digital health environment is rapidly evolving, and noticeably COVID-19 has advanced its integration into healthcare service delivery where digital technologies and self-management solutions have become increasingly important. The app's functionality provided digital diabetes education material, and users initially engaged with it particularly during the pandemic. There is potential for increasing diabetes education rates by offering patients a digital option in combination with traditional service delivery which should be substantiated through future research.
Supplemental Material
sj-docx-1-dhj-10.1177_20552076221147109 - Supplemental material for Can digital health apps provide patients with support to promote structured diabetes education and ongoing self-management? A real-world evaluation of myDiabetes usage
Supplemental material, sj-docx-1-dhj-10.1177_20552076221147109 for Can digital health apps provide patients with support to promote structured diabetes education and ongoing self-management? A real-world evaluation of myDiabetes usage by A.M. Blythin, J. Elkes, T. van Lindholm, A. Bhogal, T.M.A. Wilkinson, C. Saville and A. Kirk in Digital Health
Footnotes
Acknowledgements
The authors would like to thank my mhealth Limited, the University of Southampton, and users of the myDiabetes platform.
Contributorship
AMB designed the study, conducted the data analysis, and wrote the manuscript. CS was involved in study design, data analysis and manuscript preparation. JE, TvL and AK provided data collection, data analysis support and manuscript preparation. TMAW, AK and AB were involved in study design and manuscript preparation.
Data statement
All data analysed during this study are included in this article.
Declaration of Conflicting Interests
AMB, TvL, AB, TMAW and AK are employees of my mhealth Limited. JE and CS have nothing to disclose. The analysis undertaken adhered to the process outlined in the proposal. All results have been provided regardless of outcome to minimise the risk of bias.
Ethical approval
Ethical approval was granted by University of Southampton ethics committee (ERGO). There was no direct patient contact, no randomisation allocation, and myDiabetes is a digital tool currently in use within the NHS whereby patients are given the choice to use it. All data was anonymised at the point of registration in accordance with the my mhealth Limited security processes. At app activation users must read and consent to the Terms and Conditions of Use, and Privacy Policy before they are given access. This includes how their data is handled and agreeing to their anonymised data being used for evaluation purposes.
Funding
The authors disclosed receipt of the following financial support for the research, authorship, and/or publication of this article: This work was sponsored and funded by my mhealth Limited.
Guarantor
AK.
Patient & public involvement
A Patient & public involvement group was formed at myDiabetes app inception to review the app design, usability and content. This is a continuous process with participants contributing to ongoing app development.
Publication
This analysis has been conducted for patients, users, healthcare professionals and the public. Results will be displayed on the my mhealth website, and efforts will be made to ensure publication using open access. STROBE reporting guidelines have been used.
Peer review
This manuscript was reviewed by reviewers who have chosen to remain anonymous.
Supplemental material
Supplemental material for this article is available online.
References
Supplementary Material
Please find the following supplemental material available below.
For Open Access articles published under a Creative Commons License, all supplemental material carries the same license as the article it is associated with.
For non-Open Access articles published, all supplemental material carries a non-exclusive license, and permission requests for re-use of supplemental material or any part of supplemental material shall be sent directly to the copyright owner as specified in the copyright notice associated with the article.