
Abstract
Introduction
Perception of e-health is a broad concept involving many aspects of values and thoughts related to e-health. It is an important precursor to using e-health technologies to promote health. The purpose of this study is to validate an instrument for measuring perceptions of e-health technology among healthcare professionals.
Methods
This methodological study was conducted in China. We based on an existing instrument to develop a new instrument (i.e. PETS-C Brief). In phase 1, we modified and translated the existing instrument into Chinese. Subsequently, we employed the modified and translated instrument to conduct a cross-sectional survey. In phase 2, we randomly selected data from 400 participants to run an exploratory factor analysis and item analysis to reduce the number of items and develop factors. In phase 3, we employed the data from the remaining participants to run a confirmatory factor analysis to confirm the instrument structure.
Results
In phase 1, the modified and translated instrument showed good content and face validities (S-CVI = 0.96, mean comprehensibility = 93.5%). 1338 participants completed the survey. In phase 2, the number of items was reduced from 40 to 19, which demonstrated a 4-factor model. In phase 3, the goodness-of-fit of the 4-factor PETS-C Brief was shown to be acceptable (χ2/d.f. = 6.40, CFI = 0.93, RMR = 0.40, NFI = 0.92, RMSEA = 0.076, IFI = 0.93).
Discussion
This study suggests using this instrument to survey perceptions of e-health technology in Chinese people. Future studies should examine its other important psychometric properties, including convergent/discriminant and predictive validity on behaviors using e-health technology.
Keywords
Introduction
E-health is a field at the intersection of medical informatics, public health, and business, referring to health services and information delivered or enhanced through the internet and related technologies. 1 Systematic reviews have shown that e-health has been used in many contexts to promote people's health, including promoting physical activity, improving antibiotic use and resistance, promoting healthy aging, and managing chronic illnesses.2–5 Recently, the COVID-19 pandemic has deterred people's face-to-face contact but, on the other hand, accelerated the development of e-health. 6 A recent study showed that e-health usage is associated with better motivation to work and job satisfaction among health care workers. 7 Unsurprisingly, e-health is recognized by the World Health Organization as one of the most rapidly growing areas in health today. 8 The perception of e-health among healthcare providers plays an important role in its effective implementation. 9
The perception of e-health involves multiple aspects, including perceived risks to data privacy, 10 acceptance, 11 readiness, 12 knowledge and attitude, 13 and the potential promise and challenges of its use. 14 Readiness for and acceptance of e-health are important precursors to its use. A systematic review showed that e-health readiness comprises four constructs: core readiness, engagement and buy-in readiness, technological readiness, and IT skills readiness. 15 A model measuring acceptance of e-health, the Technology Acceptance Model, proposes five factors: trust, privacy, social influence, perceived ease of use, and perceived usefulness. 16
Studies have revealed that poor knowledge is considered the most common barrier to adopting e-health. 17 A recent study showed that perceived e-health literacy has a positive relationship with users’ satisfaction. 18 Although instruments measuring knowledge and perception of e-health are scarce, instruments measuring knowledge and perception of other similar concepts, such as telemedicine, are abundant. 19 Telemedicine is an example of e-health that focuses on a more specific context, using communications networks for the delivery of healthcare services from one geographical location to another at the level of clinical services. 20 Telemedicine aims at reducing costs without trading off patient satisfaction and clinical outcomes.21,22 A validated instrument measuring the perception of telemedicine is available. 23 However, instruments for measuring the perception of a broader concept (i.e. e-health technology) are still lacking.
There have been similar studies examining a narrower scope of e-health perception (e.g. acceptance) and knowledge in some countries (e.g. Nigeria and Germany).24,25 However, no studies are measuring a broader perception of e-health beyond acceptance. Measuring the perception of e-health technologies could render the instruments applicable in a much broader context. This study, therefore, aimed to validate an instrument for measuring the perception of e-health technology among healthcare professionals.
Methods
Study design
This methodological study employed a descriptive and cross-sectional design. It started developing the PETS by modifying Ayatollahi et al.'s instrument, which was intended primarily to measure clinicians” knowledge and perception of telemedicine technology. 23 This instrument was chosen as the one to be modified because it measures a similar concept (i.e. telemedicine vs e-health) but the instrument is too lengthy (i.e. 40 items). There is evidence supporting the notion that questionnaire length has a negative effect on response rate. 26 Ayatollahi et al.'s study, based on a literature review, developed an instrument consisting of six factors to measure knowledge and perception of telemedicine, including (1) clinicians’ knowledge of telemedicine technology, (2) clinicians’ perception of the advantages of telemedicine technology, (3) clinicians’ perception of the disadvantages of telemedicine technology, (4) the necessity of deploying telemedicine, (5) the impact of the application's ease of use, and (6) the importance of the security of telemedicine technology. 23 After its development, the instrument was validated by Ayatollahi et al. using face and content validity methods. 23 However, validity figures were not reported in the study. The internal consistency was tested and found to be fairly good (Cronbach's α = 0.73). 23 Many validity indices of this instrument (e.g. construct and concurrent validity) are not known. Though the instrument is titled telemedicine technology, the research team noted that the items actually reflected similar issues of concern to those identified in telehealth. We made a comparison of the items with the literature on e-health and further developed and validated this instrument to measure the perception of e-health and technology in the current study.
Adopting a recognized instrument adaptation procedure, this study consisted of three phases, namely translation and back-translation, item reduction, and psychometric testing.27,28 Phase 1 aimed to (a) translate the English-language version of the PETS into Chinese because this study was coordinated in Guangzhou, Guangdong, China, 29 and (b) examine the content validity and face validity of this version. Phase 2 aimed to reduce the number of items. Phase 3 examined the psychometric properties of the Chinese language (using a measure referred to hereinafter as the PETS-C Brief). As shown in Figure 1, illustrates the entire process of adaptation, item reduction, and validation.
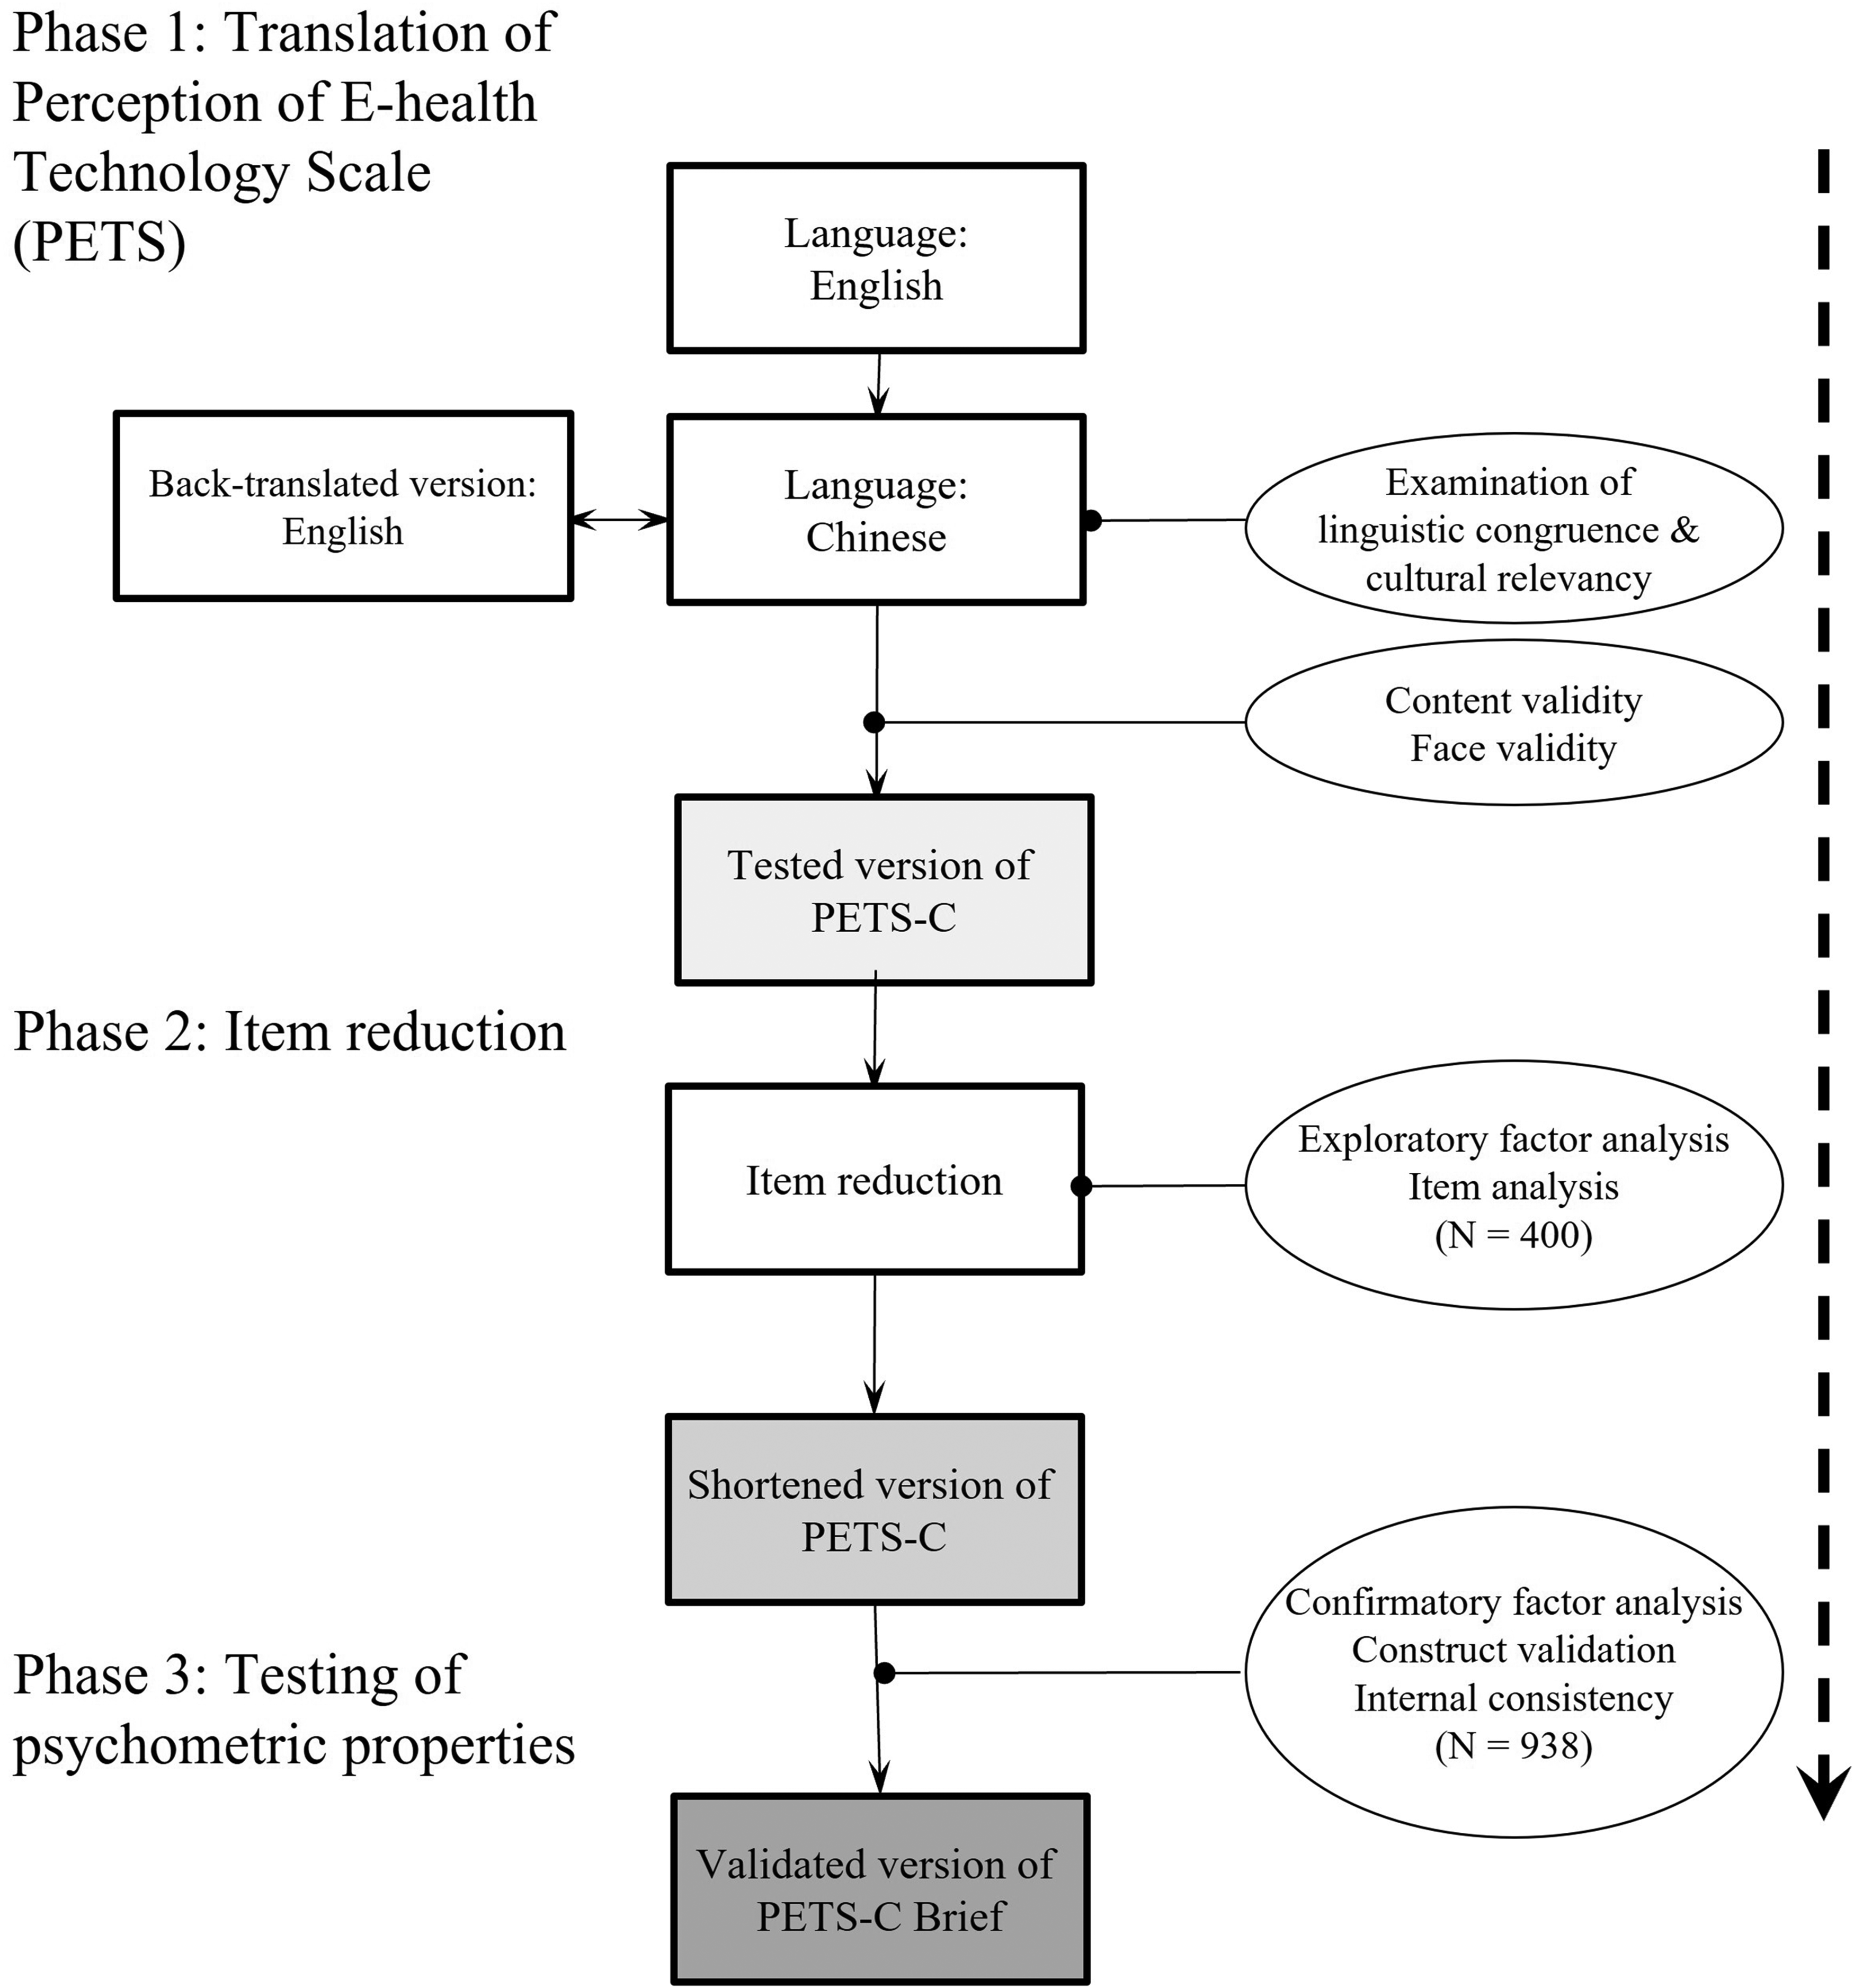
A logistic flow chart of the translation, item reduction, and psychometric testing.
Phase 1a: translation and backward translation
The translation process was based on the principles of Brislin's model of forward and backward translation. 30 Two independent translators (i.e. bilingual, with PhDs in Nursing and Social Science, experienced in health literacy) translated the PETS from its source language (SL; English) to the target language (TL; Chinese). The TL version was then reviewed by a Chinese monolingual reviewer to identify ambiguous and unclear wording, which was then modified by the research team. A bilingual linguistic expert (a PhD graduate in linguistics and translation) compared the back-translated version (BT; English), which was translated by a nursing professor, with the SL version to examine the linguistic congruence and cultural relevancy. The research team subsequently discussed any incongruence in the translation by the expert. The abovementioned process was repeated until the SL and BT reached a maximum agreement; that is, there was no loss of any essential or stem meaning of each statement. To update and expand the scope of stem ideas, the term “telemedicine technology” was revised to “e-health technology” for all PETS items.
Phase 1b: content validity and face validity
We examined the content validity of the PETS-C using a four-point Likert scale (from 1 = not relevant to 4 = highly relevant). 31 Expert panel members who were healthcare professionals giving ratings of less than three were asked to explain. The content validity index (CVI), which indicates the proportion of responses that agree with the relevancy of the scale, was computed based on the percentage ratings from experts who gave scores of 3 or 4. The scale- (S-CVI) and item-level CVIs (I-CVI) were considered satisfactory if a value of 0.80 or above was achieved.32,33
Face validation was performed to assess the comprehensibility of the PETS-C items by healthcare staff members and students and to ensure the applicability of this scale as a self-administered instrument. It is because the instrument was intended to be developed to measure the e-health perception of healthcare providers including staff members and students. A purposive sample of 10, including an appropriate good mix of demographics (e.g. men and women, with varied education levels), was recruited for the validation analysis because the literature indicated that this sample size is sufficient to detect ambiguous items.34–36 These participants were invited to review the scale in terms of comprehensibility (i.e. a yes/no dichotomous scale). 32 They were also invited to suggest any appropriate wording and sentence styles for the items. The comprehensibility was computed using percentages. A higher percentage indicated better comprehensibility. A preliminary version of the PETS-C was then developed.
Phase 2: item reduction
We performed item and factor analysis of the PETS-C to improve the psychometric properties of the scale by reducing poorly performing items and increasing the scale's applicability. 28 The PETS-C was administered to a group of healthcare staff and students to identify poorly performing items through a combination of checking the Cronbach's alphas of the scale and subscales, the corrected item-total correlation coefficient of each item, and the factor structure of the scale. Items that were redundant, heterogeneous, had poor factor loading or were cross-loaded were considered to be discarded.
EFA was used to explore any new structure of the PETS-C. First, the suitability of the data for factor analysis was assessed using Bartlett's test of sphericity and the Kaiser-Meyer-Olkin (KMO) measure of sampling adequacy.
37
Bartlett's test of sphericity reached statistical significance and the KMO value of
The PETS-C was constructed based on classical measurement theory, which assumed that all of the items should tap different aspects of the same attribute and not the varied parts of the different traits. 36 Statistically, the internal consistency of PETS-C was appropriately assessed using Cronbach's alpha statistics, corrected item-to-total correlation (rit), Cronbach's alpha with item deletion, and inter-item correlation (rii) at the scale, subscale, and item levels.
At the scale level, a value of Cronbach's alpha greater than 0.70 has been suggested as optimum for a scale.32,36 At the subscale level, Cronbach's alpha statistic was also used to examine the homogeneity of items in the hypothesized subscales. A Cronbach's alpha value above 0.90 indicated the presence of redundant items, whereas values below 0.70 reflected the presence of heterogeneous items.32,36 At the item level, three methods were used to perform item analysis, namely corrected item-to-total correlation (rit), Cronbach's alpha with item deletion, and inter-item correlation (rii). First, rit with a value above 0.70 indicated that the items were redundant, whereas values below 0.30 reflected heterogeneous items in the hypothesized subscale.32,36 Second, Cronbach's alpha with item deletion was also used to examine the homogeneity of the items in the respective subscales. The method calculated the revised value of Cronbach's alpha after omitting the evaluated item.
40
If the deletion of a particular item increased Cronbach's alpha by 0.10 or more, then the item was considered non-homogeneous.
41
Finally, inter-item correlation (rii) in the respective subscales was used to identify the redundant items. Pearson's correlation coefficients were computed for the items in the same subscales and tabulated as correlation matrices. Here, an rii value between two items that was greater than 0.75 meant the item was considered as redundant, whereas items with a value of 0.90 were regarded as indistinguishable.
32
Some scales may have strong internal consistency, but only a moderate correlation among the items would be expected for a non-redundant scale.
32
Apart from the use of statistical results to decide on item deletion, the theoretical meanings of the items that were used to capture the studied constructs were also considered.
40
As shown in the supplementary file with a summary of the abovementioned four principles, the decision to delete a potentially poorly performing item from a subscale (
Phase 3: psychometric testing
We aimed to perform psychometric testing of the PETS-C Brief. The reliability of the PETS-C Brief was reflected through its internal consistency. The internal consistency of the PETS-C Brief was examined using Cronbach's α statistics and corrected item-total correlation, where α ≥ 0.70 of the scale and subscales as well as r
A CFA was then performed to examine the degree of fitness of the data in a hypothesized model (i.e. the model identified by EFA) and determine the internal structure of the PETS-C Brief. Goodness-of-fit measures, including the chi-square/degree of freedom ratio (χ2/d.f.), comparative fit index (CFI), root mean square residual (RMR), normed fit index (NFI), root mean square error of approximation (RMSEA), and incremental fit index (IFI), were used to evaluate the model fitness. The measures yielded satisfactory goodness-of-fit indices if χ2/d.f. < 5.00; RMR < 1; NFI, CFI, and IFI > 0.90, and RMSEA < 0.08. 43 The data of 900 participants were regarded as “good” to generate the CFA model. 44
Setting and sample
In Phase 1, we invited a panel of six experts, including educators working in higher education and researchers with experience in education or health sciences, to examine the relevance and establish the content validity of the PETS-C. Panel members were identified by their expertise in the subject matter of e-health or health, as shown in their publications. We invited four students from different programs at our collaborating universities, four hospital staff members, and two nursing faculty members to establish face validity.
In Phases 2 and 3, we estimated to recruit a convenience sample of approximately 1400 healthcare staff and students. A sample size of 1400 was estimated based on the requirement of factor analyses (including for EFA and CFA). We randomly allocated 400 participants to phase 2 and 1000 participants to phase 3 through SPSS randomization. For Phases 2 and 3, we invited participants of the 2020 Annual Education Program of the Chinese Consortium for Higher Nursing Education to finish a set of online questionnaires. We also invited staff members from the hospitals and universities that made up the supporting organizations of the conference to complete the same set of online questionnaires.
For EFA, a rule of thumb of an item-to-sample ratio (1:10) was adopted. 38 In order to achieve sufficient power for factor exploration, a sample of 400 participants is required. For CFA, a total sample of 1000 participants is regarded as “excellent” in the statistical viewpoints and previously published evidence.40,44–46
Measurement
The questionnaire used in Phase 2 consisted of two parts. Part one was demographic questions including gender, age, position, education level, year of study, school, and living district. Part two was the 40-item PETS-C. PETS-C was a self-administered instrument to measure the perception of e-health technology on a five-point Likert scale (from very high to very low). 23 The developer of PETS conceptualized knowledge and perception of e-health technology into six dimensions: knowledge (7 items), perception of the advantages (7 items), perception of the disadvantages (8 items), perception of necessity (6 items), perception of ease of usage (6 items), and perception of security (6 items).
Data collection
In Phase 1, we sent out and received the questionnaires for translation and validation via email. In Phases 2 and 3, we invited participants to fill out the questionnaires through the online survey platform Wengjuanxing (www.wjx.cn). We then downloaded the data exported from Wengjuanxing for analysis.
Data analysis
IBM® SPSS Statistics version 22 was used to analyze the quantitative data. Descriptive statistics such as frequency, percentage, and mean were used to describe and summarize the questionnaire data. Inferential statistics, including Cronbach's alpha and corrected item-total correlation coefficients, were used to examine the internal consistency. EFA was used to explore the factor structure of the PETS-C Brief. For CFA, IBM® SPSS AMOS was used to test the hypothesized factor model of the PETS-C Brief. Both descriptive and inferential statistics were adopted to conduct psychometric testing, as mentioned above. The level of significance was set at 0.05.
Ethical considerations
The study obtained approval from the ethical committee of the study university. All participants were fully informed about the aim and procedure of this study via a detailed information sheet. The researchers explained and highlighted observations regarding anonymity and confidentiality. It was estimated that the respondents spent about 15 minutes completing the questionnaire. The original author of the PETS was approached and acknowledged in the current study.
Results
Phase 1
The translations and content and face validity development were conducted in July 2020. The I-CVI of items that were reviewed by six healthcare professionals ranged from 0.83 to 1.00, except item #20 (CVI = 0.67). The Chinese phrase of item #20, “unauthorized access to patient medical information,” was revised to improve its clarity and relevance, as suggested by the expert panel members. The S-CVI was 0.96. For face validation, an average of 93.5% comprehensibility was obtained.
Phase 2
The online survey was conducted in October 2020 and coordinated in Guangdong. 1338 participants completed the online questionnaire. The participants were from almost all parts of China, including 21 provinces, 4 autonomous regions, 4 municipalities/centrally-administered municipalities, and 2 special administrative regions. Given that we set the online questionnaire system Wengjuanxing not to allow participants to submit if they had any missing data, there were no incomplete entries or missing data. We used all the data of the 1338 participants for data analysis. In Phase 2, 400 participants were randomly allocated to the analysis. As shown in Table 1, the majority of the participants were female (n = 376, 94.0%), aged 20−24 years (n = 141, 35.3%), bachelor's degree holders (n = 239, 59.8%), and frontline clinical nurses (n = 173, 43.3%). The mean clinical experience was 77.6 (SD = 98.0) months.
Demographic characteristics of participants.

^3 cells less than 5.
The statistical significance of Bartlett's test of sphericity (χ2 = 56798.79, d.f. = 780, p < 0.001) and the KMO value of 0.969 (i.e. > 0.60) was obtained, hence the factorability of the correlation matrix was supported. The response modality indicated that the data were non-normally distributed on many items.
According to the results of Kaiser's criterion and Scree plot test, by the use of principal axis factoring with Promax rotation, the item loadings on 4-, 5-, 6-, and 7-factor models were computed, examined, and compared, as shown in Table 2. All these factor models grouped the original factors 4, 5, and 6 into a single factor. Eventually, the 40-item 4-factor solution, as shown in Table 2, was identified to be the most optimal because of the minimal change in the percentage of variance explained (from 78.7% to 72.1%), maintaining conceptual adequacy and having the smallest number of cross-loaded items (n = 1). In addition, the internal structure of this 4-factor solution was most interpretable and clear, with items measuring similar dimensions of engagement clustered together similarly. This 4-factor structure accounts for a total of 72.1% of the variance. The factors were tentatively labeled as follows: “knowledge of e-health technology” (factor 1, 7 items), “perceptions of the advantages of e-health technology (factor 2, 7 items), “perceptions of the disadvantages of e-health technology (factor 3, 8 items), and “perceptions of the necessity, usage and security of e-health technology” (factor 4, 18 items). The Cronbach's alphas of individual factors ranged from 0.923 to 0.978 (i.e. > 0.90), indicating the presence of redundant items. Therefore, several rounds of item reduction were executed based on the statistical principle of EFA and item analysis.42
Comparisons between the different factor models were examined by exploratory factor analysis (EFA).

Number of items = 40.
As shown in the supplementary materials, from round 1 to round 3, a total of 11 items were removed from the scale with reference to the four guiding principles. In round 4, there was an absence of redundant items identified in factors 1, 2, and 3. In the last round, by applying principle 4, item reduction was continued in factor 4 by repeated item analysis, and nine more items were discarded. The explored 4-factor structure of the PETS-C Brief was finalized (total percentage of variance = 60.6%, Cronbach's alpha = 0.894) with factor 1, “knowledge of e-health technology” (4 items, explained variance = 8.93%, Cronbach's alpha = 0.89), factor 2, “perception of the advantages” (4 items, explained variance = 2.7%, Cronbach's alpha = 0.85), factor 3, “perception of the disadvantages” (6 items, explained variance = 15.51%, Cronbach's alpha = 0.87) and factor 4, “perception of e-health application” (5 items, explained variance = 33.5%, Cronbach's alpha = 0.88). It was noteworthy that factor 4 contained embedded items representing the perception of the necessity, use and security of e-health technology, which was important to ensure conceptual adequacy. After phase 2, the 4-factor PETS-C Brief comprising 19 items was developed, with satisfactory factorial structure and internal consistency.
Phase 3
In Phase 3, 938 participants were randomly allocated to the analysis. As shown in Table 1, the majority of the participants were female (n = 867, 92.4%), aged 20–24 years (n = 325, 34.6%), bachelor's degree holders (n = 592, 63.1%), and frontline clinical staff (n = 395, 42.1%). The mean clinical experience was 81.3 (SD = 103.8) months.
The 4-factor structure of the PETS-C Brief was confirmed by CFA. As shown in Figure 2, all paths were significantly loaded to their respective factors (range of loading: 0.69−0.91). The preliminary goodness-of-fit indices indicated a marginally acceptable fit of data model (χ2/d.f. = 7.138, CFI = 0.92, RMR = 0.40, NFI = 0.91, RMSEA = 0.081, IFI = 0.92). According to the co-variance modification indices, one pair of error terms with the largest indices (errors of items 18 and 20) would be covaried to improve the model fit.46 The goodness-of-fit indices of the corrected model was acceptable (χ2/d.f. = 6.40, CFI = 0.93, RMR = 0.40, NFI = 0.92, RMSEA = 0.076, IFI = 0.93).

The model of the 4-factor structure of PETS-C Brief.
Discussion
This was the first methodological study to validate an instrument specifically measuring the perception of e-health technology. One of its strengths was that it employed rigorous procedures and was empirically tested in a big sample. Another strength was that the demographic and clinical characteristics of the samples between Phases 2 and 3 were highly homogeneous. We are confident that the psychometric properties will also be seen when the scale is administered in the population represented by the sample. Table 3 summarizes that the 4-factor PETS-C Brief comprising 19 items showed good internal consistency (Cronbach's α = 0.896), good face validity (comprehensibility = 0.935), good content validity (CVI = 0.83−1.00), and acceptable construct validity of the (χ2/d.f. = 6.40, CFI = 0.93, RMR = 0.040, NFI = 0.92, RMSEA = 0.076, IFI = 0.93). These findings have several implications.
Summary of the psychometric properties of the Chinese version of perception of e-health technology scale-brief (PETS-C Brief)
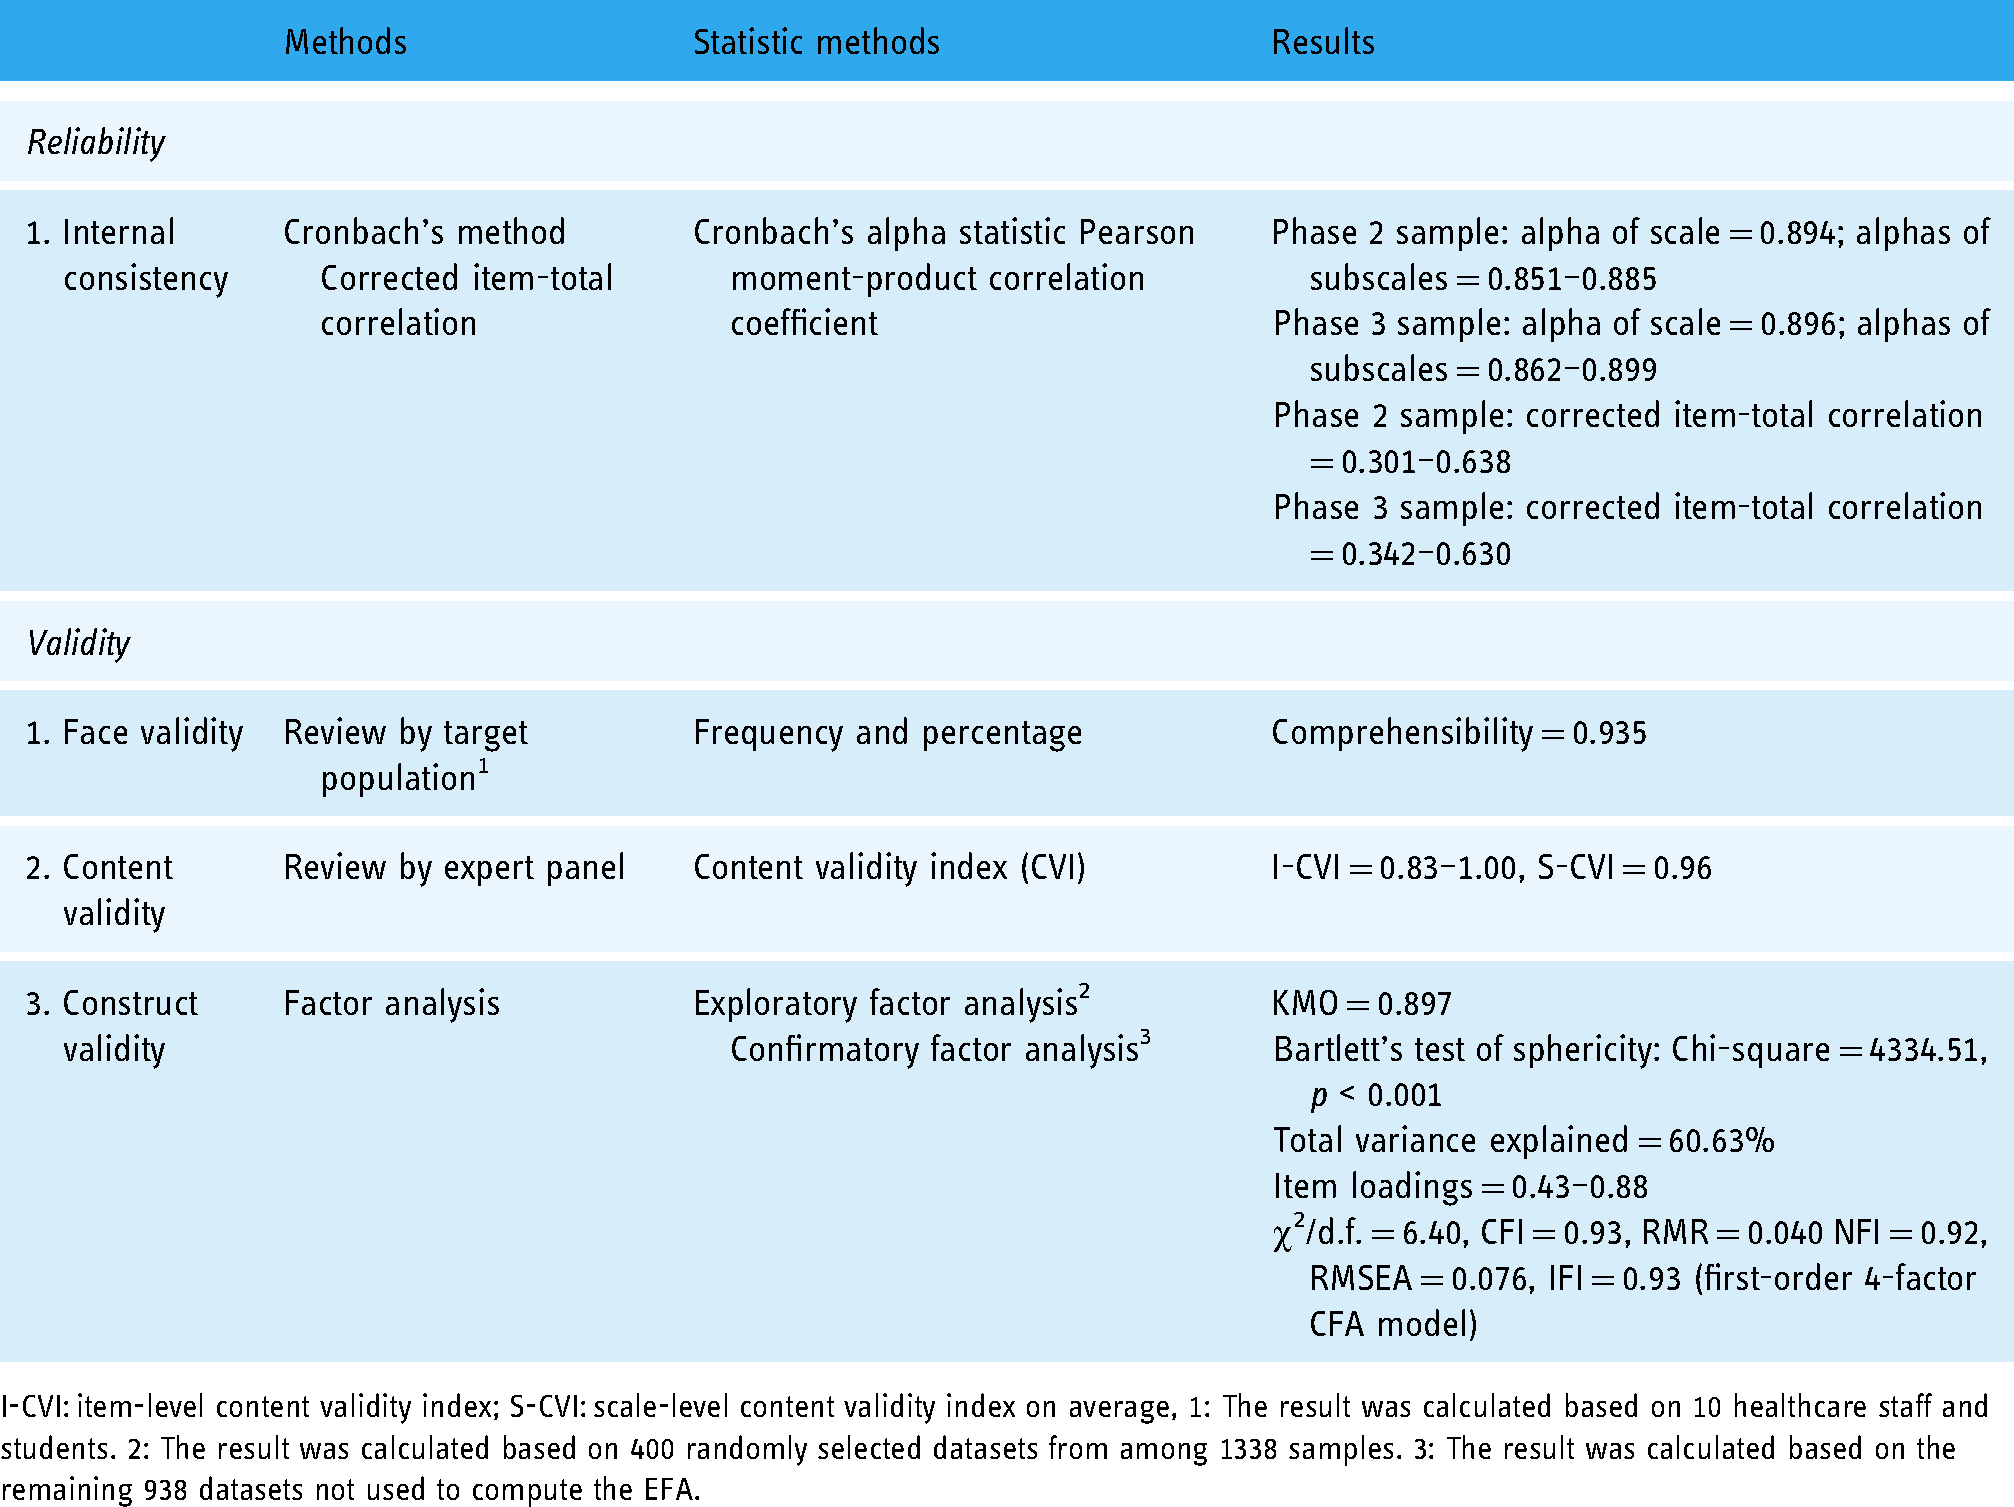
I-CVI: item-level content validity index; S-CVI: scale-level content validity index on average, 1: The result was calculated based on 10 healthcare staff and students. 2: The result was calculated based on 400 randomly selected datasets from among 1338 samples. 3: The result was calculated based on the remaining 938 datasets not used to compute the EFA.
A similar study published after the commencement of this study validated an instrument measuring engagement with e-health technology, namely TWEETS. 47 TWEETS primarily measures engagement, which refers to the extent to which the person is convinced by the reason behind the target behaviors. Conceptually, the PETS-C Brief measures perception, which covers a much broader concept, as it can also be empirically shown that the PETS-C Brief consists of four factors but the TWEETS consists of only one factor in CFA. The PETS-C Brief is expected to be used to examine the perception of e-health in a broader sense. Future studies should also examine the predictive validity of the PETS-C Brief on behaviors using e-health technologies.
The PETS-C Brief, with confirmed validity and reliability, significantly reduced the original number of 40 items to 19 items. A shortened scale has many benefits, including higher respondent interest, higher response rate, and reduced administrative costs, potentially leading to greater statistical power. 48 It is also the first study to have translated an instrument measuring the perception of e-health technology into Chinese, with proven language equivalence. It makes the measurement of the perception of e-health technology easier in Chinese-speaking regions. Reducing item numbers may unavoidably threaten the factor structures, scale reliability, and conceptual adequacy. 48 However, we examined the shortened scale for its construct validity and reliability. The findings of this study showed that the validity and reliability of this scale remain at a highly satisfactory level. In the original scale, there are six factors. After shortening, the scale still retains at least one item from each of the six original factors. As a result, the conceptual adequacy of the shortened scale is not compromised. Therefore, we recommend that this scale is ready to be used to measure the perception of e-health technology for research purposes (e.g. identifying the level of perception of e-health technology) among Chinese healthcare professionals, given that the perception of e-health technology in Chinese-speaking countries is still poorly known.
There are several limitations of this study. First, the shortened scale may have a weaker relationship with other measured variables. 48 Unfortunately, in this study, we did not concurrently measure other variables. In the literature, perception of e-health technology (e.g. perceived values) is associated with the use of e-health services. 49 Subsequently, it could lead to better clinical benefits (e.g. cognitive function promotion) and more healthy behaviors (e.g. physical activity).2,50 Future studies should examine its convergent validity by examining whether this scale is also well associated with the variables known to have a relationship with the perception of e-health. Second, one of the parameters in the CFA is not satisfactory (χ2/d.f. = 6.40). In the literature, it is suggested that it should be lower than 5 to demonstrate good model fitness. 44 Evidence showed that the model fitness should be considered as a whole, instead of considering one parameter only. 51 Nevertheless, other CFA parameters give proof that the model fitness is satisfactory. Finally, the whole study recruited participants who are healthcare professionals without including patients. The generalizability of using PETS-C Brief to examine the perception of e-health in patients is questionable and it should be examined in future studies.
Conclusion
PETS-C Brief comprises 19 items in a 4-factor model and showed good internal consistency (Cronbach's α = 0.896), good face validity (comprehensibility = 0.935), good content validity (CVI = 0.83−1.00), and acceptable construct validity of the (χ2/d.f. = 6.40, CFI = 0.93, RMR = 0.040 NFI = 0.92, RMSEA = 0.076, IFI = 0.93). Given the satisfactory psychometric properties, this study suggests using this instrument to survey the perception of e-health technology in Chinese-speaking regions. Future studies should examine its other important psychometric properties, including convergent/discriminant and predictive validity on behaviors using e-health technology.
Supplemental Material
sj-docx-1-dhj-10.1177_20552076221126055 - Supplemental material for Perception of E-health Technology Scale in Chinese Brief (PETS-C Brief): Translation, item reduction, and psychometric testing
Supplemental material, sj-docx-1-dhj-10.1177_20552076221126055 for Perception of E-health Technology Scale in Chinese Brief (PETS-C Brief): Translation, item reduction, and psychometric testing by Rick Yiu Cho Kwan, Simon Ching Lam, Shao Ling Wang, Arkers Kwan Ching Wong, Lei Shi and Frances Kam Yuet Wong in Digital Health
Footnotes
Acknowledgments
Due acknowledgement is given to the 2020 Organizing Committee of the Chinese Consortium for Higher Nursing Education.
Contributorship
RK, AW, SW, and FW researched literature and conceived the study. RK, AW, and SW were involved in the design of the study. AW and SW were involved in gaining ethical approval. LS was involved in patient recruitment. RK and SL were involved in the data analysis. RW and SL wrote the first draft of the manuscript. All authors reviewed and edited the manuscript and approved the final version of the manuscript.
Declaration of Conflicting Interests
The authors declared no potential conflicts of interest with respect to the research, authorship, and/or publication of this article.
Ethical approval
The ethics committee of the Institutional Review Board (IRB), The Hong Kong Polytechnic University, Hong Kong approved this study (Reference Number: HSEARS20200924004).
Funding
The authors received no financial support for the research, authorship, and/or publication of this article.
Guarantor
FW.
Notes
Rick Yiu Cho Kwan and Simon Ching Lam contributed to this paper equally.
Supplemental material
Supplemental material for this article is available online.
References
Supplementary Material
Please find the following supplemental material available below.
For Open Access articles published under a Creative Commons License, all supplemental material carries the same license as the article it is associated with.
For non-Open Access articles published, all supplemental material carries a non-exclusive license, and permission requests for re-use of supplemental material or any part of supplemental material shall be sent directly to the copyright owner as specified in the copyright notice associated with the article.