
Abstract
Background
Ageing populations are resulting in higher prevalence of people with multiple chronic conditions (multimorbidity). Digital health platforms have great potential to support self-management of multimorbidity, increasing a person's awareness of their health and well-being, supporting a better understanding of diseases and encouraging behaviour change. However, little research has explored the long-term engagement of older adults with such digital interventions.
Methods
The aim of this study is to analyse how 60 older adults with multimorbidity engaged with digital symptom and well-being monitoring through a digital health platform over a period of approximately 12 months. Data analysis focused on user retention, frequency of monitoring, intervals in monitoring and patterns of daily engagement.
Results
Our findings show that the overall engagement with the digital health platform was high, with more than 80% of participants using the technology devices for over 200 days. The submission frequency for symptom parameters (e.g. blood glucose (BG), blood pressure (BP), etc.) was between three and four times per week which was higher than that of self-report (2.24) and weight (2.84). Submissions of exercise (6.12) and sleep (5.67) were more frequent. The majority of interactions happened in the morning time. The most common time of submission for symptom parameters was 10 am, whereas 8 am was the most common time for weight measurements.
Conclusions
The findings indicate the patterns of engagement of older adults with complex chronic diseases with digital home-based self-management systems.
Introduction
Background
Across the world, populations are ageing, as people are living longer. By 2060, 30% of the European Union (EU) population (151.5 million people) will be over 65 years old. 1 There is much to celebrate about living longer. However, according to the World Health Organization (WHO), there is little evidence to suggest that people today are experiencing better health in their later years than their parents. 2 Ageing is typically associated with declining health, including an increase in chronic diseases, which in turn, can have a negative impact on health care services. Solutions are needed to help older adults live healthier lives for as long as possible. Of particular concern is the number of people living with multimorbidity, which is defined as having two or more chronic conditions. In 2015, it was estimated that 50 million people in the EU were living with multimorbidity, and the number is increasing with time. 3 Amongst people over 65 years old, the prevalence rate of multimorbidity is estimated to be as high as 65%. 3 In addition, 42% of people in the United States had multiple chronic conditions in 2014 and the prevalence of multimorbidity between 2008 and 2014 for people who are over 65 years old was 81%. 4
Self-management, defined as the actions taken by a person to manage symptoms, lifestyle and emotions could provide a bridge between patients’ needs and the capacity of health care systems to meet those needs, 5 in addition to improving their quality of life for the rest of their lives. 6 However, self-management for those with multimorbidity is particularly challenging compared to the management of a single condition. In addition to monitoring and managing multiple symptoms, management of multiple medications and adjusting lifestyle behaviours, people with multimorbidity often report a lack of integrated care, a lack of knowledge to self-manage, conflicting advice and poor communication with and amongst their healthcare professionals. 7 Ageing can result in additional complexities, such as reduced mobility, frailty, cognitive declines and comorbidities such as pain and depression. 7 Therefore, self-management can be very challenging and time-consuming for this cohort, often resulting in low levels of engagement in self-management behaviours. 8
Digital home-based self-management systems, using information and communication technologies (ICT) 9 and sensing technologies to monitor and support people's daily life in relation to their health and well-being in their homes, have the potential to support self-management. 10 Such systems can increase a person's awareness of their health and well-being, encourage them to change their behaviours (e.g. to eat well and exercise) and can highlight a potential exacerbation that needs medical attention. Self-care technologies provide numerous opportunities for patients and their carers, including ‘(i) fostering reflection by making health and contextual information available, (ii) suggesting care activities or treatment adjustments, (iii) sharing care activities with informal carers, (iv) enhancing the collaboration with the care team, and (v) sharing self-care activities and learning from others with the same chronic condition’. 11
However, very little research has explored whether and how older adults with multimorbidity engage with digital self-management over longitudinal periods of time. The literature has explored older adults’ attitudes towards the use of technology for self-management. Research has examined wellness,12,13 social well-being, 14 functional abilities, 15 physical activity, 16 physical rehabilitation, 17 medication management18,19 and chronic disease self-management.20–22 Older adults are willing to change their behaviour to adopt digital self-management. 13 Furthermore, recent research indicates promising results in terms of older adults actively engaging in self-management. Older adults have had high levels of engagement with mHealth interventions and, in one study, have demonstrated higher levels of engagement with digital diabetes self-management than their younger counterparts.23, 24 Despite these promising studies, there is still a lack of research on longitudinal engagement with self-management technologies by those with multiple chronic conditions, with a view to understanding how best to facilitate and promote sustained engagement to maximise benefits.
Objectives
The aim of this study was to explore, through analysis of an existing dataset, patterns of engagement of older adults with two or more chronic conditions with digital self-management, in particular with monitoring their symptoms (e.g. blood pressure (BP)) and well-being (e.g. activity, self-reported mood), with the goal of better understanding how to promote sustained engagement over time. The study had four research questions: (1) What is the distribution of user retention for using digital health technologies at home? (2) What are the frequencies (times per week) at which participants submit their data? (3) What are the average and SD of the intervals (in days) between each submission? (4) What preferred hours of the day do people submit BP, pulse, blood oxygen level (SpO2), blood glucose (BG) and weight readings?
Methods
Overview of the dataset
The dataset was collected during the ProACT project trial. Full details on the study protocol can be found in. 25 During the project, 60 older adults who are aged 65 years or over with multiple chronic conditions (two or more of the following: chronic obstructive pulmonary disease (COPD), heart failure (HF), heart disease (HD) and diabetes) used the ProACT platform, consisting of a suite of sensor devices and a tablet-based app to monitor and manage their conditions. All participants received a BP monitor (to measure BP and heart rate), a smartwatch (to measure activity and sleep) and a weight scale. Those with diabetes were provided with a blood glucometer to measure BG, and those with COPD were provided with a pulse oximeter to measure SpO2. All participants also received an iPad with a custom-designed app, the ProACT CareApp to view their data; self-report on their well-being (e.g. mood, satisfaction with social life) and those symptoms that could not be easily monitored by a digital device (e.g. breathlessness and sputum colour); receive targeted education based on their current health status; set activity goals; and share their data with others. The approximate length of time participants were on the trial was 12 months, though some were on for 14 and others 9 (e.g. those that came onto the trial at later time points). During the trial, 33 participants went through the trial for at least 356 days, and 22 participants started 1 month later than others.
During the trial, participants were asked to take readings using the devices and self-report within the ProACT CareApp as they wished. They were not asked to do this daily, as one of the objectives was to understand real-world engagement. However, some participants were already aware of how often they should be taking readings. For example, those with HF knew that daily weight readings are important. During the trial, participants were supported with a technical help desk that responded to any queries in relation to the technology and home visits were conducted as required to resolve issues. In addition, a clinical triage service monitored participant readings and contacted the participant in cases where there was an alert (e.g. an abnormal BG or BP reading). Participants also got a monthly check-in phone call from one of the triage nurses.
The digital devices used during the trial were off-the-shelf devices from two providers, Withings and iHealth. Data was pulled from these providers into a custom-built platform called ‘Context-aware brokering and inference engine-Subject Information Management Systems (CABIE-SIMS)’ which includes a data aggregator for storing health and well-being data. All the devices required the user to perform some manual action, with some requiring more interaction than others (Table 1). For example, taking a BG reading required a number of steps, while physical activity and sleep monitoring only required the user to open an app to sync (transfer) the data from the activity watch. These readings would then appear in CABIE-SIMS in ‘near’ real time. In relation to the activity watch, this device was supposed to sync automatically, without user interaction. However, inconsistencies with syncing meant that users were advised to open the Withings app if they wanted to sync their data to ProACT. Otherwise, CABIE-SIMS pulled activity data at regular intervals throughout the day, while sleep data for the previous night was pulled each morning. Table 1 shows the various types of data that were collected and how many participants collected them. Further information on the full ProACT platform, including the CareApp used by participants, can be found in the study by Doyle et al. 26
Types of data, collection methods and number of participants collecting that data.
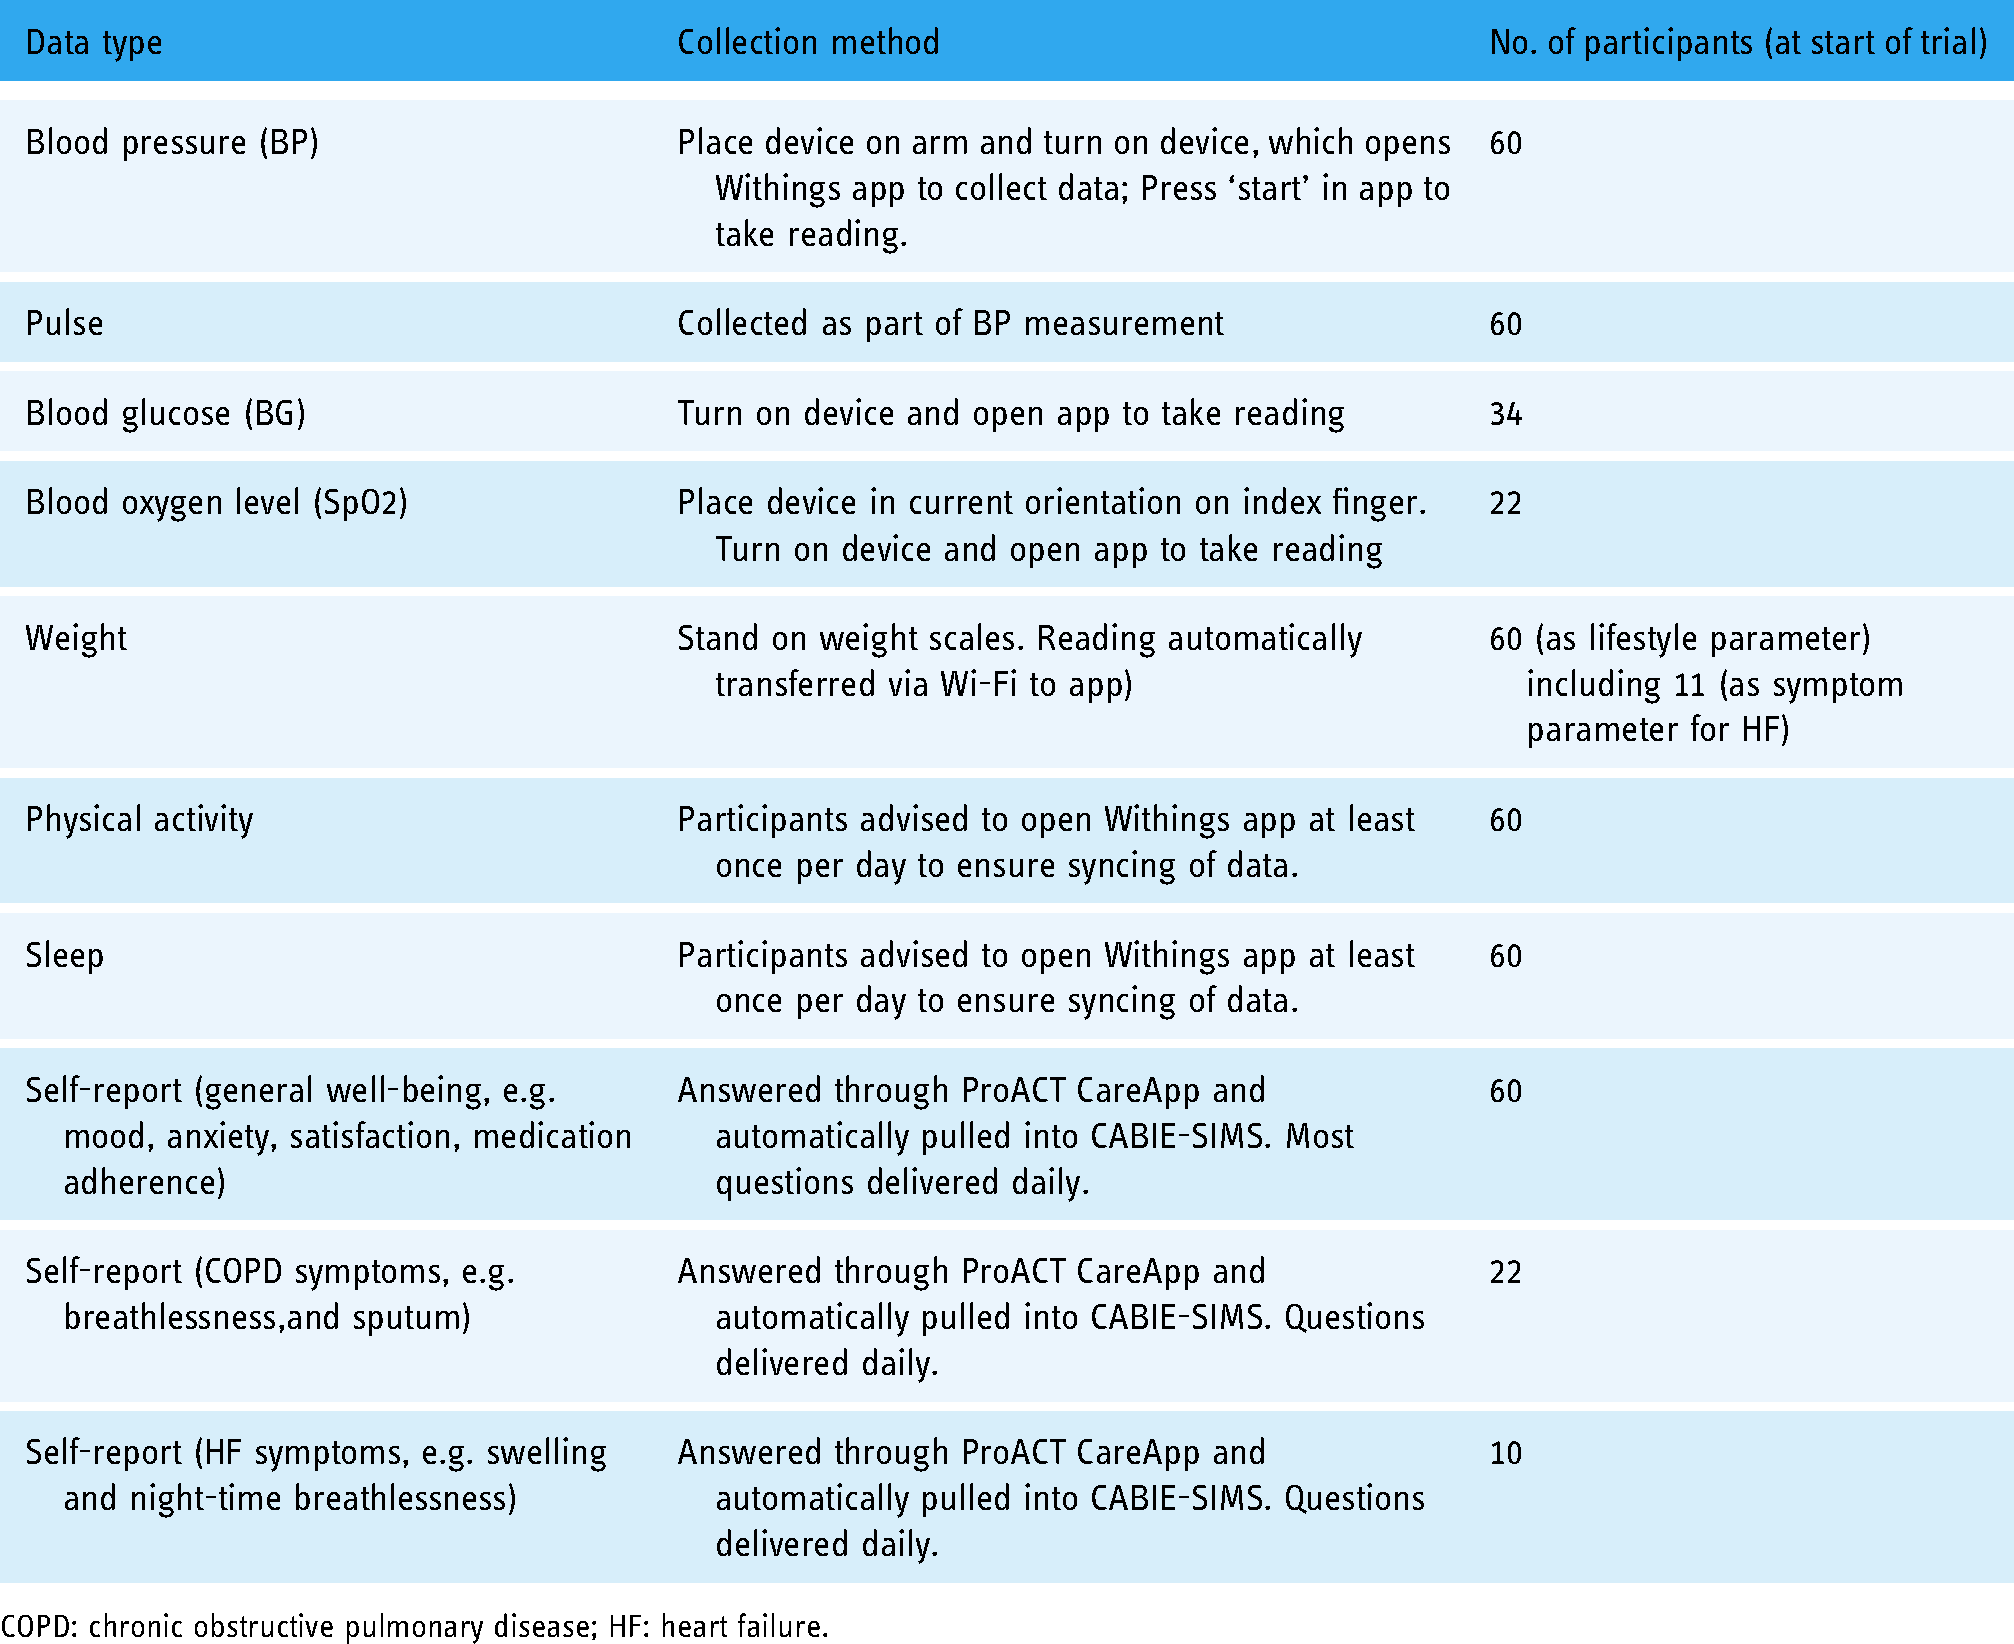
COPD: chronic obstructive pulmonary disease; HF: heart failure.
Participants
A total of 60 older adults were enrolled in the study. The average age of participants was 74 ± 6.4 (65–92 years); 60% (n = 36) were male and 40% (n = 24) were female. The most common combination of conditions was diabetes and HD (n = 30), followed by COPD and HD (n = 16); HF and HD (n = 7); diabetes and COPD (n = 3); diabetes and HF (n = 1); COPD and HF (n = 1); HF, HD and COPD (n = 1) and COPD, HD and diabetes (n = 1). N = 11 participants had HF while n = 55 had HD. Over the course of the trial, eight participants withdrew and three passed away.
Analysis
The format of the original dataset in CABIE-SIMS is JavaScript Object Notation (JSON). A JSON to CSV file converter was first used to make the dataset more accessible to analyse. During the data cleaning phase, the main focus was on dealing with duplicate data and missing data. An example of duplicate data might be where the user had uploaded their SpO2 three times within 2 minutes, which might have been caused by mis-pressing the button. In such cases, only one record was added in the cleaned data file. In terms of missing data, ‘N/A’ was used to replace all the missing data in the dataset file. If the data available for participants were limited and too low resolution for the data to be useful, these participants’ data were treated as missing data and removed from the dataset. The cleaned dataset was analysed using Microsoft Excel, and the R language package of ggplot2, which was mainly used to generate graphs. Survival analysis was used to understand user retention and descriptive statistics, whereas probability density plots were used to understand user engagement.
In this dataset, there are 60 rows and 419 columns including participants’ trial-ID, gender, year of birth, height, conditions and 18,150 daily logs. The total number of interactions with all technology devices is 80,515. For the purposes of this study, if two interactions were recorded from the same devices within 10 minutes of each other, this was counted as one episode of interaction, and only the first submission is counted. This repetition of submissions might be caused by participants who wanted to double check a reading.
Ethical approval
Ethical approval was received from three ethical committees, including the Health Service Executive Northeast Research Ethics Committee (for the HSE committee), School of Health and Science Research Ethics Committee at the Dundalk Institute of Technology and the Faculty of Health Sciences Research Ethics Committee, Trinity College Dublin. All procedures were in line with the EU's General Data Protection Regulation (GDPR) for research projects, with the platform and trial methods and procedures undergoing a data protection impact assessment. Written informed consent was obtained on an individual basis from participants in accordance with legal and ethical guidelines, following a careful explanation of the study and provision of patient information and informed consent forms in plain language. All participants were informed of their right to withdraw from the study at any point without having to provide a reason for this.
Results
The distribution of user retention for using digital health technology at home
The distribution of user retention shows the average retention of how many participants were taking readings, using devices and self-reporting over the trial period. The user retention was counted from each participant's start date and end date.
Figure 1a shows that most participants used ProACT for at least 200 days. There are two key drops shown in the graph. One is at the 200-day point and the second is at 300 days. It seems that user retention has a higher rate of decline after 200 days, hence 200 days after first using the technology is a key landmark. Figure 2a shows that there are more participants whose user retention is over 300 days than there are participants whose user retention is less than 300 days.
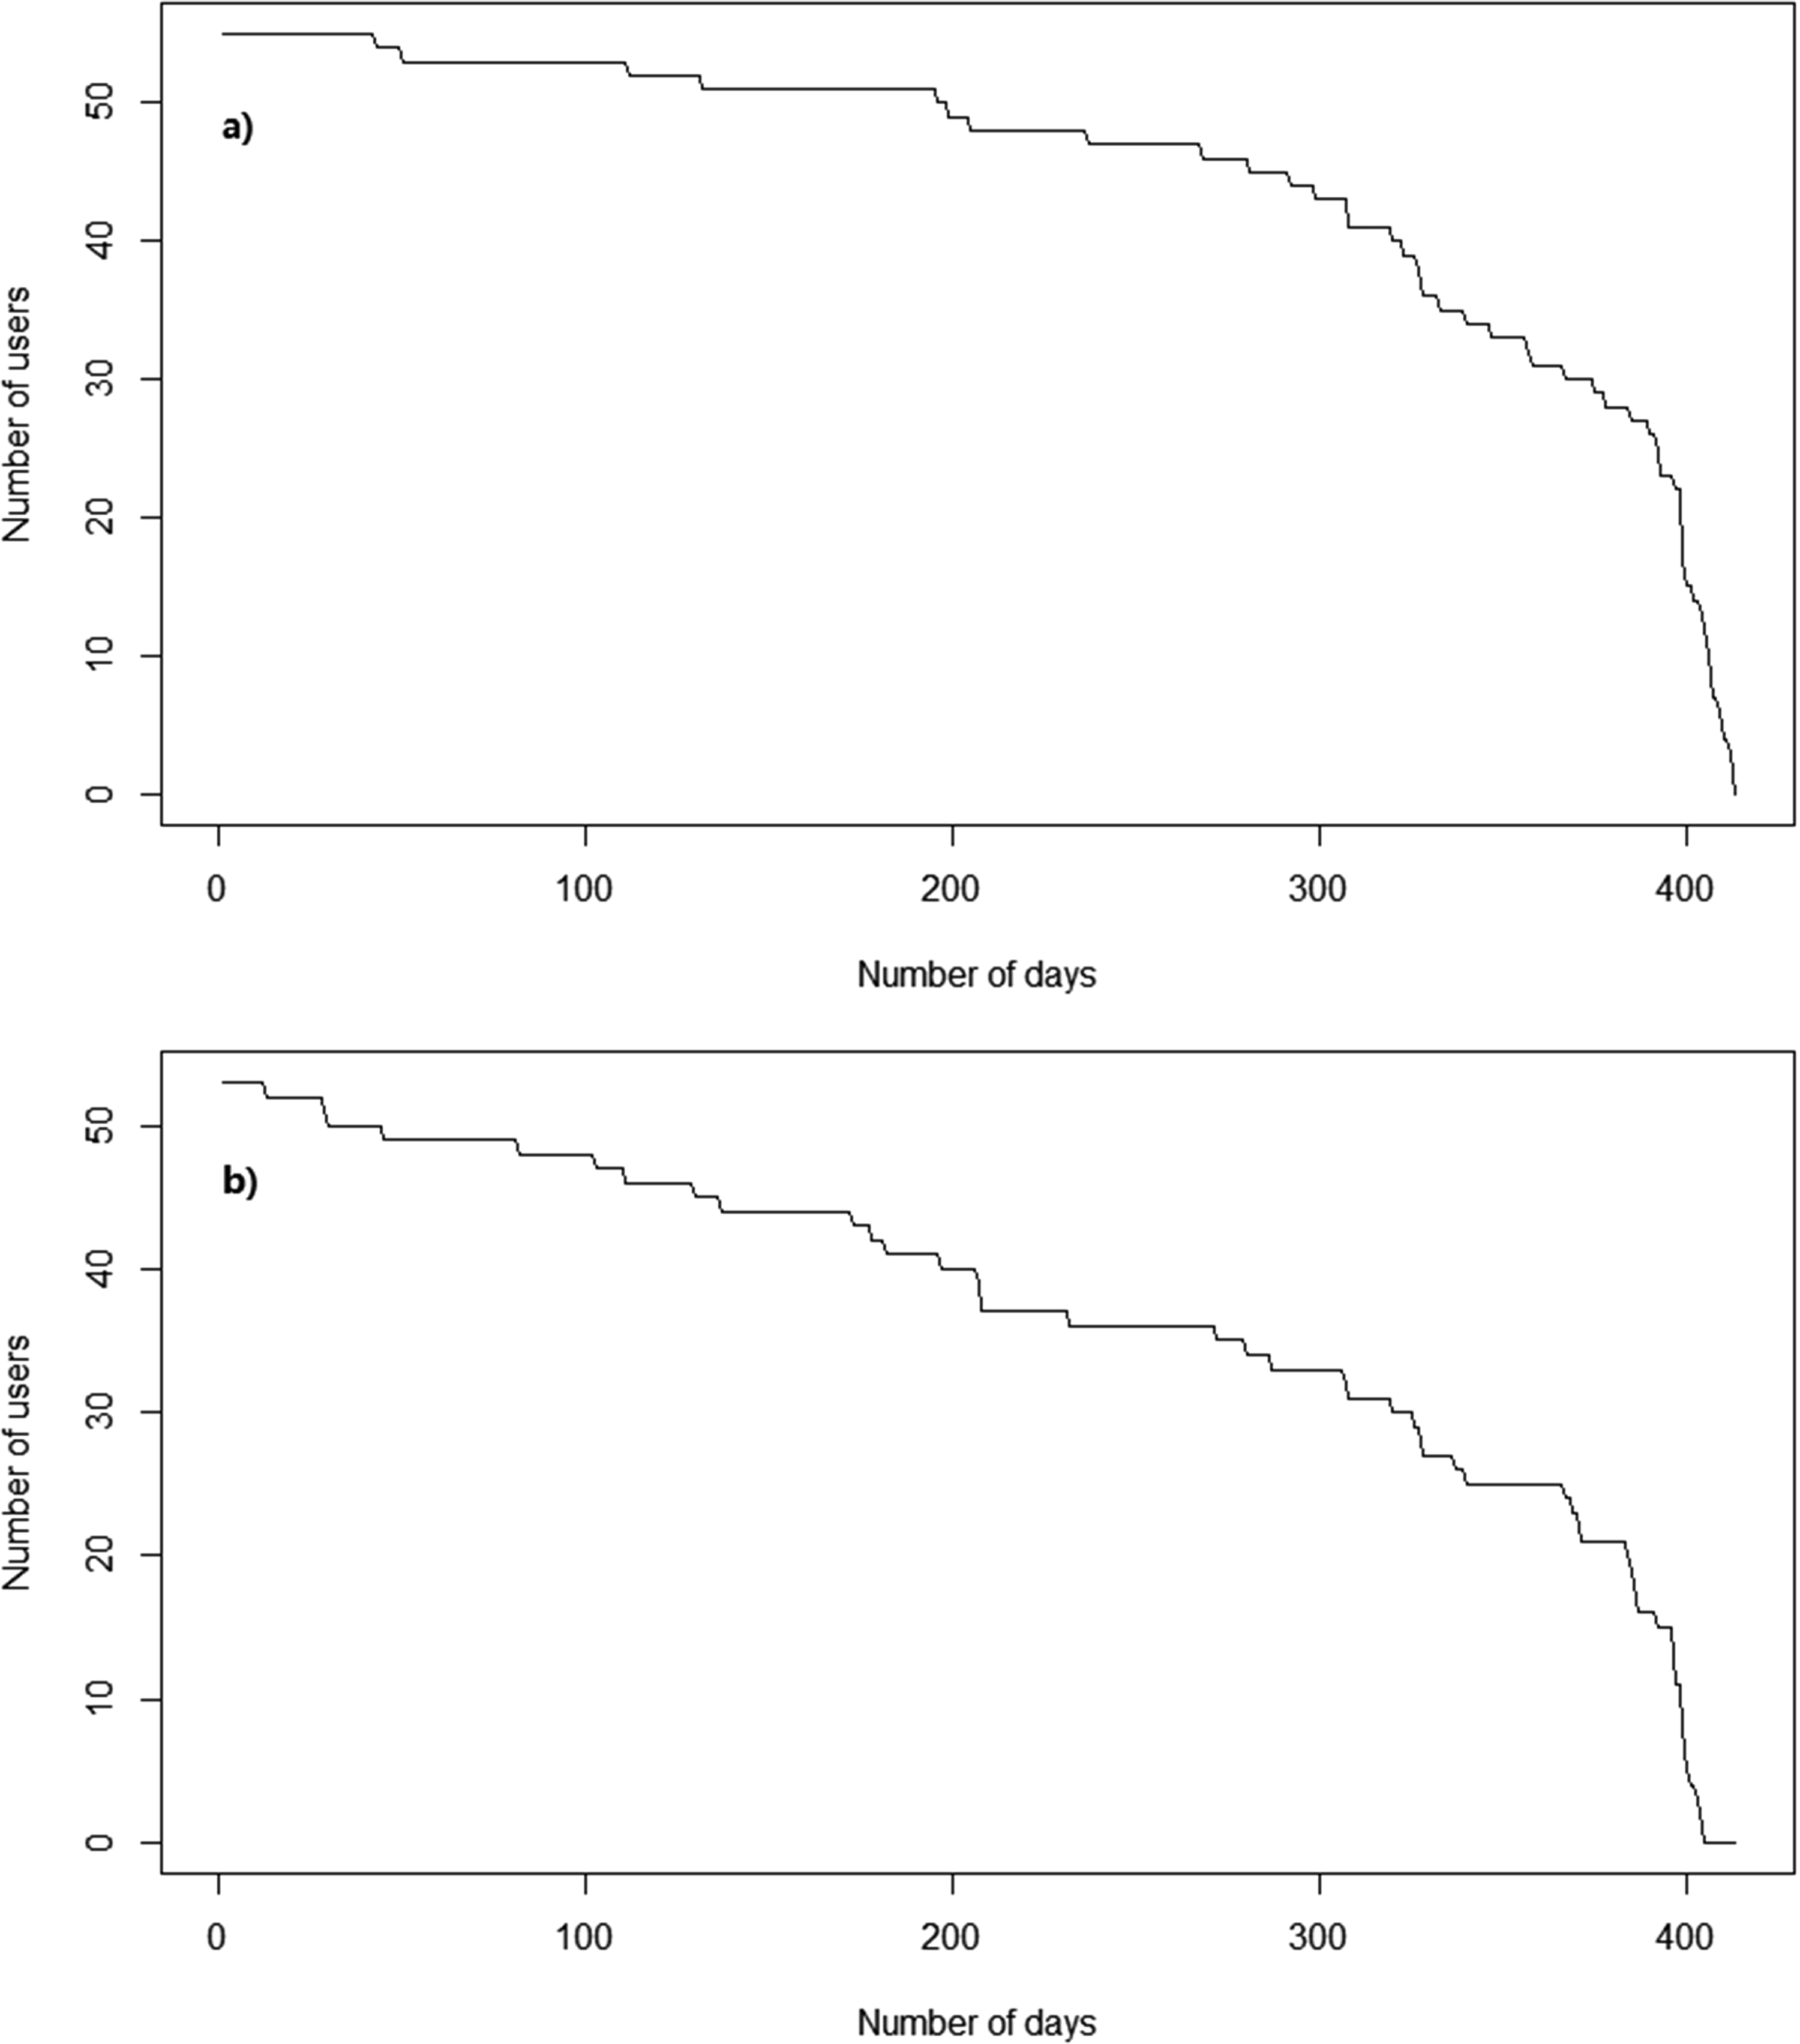
(a) User retention curve of using technology devices and (b) user retention curve of participants using the ProACT CareApp to self-report on their conditions and well-being.

(a) Distribution of user retention for using technology devices and (b) distribution of user retention for participants using the ProACT CareApp to self-report on their conditions and well-being.
The submission of self-report data is different than that of each of the digital health devices. The user retention curve in Figure 1b drops faster than in Figure 1a. At the 200-day point, the drop-off is also more significant than device usage. Besides, Figure 2b shows the number of participants whose user tenure is over 300 days is less than Figure 2a and close to half of the participants did not submit their self-report after 300 days.
The frequencies (times per week) at which participants submit their data
This user retention curve only indicates how many days there are between the first day and the last day that each participant submitted data. It does not indicate the frequency of submission. Figure 3 presents the kernel density of the weekly submission for every parameter. As can be seen, daily exercise data, which includes daily distance walked, daily step count and daily time walking, came into the system six times a week. Similarly, the frequency of sleep coming into the system is close to six times a week for most of the participants. For BG, SpO2, BP and pulse, the submission frequency was mainly between twice a week and five times a week. For weight and self-report, the submission frequency is mainly once a week. It should be noted that those participants with HF monitored weight as a symptom parameter, while all other participants monitored weight as a lifestyle parameter.

Kernel density for user weekly submission frequency.
The average and SD of the intervals (in days) between each submission
Figures 4 and 5 show the average and SD of the intervals between each submission (in days) of each parameter.

The average of the intervals (in days) between each submission (without outliers).

The SD of the intervals (in days) between each submission (without outliers).
As shown in Figure 4, all parameters’ median is less than 5, and the upper quartile of BP, pulse, BG and SpO2 are also less than 5. However, Figure 5 shows that the median SD of BP, pulse, BG and SpO2 are all larger than 20 and close to 25. This means that many participants had large intervals during the trial. Also, the mean of average intervals and the mean of SD intervals can show differences of submissions between every parameter. For example, the mean of the average intervals between each submission (in days) for weight is 6.55, which is similar to daily exercise (5.75) and sleep (6.4). Still, the mean of SD intervals between each submission for weight is 35.61 which is much larger than daily exercise (13.51) and sleep (19.54).
On the other hand, as seen in Figure 4, both the upper quartile and median of daily exercise and sleep are larger than BP, pulse, BG and SpO2, but in Figure 5, the median of daily exercise and sleep is much lower than others. In this case, the intervals of daily exercise and sleep are less than symptom parameters like BP as can be seen from Figure 4, only the minimum of the boxplots of daily exercise and sleep reaches zero, meaning that some participants submitted these two parameters every day during the trial. However, there are some differences between the daily exercise box plot and the sleep box plot, even though these two parameters are collected by the same device. Therefore, sleep data has more outliers than daily exercise data. For example, one of the outliers in SD of intervals for sleep reaches 100, while for daily exercise, none of the outliers is larger than 75.
As shown in Figures 4 and 5, the median of self-report is much higher than other box plots, which means self-report data have more intervals and larger intervals. For example, one participant had average intervals of 23.1 and SD intervals of 278. This is because this participant not only has a few small intervals between May 2018 and June 2018 but also has a very large interval from 6 June 2018 to 25 March 2019.
Unlike symptom parameters, in Figure 4, the box plot of weight is higher and larger than BP, pulse, BG and SpO2. As with other parameters, there are a few participants who have large average intervals and SD intervals. P-025's average intervals are 29.2 and SD intervals are 138.1, while the total number of submissions of weight is 14. P-009's average intervals are 12, SD intervals are 177.6 and the total number of submissions of weight is 44.
What hours of the day do people submit BP, pulse, SpO2, BG and weight readings?
For the majority of days, participants used each device once a day, but some participants engaged more than once a day. If multiple readings from a particular device were submitted to the system within 10 minutes, these are considered as one usage, and only the first submission is counted.
Figure 6 shows 10:00 as the most common time for participants to choose to measure their BP, and 16:00 is the least common day-time hour. There are a few readings during night-time hours, such as 04:00 and 05:00, which might be because some participants felt unwell during the night or slept poorly and woke up early. There are two peaks in Figure 6, one is at 10:00, and another small peak is at 23:00 This might be because participants decided to measure their BP after breakfast and before sleep. 42.79% of the submissions are between 08:00 to 13:00.
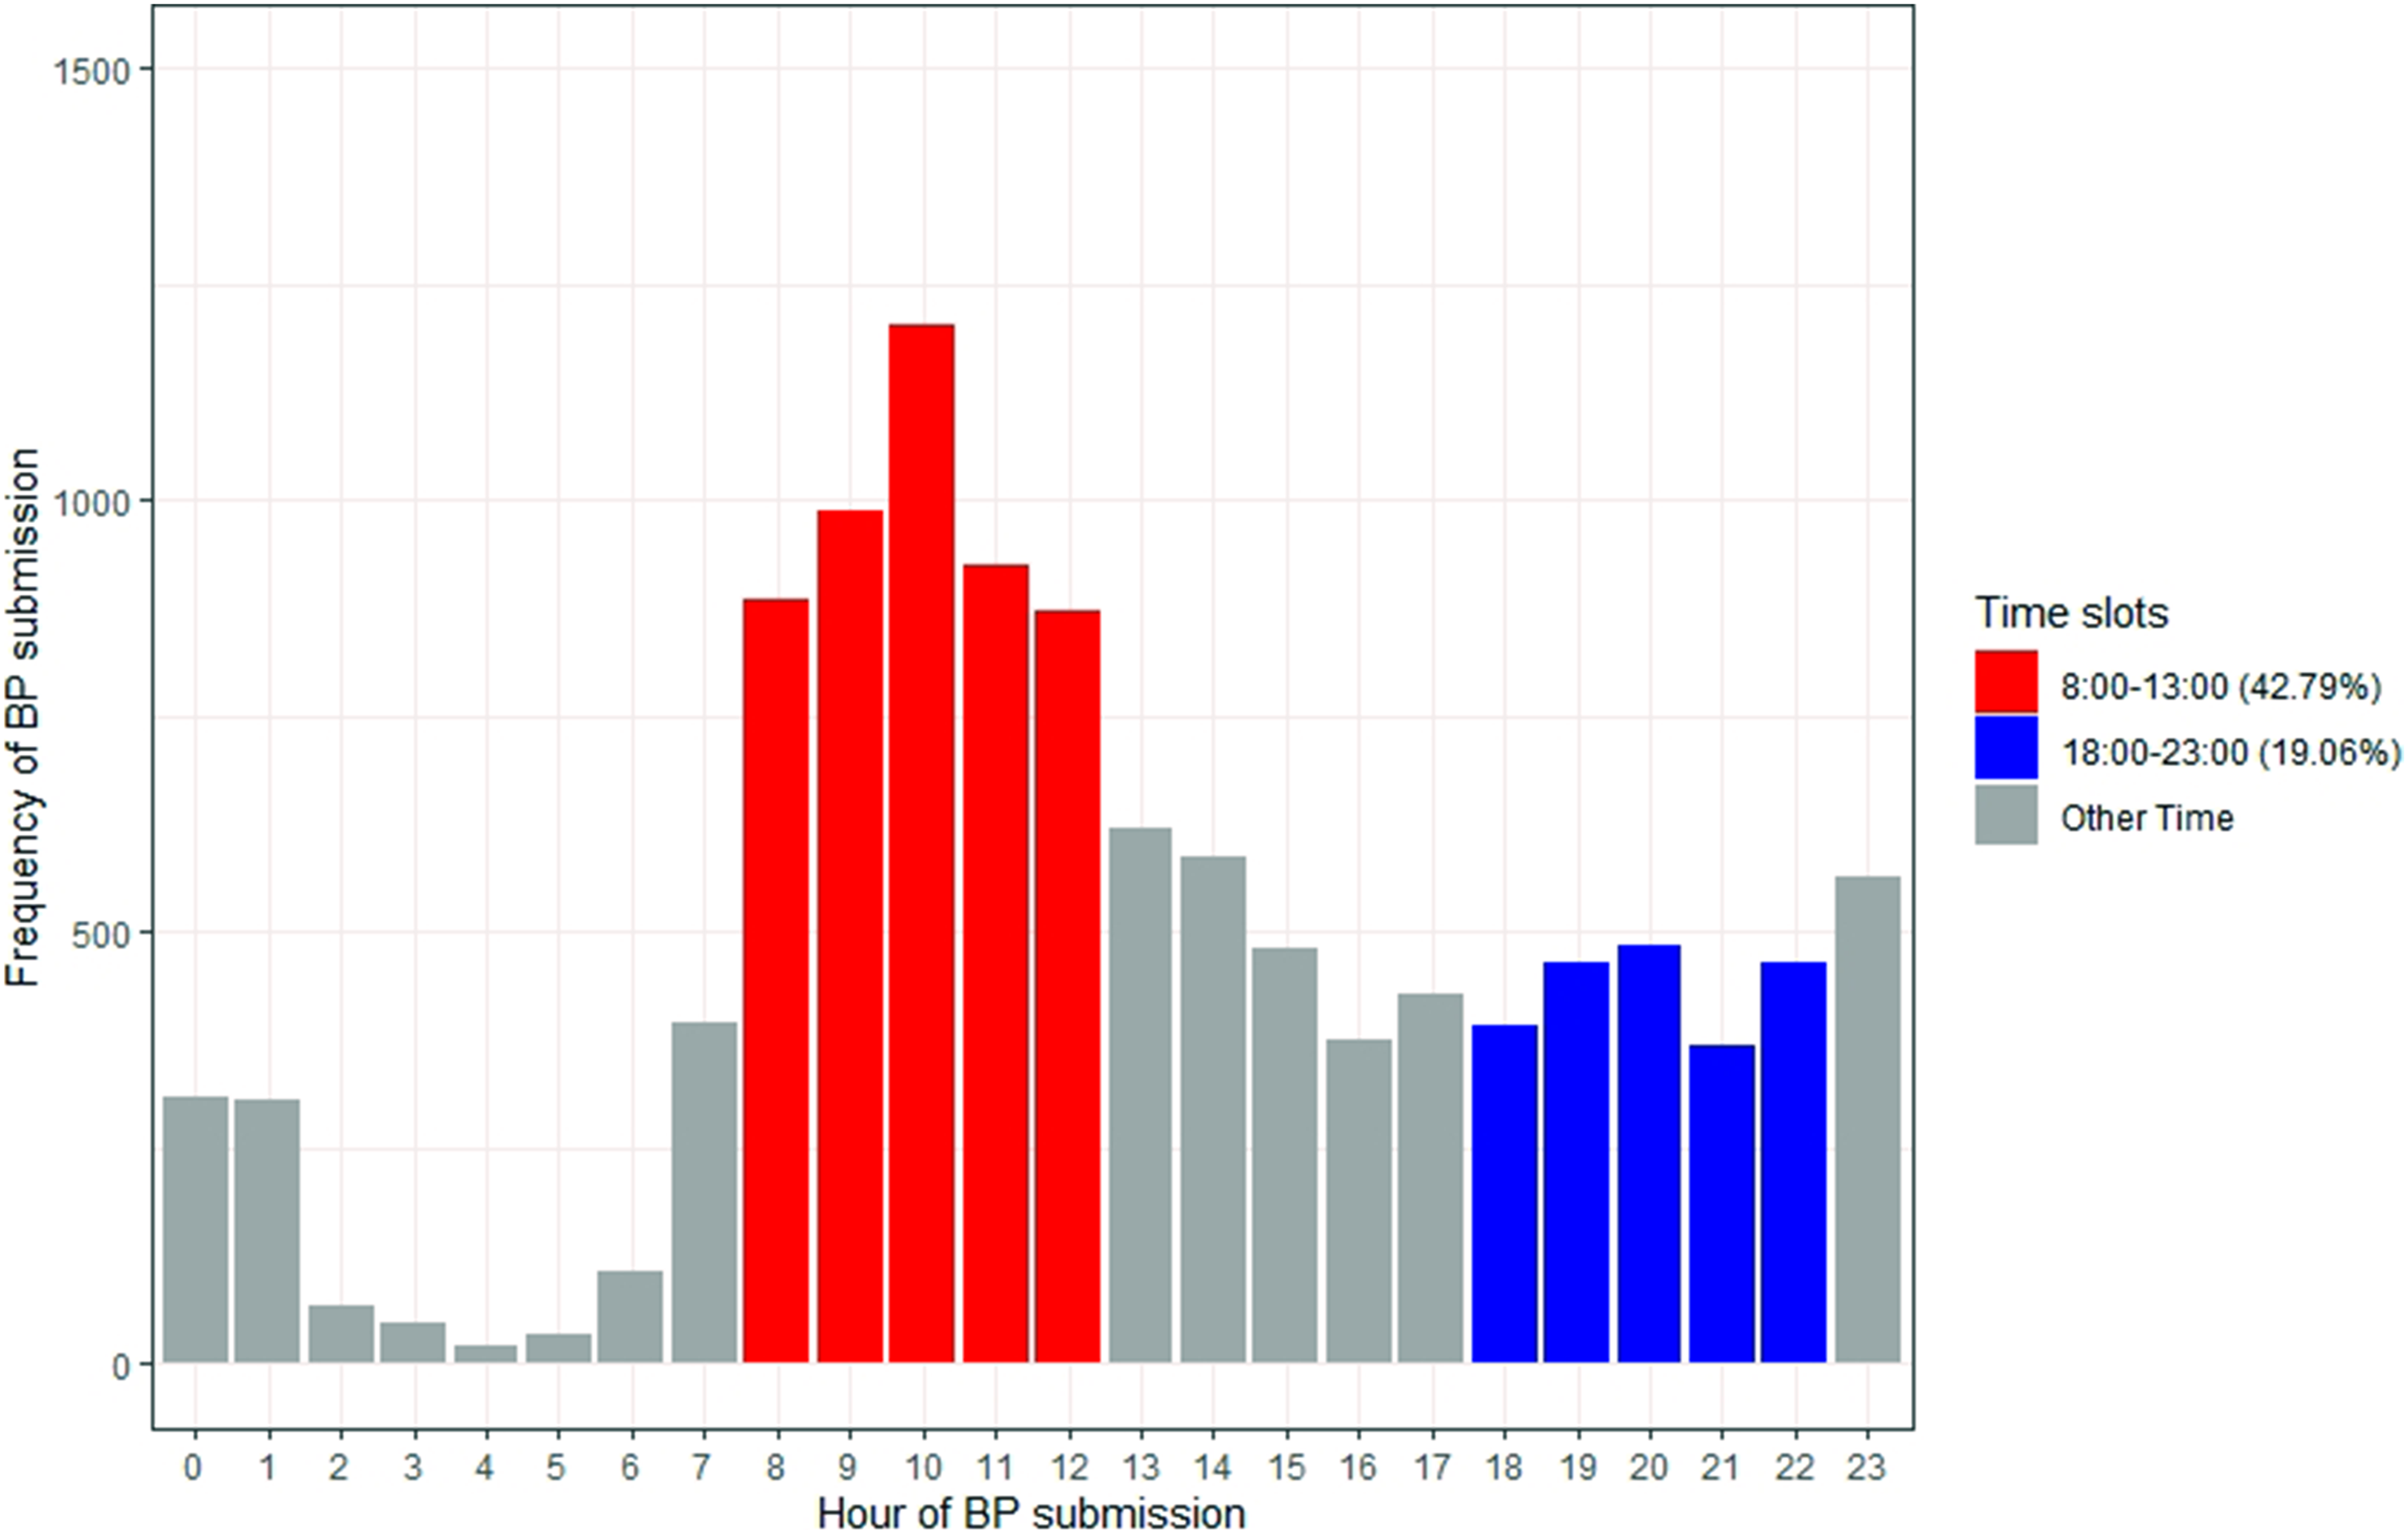
Bar chart of hours that participants submit their blood pressure (BP) (42.79% between 8:00 and 13:00; 19.06% between 18:00 and 23:00).
As shown in Figure 7, the hours of pulse submissions have much in common with BP. 10:00 is the most popular hour and 16:00 is the least popular day-time hour. Also, there are two peaks of submissions at 10:00 and 23:00.

Bar chart of hours that participants submit their pulse (43.26% between 8:00 and 13:00; 19.19% between 18:00 and 23:00).
Figure 8 illustrates that the total submissions of SpO2 are much less compared with BP and pulse, but 10:00 is still the most popular hour of submission, and there are two peaks at 10:00 and 23:00 Also, the proportion of submissions between 08:00 and 13:00 is reduced from 43% to 34%.

Bar chart of hours that participants submit their blood oxygen level (SpO2) (34.48% between 8:00 and 13:00; 25.91% between 18:00 and 23:00).
Figure 9 shows that as with BP, pulse and SpO2, the most popular hour to submit BG readings is at 10:00, and 17:00 is the least popular day-time hour. Also, there are two peaks at 10:00 and 23:00. However, the peaks at 10:00 and 23:00 in BG submissions are more significant than BP, pulse and SpO2. The percentage of BG submissions at 10:00 and 23:00 are 11.6% and 7.01% which are higher than BP (10.58%/4.96%), pulse (10.62%/4.95%) and SpO2 (8.01% 5.89%).

Bar chart of hours that participants submit their blood glucose (BG) (42.3% between 8:00 and 13:00; 18.06% between 18:00 and 23:00).
Unlike other parameters, the most popular hour for participants to take a weight reading is 08:00, while 03:00 is the least popular hour (Figure 10). 62.52% of submissions are between 08:00 and 13:00. In addition, 45.85% of submissions are after 08:00 and before 11:00.

Bar chart of hours that participants submit their weight (62.33% between 8:00 and 13:00; 8.4% between 18:00 and 23:00).
Discussion
Digital health platforms have great potential to improve health and well-being management and improve health outcomes. However, the potential benefits can only be realised if users engage with such platforms. The aim of this article is to explore patterns of engagement through analysis of the data collected during the ProACT trial from older adults who have two or more chronic diseases. Specifically, this analysis asked four questions of the data relating to; the distribution of user retention for self-monitoring using digital devices and self-report, the frequencies (times per week) at which participants submit their data, the average and SD of the intervals (in days) between each submission and the time of day participants submit BP, pulse, SpO2, BG and weight readings.
The key findings are as follows:
Overall engagement and retention with ProACT were high. Only eight participants withdrew, and some of these participants had already collected data for over 100 days before withdrawing. Engagement with digital devices for self-monitoring was high. The majority of participants engaged with ProACT devices for more than 200 days, with many using them for more than 300 days. This could be considered to be in contrast to other research that has suggested that digital health technologies suffer high attrition rates.27,28 Engagement and retention with self-reporting (including answering questions on symptoms not measured by a digital device, as well as general well-being questions) via the ProACT digital application were lower than with digital devices. There were also larger gaps, or intervals, between self-reporting days. The most popular time of day for engaging with monitoring of various symptoms was morning time, with small peaks of engagement evident in the late evening, just before bedtime.
Each of these findings is discussed in further detail below.
The distribution of user retention for submission of data shows the average retention of how many participants were using and engaging with self-management technology devices connected to the ProACT CareApp. Most participants used ProACT for at least 200 days, with a large drop-off occurring at the 300 days time point. There are two different reasons for the drop-off. First, eight participants withdrew from the trial while three participants died during the trial. Second, some participants started later than others, due to difficulties with recruitment, so their overall number of days in the trial are less than other participants. This meant that those participants who started on the trial later stopped using the devices after approximately 10 months in the trial, which accounts for the significant drop-off between 300 days and 400 days. We compared the user retention curve in this study with the user retention curves for other health care apps. 29 Given that the retention curves in other apps take on an ‘L’ shape, this comparison demonstrated that the user retention with ProACT is much better than that of many other health care apps. A discussion of the possible contextual reasons for sustained engagement with ProACT is outside the scope of article, but has been discussed elsewhere, 26 with proposed reasons including a focus on designing with and for the user, usable technology and the human support provided through the clinical triage and a technical helpdesk. A study on engagement with fitness trackers by Asimakopoulos et al. 30 suggests that being able to review one's goal progress through data and receiving tips and education, can foster engagement. These features were present in the ProACT CareApp and therefore may also have played a role in sustained engagement during the trial. Research on older adults engaging with digital health technologies over longitudinal periods is limited. However, Böhm et al. 24 found that older people and those who were recently diagnosed with diabetes used a diabetes self-management app more actively than younger participants over a period of 180 days. Our findings demonstrate that older participants also engaged well with digital self-management, with more than 80% of participants using the technology devices for over 200 days. Our findings extend those of Bohm et al. as participants in our study self-managed two or more chronic conditions and used the technology for a longer period of time (on average 12 months). Compared with other similar research, such as Peng et al., 31 Compernolle et al. 23 and Bengtsson et al., 32 there were more participants in our study (n = 60) and a longer study period. Our findings show that older adults with multiple chronic conditions engaged in digital self-management and maintained that engagement over a longitudinal period of time.
The data showed that daily exercise and sleep data were the most frequently submitted data on a weekly basis, with users submitting such data six times a week. This may be because participants simply had to wear the watch and open an app to sync the data. Further, the watch was battery operated so charging was not required. However, there are still some intervals of exercise and sleep submissions during the trial which can mostly be explained by (1) technical issues, including internet connection issues or devices not syncing; (2) participants stop using the devices for a period of time, for example, when they go on holiday; (3) participants forget to put the watch back on after taking it off; and (4) some participants prefer not to wear the watch overnight. Böhm et al. 24 analysed real-world data from a diabetes support app and found that the total user activity ratio of modules with manual data entry is lower than those without manual data entry, but initial user engagement exhibits the inverse of this. Andersen et al. 33 conducted a qualitative interview study with participants with chronic heart disease who were invited to wear a wearable activity tracker for 3–12 months. The overall engagement in this study was high with an average of 26.1 weeks usage, but in this study, there were only three parameters (real-time heart rate, sleep and step count) which did not require much manual data entry from participants. 34 However, these two studies were only focusing on one disease. In the ProACT study, the symptom data (e.g. BP, pulse, SpO2 and BG) required a number of interaction steps such as placing the device, turning it on and interacting with an app, and this data was submitted twice to five times a week. Participants engaged with BG most (around 4 days a week on average) which could be because people with diabetes need to check their BG regularly. For weight and self-report, the weekly submission frequency is lower than other parameters. Only participants with HF might be expected to take a daily reading of weight, given that weight change is an important indicator of a potential exacerbation. Those monitoring weight as a lifestyle parameter would likely weigh themselves less often, which probably accounts for the lower submission frequency. Also, gaining weight and less physical activity can lead to stopping weight monitoring. 34
The findings show that the user retention of self-reporting data dropped more than the user retention of using the technology, particularly at the 200 days time point. However, in another study by Potts et al., 35 the engagement was low at the start and end of the trial and high at the middle of the trial. In addition, the frequency of submitting self-report was lower than other parameters. There are a couple of possible reasons for this. First, submitting self-report data involved more conscious interaction from the participant, given that they had to open the ProACT CareApp, navigate to the questions section, then reflect on the questions in order to input an accurate answer, making this a fully manual task. However, there are other potential reasons for lower engagement with self-reporting. The same questions were asked throughout the trial, so participants may have become fatigued with answering the same questions. For those participants not monitoring COPD and HF, all of the questions related to general well-being, and participants possibly did not find value in these, and this process of self-reporting could therefore take more time for some participants than using the health monitoring devices. Further analysis of this dataset will examine engagement with self-reporting more closely, for example, to see if those who had to answer symptom questions (COPD and HF) had higher engagement with self-reporting when compared to other participant groups.
Analysing the time of submissions can reveal what time of day participants prefer to interact with digital health interventions. Potts et al. 35 found that the most popular time for people with dementia to answer ecological momentary assessment (EMA) questions is between 21:00 and 22:00. They also found that dismissal rates are relatively low at postprandial times such as 09:00 and 18:00. 35 In the ProACT study, participants were not given any instruction as to how often or at what time of day they should monitor symptom or well-being parameters. The majority of participants interacted with the various devices to monitor symptoms in the morning, with peaks of usage also found in the evening time. Understanding the times that people favour in terms of taking readings could be important for future similar studies. For example, if we know that a person is likely to be engaging with a self-monitoring app at a certain time of the morning, notifications could be pushed at this time reminding them to answer self-report questions. However, pushing multiple notifications at regular intervals throughout the day can reduce the user retention of an app compared with notifications pushed once or twice a day. 36 In addition, sending notifications while participants are using the devices can lead to a higher dismissal rate. 35 Reminders could also be sent for other parameters at certain times, such as before and after mealtimes for those measuring BG, or early in the morning for those with HF monitoring weight. Woodward et al. 37 found that there is a disconnect between evidence-based design recommendations and current practice after they analysed notifications from 50 mHealth apps. They suggest that notifications for participants should not only be based on time, but also according to their context such as symptom parameters. It is also important to consider the type of device being used. For example, if the self-management app is on a tablet device, notifications will likely only be noticed when the person is actually interacting with the device. Different types of persuasive reminders can also influence a participant's decision to engage. 38 For example, Smith et al., found that two types of reminders, ‘Authority’ (e.g. ‘According to experts, a swollen ankle is a sign of heart failure. Please check your ankle now’) and ‘Liking’ (e.g. ‘Your family would appreciate it if you performed your daily weight check so they don't need to worry about you as much. Please check your weight now’) were the most popular types of reminders. 38
Limitations
There are some limitations to the research presented in this article which should be noted. First, by focusing solely on data to understand engagement, without additional contextual information, such as reports by participants themselves, it is difficult to explain the ‘how’ and ‘why’ of the findings. For example, lack of engagement for certain periods may have been due to time in hospital, holidays or technology issues, which do not reflect a lack of desire to engage. Second, while sample size of 60 can be considered relatively high for digital health studies, the sample size for some parameters is lower, as not all participants monitored all parameters.
Conclusions
Ageing demographics, the increase in the number of chronically ill patients and the increase in the workload of care have led to a growing demand for structural reform within health care systems to drive care to the community, providing individuals with opportunities to better self-manage their health and well-being from home.
The aim of this study was to explore patterns of engagement of older adults with multimorbidity with digital self-management over a longitudinal period, in particular by monitoring their symptoms (e.g. BP) and well-being (e.g. activity and self-reported mood). Overall retention and engagement with the platform were high, indicating a willingness of older adults with complex chronic conditions to engage in digital self-management, despite research indicating the numerous challenges associated with this. Patterns and frequencies of usage were presented. Participants engaged more actively with monitoring using digital devices than with self-reporting through the CareApp, indicating a need for designers of such systems to consider how to promote engagement with self-reporting, particularly for reporting on symptoms that cannot be monitored by current sensor technologies. Despite this, these findings constitute a step towards demonstrating the feasibility of supporting older adults with multimorbidity to self-manage in the community.
Planned future work includes (1) examine engagement across different categories of participants; (2) examine physical activity levels of participants in the study over time and by different categories of participants; and (3) conduct a time series analysis to explore any patterns in user submission over time. Based on an understanding of preferred patterns of engagement across different conditions, we will develop a set of guidelines for the design of digital health platforms that help maximise engagement.
Footnotes
Acknowledgement
The authors would like to sincerely thank all of the participants of this research for their valuable time.
Declaration of Conflicting Interests
The authors declared no potential conflicts of interest with respect to the research, authorship, and/or publication of this article.
Contributorship
JDo and JDi conceived and designed the ProACT study.
JDo and JDi were involved in data collection.
YS performed the data cleaning, analysis and interpretation of findings under supervision of RB, JDo and RJ.
SG developed the ProACT platform and data storage mechanisms.
YS wrote the first draft manuscript and all authors were involved in reviewing and refining the text.
Ethical approval
Ethical approval was received from three ethical committees, including the Health Service Executive Northeast Research Ethics Committee (for the HSE committee), the School of Health and Science Research Ethics Committee at the Dundalk Institute of Technology and the Faculty of Health Sciences Research Ethics Committee, Trinity College Dublin.
Funding
The authors disclosed receipt of the follwoing financial support for the research, authorship, and/or publicayion of this article: This work was part-funded by the ProACT project and has received funding from the European Union's Horizon 2020 research and innovation programme under grant No. 689996. This work was part-funded by the EU's INTERREG VA program, managed by the Special EU Programs Body (SEUPB), through the ECME project. This work was part-funded by the Higher Education Authority of Ireland's COVID-19 Relief for Researchers Scheme.
Guarantor
JDo.