
Abstract
Background
Major depressive disorder and bipolar disorder in adolescents are prevalent and are associated with cognitive impairment, executive dysfunction, and increased mortality. Early intervention in the initial stages of major depressive disorder and bipolar disorder can significantly improve personal health.
Methods
We collected 309 samples from the Adolescent Brain Cognitive Development study, including 116 adolescents with bipolar disorder, 64 adolescents with major depressive disorder, and 129 healthy adolescents, and employed a support vector machine to develop classification models for identification. We developed a multimodal model, which combined functional connectivity of resting-state functional magnetic resonance imaging and four anatomical measures of structural magnetic resonance imaging (cortical thickness, area, volume, and sulcal depth). We measured the performances of both multimodal and single modality classifiers.
Results
The multimodal classifiers showed outstanding performance compared with all five single modalities, and they are 100% for major depressive disorder versus healthy controls, 100% for bipolar disorder versus healthy control, 98.5% (95% CI: 95.4–100%) for major depressive disorder versus bipolar disorder, 100% for major depressive disorder versus depressed bipolar disorder and the leave-one-site-out analysis results are 77.4%, 63.3%, 79.4%, and 81.7%, separately.
Conclusions
The study shows that multimodal classifiers show high classification performances. Moreover, cuneus may be a potential biomarker to differentiate major depressive disorder, bipolar disorder, and healthy adolescents. Overall, this study can form multimodal diagnostic prediction workflows for clinically feasible to make more precise diagnose at the early stage and potentially reduce loss of personal pain and public society.
Introduction
Psychiatric disorders, such as major depressive disorder (MDD) and bipolar disorder (BD), are prevalent and detrimental in adolescents,1–3 with a high degree of current and lifetime comorbidities partly due to common etiologies.4,5 BD is one of the most severe and disabling psychiatric conditions affecting youth, significantly impairing an individual's ability to have relationships with family and friends, function at school, and cope with everyday life. 6 Clinically, the diagnosis of psychiatry disorders mainly relies on the clinician's subjective assessment of the patient's complaints and symptoms. Strikingly, it is estimated that approximately 69% of patients with BD are initially misdiagnosed as MDD, 7 which subsequently leads to inappropriate treatment, exacerbated manic symptoms, worse prognosis, increased health-care costs, and serious adverse events such as increased suicidality.8,9 This is probably because depressive episodes are the most common mood manifestation, although BD consists of recurring episodes of mania/hypomania and depression.10,11 Furthermore, childhood- or adolescent-onset are more severe than adult-onset, that is, more prolonged course, worse treatment effect, and more recurrences. 12 Unfortunately, children are often unable to articulate their feelings. 13 Hence, differentiating between BD and MDD in children presents a unique clinical and research challenge. Successfully classification of these two disorders will not only aid diagnostic decisions but also provides insight into their etiology and neuropathological processes.
Recently, researchers have been trying to explore promising neurobiological markers to help identify affective disorders. Accumulating evidence suggests brain magnetic resonance imaging (MRI) presented distinct structural and functional features between healthy individuals and patients with MDD and BD.14–17 A study on distinguishing bipolar and major depressive disorders by brain structural morphometry demonstrated distinct spatially distributed variations in cortical thickness and surface area in patients with BD and MDD. 18 Compared to controls, a larger surface area in the temporo-parietal regions was observed in BD patients, and thinner cortices in fronto-temporal regions were observed in MDD patients, especially in the medial orbito-frontal area. Another study showed that gray matter volume in the right hippocampus, amygdala, parahippocampal, fusiform gyrus, and insula were reduced in BD patients compared with MDD. The volumes of the aforementioned regions and anterior cingulate cortex were also reduced in BD compared with healthy controls (HC). 19 Current neuroimaging studies are often based on functional connectivity (FC) of functional MRI (fMRI) or anatomical features of structural MRI (sMRI). Brain anatomical features are highly biological heterogeneity, complicating the functional connectivity of patients with psychiatric disorders,20,21 and two modalities complement each other. The developed machine learning (ML) methods made it possible to translate neuroimaging findings from the research field to clinical practice for diagnosis by providing individual-level classification. 22 Support vector machine (SVM) is useful for high-dimensional and small sample data23,24 and is one of the most widely used algorithms in diagnostic classification. 25 SVM was used to classify BD and HC with 100% accuracy. 26 In addition, The extensive implementation of ML algorithms on neuroimaging data has gradually identified some markers of psychiatric disorders. A meta-analysis explored the performance of different markers and ML algorithms in classifying several psychiatric disorders and found that the most discriminative features included gray and white matter alterations in the cortico-limbic region, and fMRI activations in this region during emotional tasks. 25 The combination of ML algorithms and neuroimaging data provides objective and reliable analysis, making a growing number of researchers recognize their contribution to psychiatric disorder diagnoses. 27
Despite these efforts, research on direct comparisons of neuroimaging measures between BD and MDD in youth is sparse and has shown inconclusive and inconsistent findings. Firstly, many neuroimaging studies on MDD and BD patients enrolled adult populations, not youths. It may be related to the difficulty in obtaining neuroimaging data of children. Exploring the changes in brain structures and functions in adolescents with MDD and BD is critical for finding early disease biomarkers and taking timely intervention. Early attention to the abnormality of brain functions and structures in adolescents is of great significance for the study of brain development and affective disorders. Secondly, most previous studies used a single modality in classification tasks.23,28 Previous reports have shown multimodal models can produce higher classification accuracy, allowing the exploration of the abnormalities of brain structures and functions from multiple perspectives in MDD and BD patients. Thirdly, most of the existing studies are small sample studies (with a sample size of less than 200), which is far from reaching reliable 29 and consistent 30 conclusions. Biomarkers obtained by analyzing the MRI data from only a dozen subjects are also unreliable and usually need to be validated on larger samples. Simultaneously, the sample size will also affect the performance of the model. The small sample size makes the model unable to be fully trained and easily leads to overfitting. A larger sample size will help improve the stability and robustness of the model, thereby enhancing the reliability of the conclusions drawn. Moreover, the images collected by a single site in most studies made the model generalization ability weak and not easy to be extended to new clinical sites.
To address this gap, the study aimed to develop a high-performance differential diagnosis classifier for MDD and BD based on the data from the Adolescent Brain Cognitive Development (ABCD) study. We developed multimodal models covering five MRI modalities, including functional connectivity of fMRI and cortical thickness, area, volume, and sulcal depth of sMRI. We employed a modality-wise comparison of multimodal and single modality models to obtain the best classifiers. Finally, we discussed a biomarker that can distinguish adolescents with MDD and BD from healthy adolescents based on the best classifiers.
Methods
Dataset and participants
The data used in this study were obtained from the ABCD Data Release 3.0 (https://nda.nih.gov/abcd). The ABCD study is a large longitudinal study of the brain, behavioral development, and child health in the United States, recruiting more than 11,000 adolescent children aged between 9 and 10 years from 21 research sites across the USA. 31 Written and oral informed consents from parents and children have been obtained, respectively. 32 More information is provided at the ABCD website (https://abcdstudy.org) and elsewhere. 33
In this study, a total of 309 adolescents neuroimaging and demographic data who completed baseline tasks, including 116 BD, 64 MDD, and 129 healthy adolescents, were recruited for this study. The diagnoses of BD and MDD complied with the ABCD youth Diagnostic Interview for Diagnostic and Statistical Manual of Mental Disorders, fifth edition (DSM-5) (abcd_ksad501). According to the ABCD Parent Diagnostic Interview for DSM-5 Background Items (KSADS-5), 10 and 3 adolescents with MDD and 17 and 9 adolescents with BD had a history of hospitalization and medication in this study, respectively. Only participants with current MDD or BD, whose imaging data meet MRI Quality Control criteria (abcd_imgincl01) entered the study. We excluded the subjects in case of the following conditions, serious neurological or psychiatric diagnosis, and any traumatic brain injury (TBI). Cognitive function was assessed by the ABCD Youth NIH TB Summary Scores (abcd_tbss01), which consist of 10 validated and reliable psychometric test scores.
Imaging data acquisition and processing
All imaging was collected using a 3T scanner and the neuroimaging parameters are available: https://abcdstudy.org/images/Protocol_Imaging_Sequences.pdf. The ABCD Data Analysis and Information Center (DAIC) performed a series of standard preprocessing pipelines. More details on rs-fMRI and sMRI preprocessing steps and parameters are described in the Supplemental Method.
Details of ABCD neuroimaging data acquisition and processing methods have been previously published.33,34 For rs-fMRI data, the time courses of each region of interest (ROI) obtained by preprocessing are sampled onto the FreeSurfers' cortical surface to calculate the average time course of each ROI. We used 13 predefined networks (e.g. default, fronto-parietal, dorsal attention, etc.) within the Gordon parcellation to calculate the Pearson correlation value of each pair of ROIs, which are Fisher transformed to z-statistics and averaged within or between networks to provide summary measures of network correlation strength. For sMRI data, the Desikan atlas was used to segment cortical regions into 68 ROIs for the whole brain after cortical reconstruction, 35 and the morphological values were measured including cortical thickness, area, volume, and sulcal depth. Finally, a total of 363 features were used as input data for the classification task, including 91 functional connectivity of rs-fMRI (13 within-network and 78 between-network) and 68 brain regions in every modality of sMRI.
Feature selection
Feature selection is necessary to avoid overfitting and the influence of redundant noise.36–38 The recursive feature elimination (RFE) algorithm based on SVM was used to implement this process. RFE is an effective feature selection algorithm that uses the accuracy yielded by SVM to determine which features contribute most to the prediction results.37,39,40 Training on the original, each feature was assigned a weight coefficient, and those features with the most negligible absolute weight were kicked out of the feature set. After multiple iterations, the features of small weight coefficients were removed until the remaining features reached optimal performance.
The feature selection process was embedded into the main prediction pipeline. The features required to achieve the highest accuracy via 10-fold stratified cross-validation were used as input to the model. This process was achieved by characterizing the learning curve of SVM-RFE, which shows the accuracy corresponding to the number of selected features by the weight vector of 10-fold stratified cross-validation. As a comparison, we measured model prediction performance without RFE.
SVM classification and evaluation
Synthetic Minority Oversampling Technique with Tomek link (SMOTETomek),41–43 a method that combines over- and under-sampling, was implemented to correct the impacts of imbalanced data. We selected the linear kernel of SVM,24,44 which could yield the feature importance to the classification. In addition, there is only one parameter C in linear kernel SVM, 43 which reflects the tolerance of the model to the classification error and is used to balance between the correct classification of training samples and the maximization of the margin of the decision boundary. In this study, we set the hyper-parameter C to the default value of 1, as previous reported.43–45
Model performances were measured with standard metrics including accuracy, sensitivity, specificity, AUC (Area Under Curve), F1-score, positive predictive value (PPV), and negative predictive value (NPV), which are measured by 10-fold stratified cross-validation. The images in this study are from multiple sites, thus we perform a leave-one-site-out (LOSO) analysis embedded with 10-fold stratified cross-validation to test the site effects of 21 sites to verify the model's generalization. Specifically, an entire site was excluded from each round and the remaining 20 sites were used as the training set for feature selection. The hold-out site as the test set is used to calculate the performance by the important features selected from the training set to test the generalizability of these features in the new site. Site effect is considered significant if the 95% CI for the performance of any hold-out site does not overlap with other sites.46,47
Statistical analysis
A linear model was employed to correct the feature values of fMRI and sMRI. This process was implemented in R statistical software version 3.6.1 (https://cran.r-project.org). All continuous variables were normalized to the standard normal distribution to avoid the influence of non-uniform dimensions. The aforementioned procedures were implemented on Python version 3.8.6 (https://www.python.org). Analysis of variance and χ2 test were used for continuous and categorical measures, respectively. A two-sided P-value less than 0.05 was considered statistically significant.
Results
Demographic and clinical characteristics
Table 1 lists the demographic and clinical characteristics of the three groups. Our data analysis included 64 MDD adolescents, 116 BD adolescents, and 129 healthy controls. Data in the study were baseline data at enrollment. Participants did not differ significantly in age, gender, hand dominance, and medication history, but there were significant differences in standard intelligence scores, ethnicity, and hospitalization history. Given the significant difference in standard intelligence scores, ethnicity, and hospitalization history, we regressed these variables, along with other potentially confounding variables (including gender, age, and medication history) from neuroimaging features by linear models to eliminate confounding effects.48,49
Demographic and clinical characteristics of participants.

Data are expressed as n (%) or mean ± standard deviations. Bold represents statistically significant differences.
BD: bipolar disorder; BD-I: bipolar I disorder; BD-II: bipolar II disorder; BD-NOS: unspecified bipolar and related disorder; HC: healthy controls; MDD: major depressive disorder.
P-value was obtained from ANOVA analysis.
P-value was obtained from χ2-test
Feature importance
The optimal number of input features is 19–64 for five single modality classifiers achieving the highest accuracy, and more features are required, 34–102 features for multimodal classifiers, see Figure 1 and Supplemental Figure 1. The feature selection process significantly improved prediction performance.

The learning curves of the multimodal classifiers in the 10-fold stratified cross-validation SVM-RFE algorithm. The x-axis shows the numbers of selected features, and the y-axis shows the corresponding accuracy.
The top-ten features of the multimodal SVM classifier are shown in Figure 2, while others are in Supplemental Tables 2 and 3. Cuneus is the only overlapping region among the top-ten features in the multimodal classifier, which was also found when distinguishing depressed BD patients from depressed MDD patients. This indicates that cuneus may be a potential biomarker to differentiate MDD, BD, and healthy adolescents.
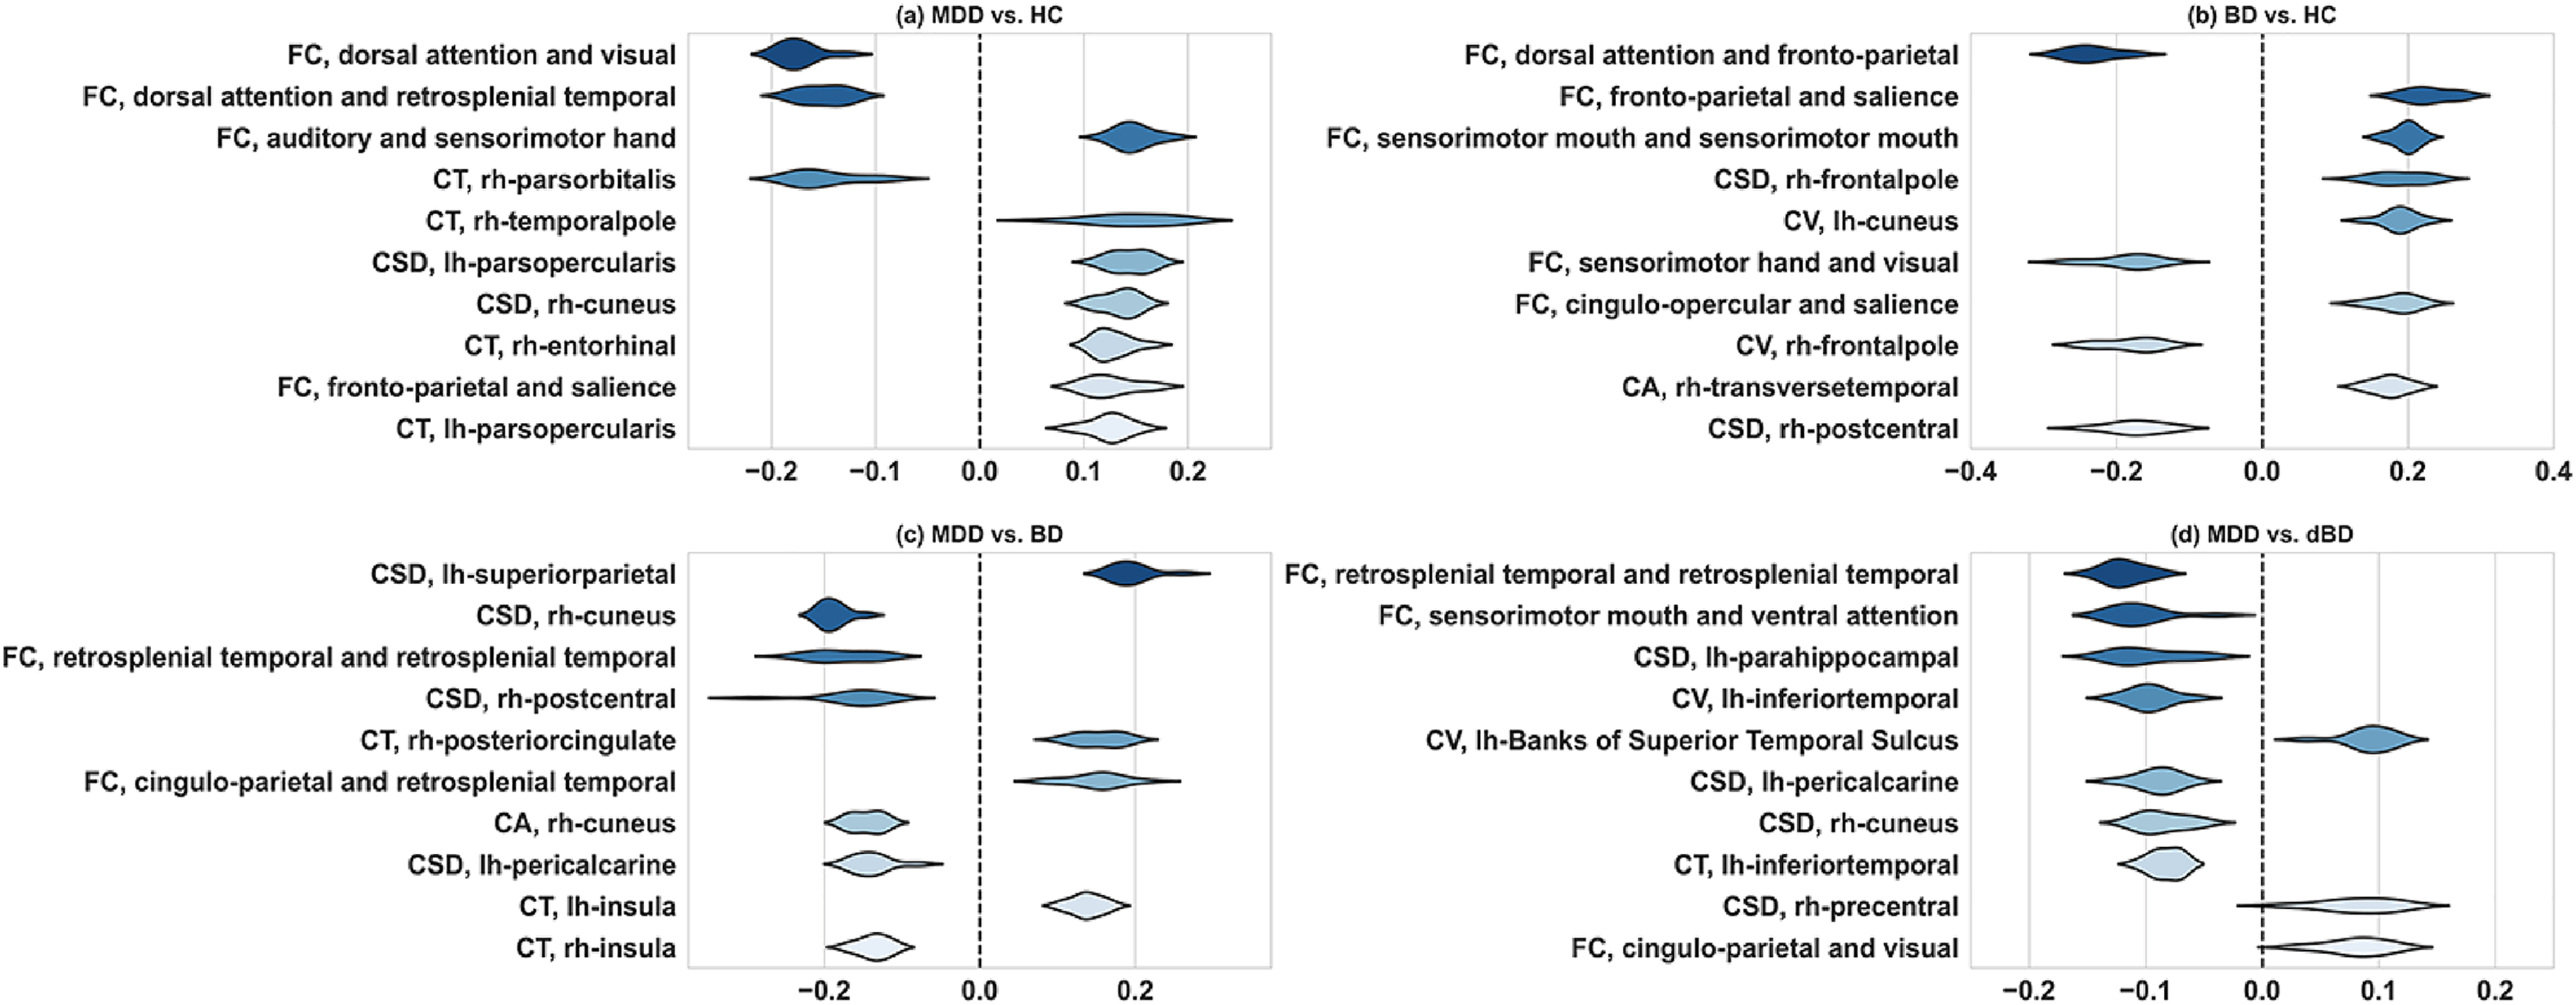
The top-ten features of multimodal classifiers in different classification tasks. The x-axis represents the feature's weight coefficient, and the y-axis represents the feature name. The average weight coefficient of each feature is determined by 10-fold cross-validation in SVM. Positive and negative coefficients represent positive and negative correlations. The higher the absolute value of the feature coefficient, the more significant impact of the feature on the model classification results.
The feature selection improved the performances of all modality classifiers, see Figure 3. The accuracies were significantly improved from 51.8–80.0% to 98.5–100% in multimodal classifiers and increased moderately from 45.4–74.6% to 66.5–86.9% in five single modalities, as shown in Supplemental Tables 4 and 5.

Performance comparison between without and with feature selection.
Comparing the performance of all classifiers based on feature selection, multimodal classifiers yielded the highest scores than others (Table 2). The multimodal performances greatly exceed the chance level of 50%, as well as the clinically relevant threshold of 80%.44,50,51 The receive operating characteristic (ROC) curves and the area under the curve (AUC) are presented in Figure 4, and the confusion matrix is illustrated in Figure 5.

Receiver operating characteristic curves diagram of multimodal and single modality classifiers.

Confusion matrix for multimodal classifiers.
Performance comparison between multimodal and single modality classifiers based on RFE-SVC feature selection.

Data are classification accuracy (95% confidence intervals generated from 1000 bootstrap samples).
rs-fMRI: resting-state functional magnetic resonance imaging; sMRI: structural magnetic resonance imaging; BD: bipolar disorder; dBD: depressed bipolar disorder; MDD: major depressive disorder; HC: healthy controls; FC: functional connectivity; CV: cortical volume; CT: cortical thickness; CSD: cortical sulcal depth; CA: cortical area.
Sensitivity analyses
Finally, the LOSO analysis results are shown in Supplemental Figure 2. The site effect was not significant at 21 sites.
Discussion
The classification models used in this study to distinguish MDD, BD, and healthy adolescents were developed by 10-fold stratified cross-validation based on RFE-SVM. The accurate classifications of psychiatric disorders in adolescents based on neuroimaging are mainly attributed to the effect of multimodal. We regressed the confounding effects of latent variables using linear models and used the SMOTETomek algorithm to balance the sample size between groups to ensure fair and reliable results. Moreover, we found differences in the predictor required by several classifiers for accurate diagnosis. ML brings neuroimaging analyses to individual subject levels and allows prognostic formulation and treatment prescriptions to be tailored to the individual profile.
Accumulated MRI research studies have gradually improved the performance of machine learning algorithms in adult psychiatric disorder classification. Furthermore, the application of multimodal features has greatly improved model performance because multimodal features can provide multi-view information more than a single modality. A study achieved a high accuracy of 92.1% for distinguishing MDD and BD by using a multimodal method that combines the fractional amplitude of low-frequency fluctuations (fALFFs) of rs-fMRI and the gray matter volume of sMRI. 24 However, this conclusion was based on adult data and has not been validated in children and adolescents. Our multimodal models were constructed based on the adolescent neuroimaging data and obtained superior performance.
The functional and morphological abnormalities of the MDD and BD patients may be reflected in multiple brain regions and morphologies, so the classification performances of five single modality classifiers are slightly inferior. A study used the single modality of sMRI (gray matter volume) to classify BD and MDD with 75% accuracy. 52 Another study used SVM of Elastic Net feature selection to classify MDD and HC on functional connectivity, and obtained 76.1% accuracy. 53 Our study achieved slightly higher performance in the same modality and classification task; that is, 78.4% accuracy uses cortical volume to distinguish MDD and BD, and 83.3% accuracy uses fMRI to distinguish MDD and HC. But it should also be noted that our study focused on populations and brain regions, unlike the above two studies. Grotegerd et al. 45 used fMRI to distinguish between unipolar and bipolar depression (bipolar: 10, unipolar: 10, control: 10) with nearly 90% accuracy. However, the small sample size makes the model unable to be fully trained and easily leads to overfitting, which in turn reduces the stability of the model and the reliability of the conclusion.
In terms of single modality, we did not find any single modality classifier to overperform other classifiers in classifying MDD, BD, and HC. Claude et al. 54 speculated that the classification performances based on fMRI might outshine sMRI. In distinguishing between MDD and BD patients, six studies using sMRI as the input features obtained accuracies ranging from 54.76% to 75.9%,18,39,52,55–57 compared with 67% to 93.1% in nine fMRI-based studies.18,45,58–64
Cuneus may be a potential predictor, which to some certain extent sheds light on the physiological mechanism of MDD and BD. We found that the weight coefficients for cuneus were considerably high for all classifiers. The cuneus is associated with inhibitor control and motor response, 65 which is part of the default mode network (DMN), and its abnormal activation is related to depression. The greater activation of the right cuneus cortex at baseline is associated with a more remarkable improvement in the symptoms of depression and anxiety.66,67 A global meta-analysis confirmed that the activation of the right cuneus was increased in patients with MDD. 68 Some evidence suggests that individuals with or at risk for depression are associated with structural alterations in the cuneus.69–71 Previous studies have reported that cuneus gray matter volume is associated with depression 72 and suicidal behavior73,74 in MDD adults. Kim et al. 75 found that MDD adolescents have a thinner cortical thickness in the cuneus. In addition, two positron emission tomography (PET) studies both show that the metabolic activity of the right cuneus is positively correlated with the severity of apathy,76–78 which is defined as a negative emotion with decreased feeling, and interest and attention. 77 Recognizing biomarkers can more timely and accurately diagnose MDD and BD, help individualized treatment and treatment response prediction, and provide the possibility for distinguishing subtypes of MDD and BD. 3
Multimodal features provide rich brain functional and anatomical information, enabling the model to perform well. It is also vital that RFE-SVM select the best predictive features for multiple classification models. In addition, we used LOSO to internally validate the development of several multimodal models. We achieved about 70% accuracy in the LOSO analysis and close to 100% in the aggregate 10-fold cross-validation. In our study, perhaps due to the lack of prior knowledge of the test site, 79 LOSO classification accuracy is somewhat lower than that of all site's aggregate classification. Similarly, an ENIGMA study, which collected MRI data from 13 sites, yielded 58.67% mean accuracy in the LOSO analyses and 65.23% in aggregate 10-fold cross-validation in classifying bipolar and healthy participants. 43 Importantly, our research focuses on adolescents, which is conducive to the early identification of potential high-risk MDD and BD individuals and is essential for early diagnosis and treatment during childhood or adolescence.
This study has limitations and also potential for expansion. Our findings are based primarily on cortical regions, excluding subcortical regions, such as the hippocampus, amygdala, and thalamus, which have been identified as being associated with psychiatric disorders.80,81 The sample size of this study was modest, and further large-high-quality training datasets from multi-site and external validation are required to improve the generalization of the diagnostic model. Moreover, as a complex disease, multi-omics studies are needed to consider the inclusion of more dimensional predictors such as demographic and clinical variables, genes, blood, and cognition.
Conclusion
In this adolescent study, we combined the functional connectivity of fMRI and four anatomical measurement values of sMRI (cortical thickness, area, volume, and sulcal depth) to build multimodal models. On this basis, we have developed several classification models with high accuracy and good generalization, which can form multimodal diagnostic prediction workflows for clinically feasible and individual-level predictions in MDD and BD adolescents.
Supplemental Material
sj-docx-1-dhj-10.1177_20552076221123705 - Supplemental material for Distinguish bipolar and major depressive disorder in adolescents based on multimodal neuroimaging: Results from the Adolescent Brain Cognitive Development study®
Supplemental material, sj-docx-1-dhj-10.1177_20552076221123705 for Distinguish bipolar and major depressive disorder in adolescents based on multimodal neuroimaging: Results from the Adolescent Brain Cognitive Development study® by Yujun Liu, Kai Chen, Yangyang Luo, Jiqiu Wu, Qu Xiang, Li Peng, Jian Zhang, Weiling Zhao, Mingliang Li and Xiaobo Zhou in Digital Health
Footnotes
Acknowledgements
Data used in the preparation of this article were obtained from the Adolescent Brain Cognitive DevelopmentSM (ABCD) Study (https://abcdstudy.org), held in the NIMH Data Archive (NDA). This is a multisite, longitudinal study designed to recruit more than 10,000 children aged 9–10 and follow them over 10 years into early adulthood. The ABCD Study® is supported by the National Institutes of Health and additional federal partners under award numbers U01DA041048, U01DA050989, U01DA051016, U01DA041022, U01DA051018, U01DA051037, U01DA050987, U01DA041174, U01DA041106, U01DA041117, U01DA041028, U01DA041134, U01DA050988, U01DA051039, U01DA041156, U01DA041025, U01DA041120, U01DA051038, U01DA041148, U01DA041093, U01DA041089, U24DA041123, U24DA041147. A full list of supporters is available at https://abcdstudy.org/federal-partners.html. A listing of participating sites and a complete listing of the study investigators can be found at ![]() . ABCD consortium investigators designed and implemented the study and/or provided data but did not necessarily participate in the analysis or writing of this report. This manuscript reflects the views of the authors and may not reflect the opinions or views of the NIH or ABCD consortium investigators.
. ABCD consortium investigators designed and implemented the study and/or provided data but did not necessarily participate in the analysis or writing of this report. This manuscript reflects the views of the authors and may not reflect the opinions or views of the NIH or ABCD consortium investigators.
Contributorship
YJL and LP researched literature and conceived the study. YJL and KC involved in data analysis. YJL, YYL, JQW, KC, QX, LP, MLL, and JZ involved in clinical investigation and data curation. YJL wrote the first draft of the manuscript. WLZ, YYL, JQW, KC, and JZ involved manuscript proofreading. XBZ supervised overall implementation. All authors reviewed and edited the manuscript and approved the final version of the manuscript.
Declaration of conflicting interests
The authors declared no potential conflicts of interest with respect to the research, authorship, and/or publication of this article.
Ethics approval
The study was reviewed and approved by the West China Hospital of Sichuan University Institutional Review Board.
Funding
The author(s) disclosed receipt of the following financial support for the research, authorship, and/or publication of this article: This work was supported by the 1.3.5 project for disciplines of excellence–Clinical Research Incubation Project, West China Hospital, Sichuan University, Center of Excellence-International Collaboration Initiative Grant, West China Hospital, Sichuan University (grant nos. 2019HXFH022, 139170052).
Guarantor
YJL.
Supplemental material
Supplemental material for this article is available online.
References
Supplementary Material
Please find the following supplemental material available below.
For Open Access articles published under a Creative Commons License, all supplemental material carries the same license as the article it is associated with.
For non-Open Access articles published, all supplemental material carries a non-exclusive license, and permission requests for re-use of supplemental material or any part of supplemental material shall be sent directly to the copyright owner as specified in the copyright notice associated with the article.