
Abstract
Background
Patients with severe bone fractures and complex bone deformities are treated by orthopedic surgeons with external fixation for several months. During this long treatment period, there is a high risk of inflammation and infection at the superficial skin area (pin site). This can develop into a devastating, sometimes fatal, and always costly condition of deep bone infection.
Objective
For pin site infection surveillance, thermography technology could be the solution to build an objective and continuous home-based remote monitoring tool to avoid frequent nursing care and hospital visits. However, future studies of infection monitoring require a preliminary step to automate the process of locating and detecting the pin sites in thermal images reliably for temperature measurement, and this step is the aim of this study.
Methods
This study presents an automatic approach for identifying and annotating pin sites on visible images using bounding boxes and transferring them to the corresponding thermal images for temperature measurement. The pin site is detected by applying deep learning-based object detection architecture YOLOv5 with a novel loss evaluation and regression method, control distance intersection over union. Furthermore, we address detecting pin sites in a practical environment (home setting) accurately through transfer learning.
Results and conclusion
The proposed model offers the pin site detection in 1.8 ms with a high precision of 0.98 and enables temperature information extraction. Our work for automatic pin site annotation on thermography paves the way for future research on infection assessment on thermography.
Introduction
An External Fixator (EF) in Figure 1 is a device orthopedic surgeons use to save, correct, and reconstruct lower limbs after fractures. It consists of an external frame connected to the bone inside the limb with pins and wires. The fixation of the bone is important to obtain a stable construct for bone healing. The pin site, as highlighted with the blue bounding box in Figure 2(b), is the skin region where the pins and wires pass through the skin. There is a high risk of infection at the pin site during treatment since it is an open wound. The time period for treatment with an EF after a lower limb bone fracture is typically 3–12 months, and previous studies have reported that up to 50% of the patients suffer from mild to severe infection during that period. 1 Infection can become a serious situation for the patient; the construction can become less stable, resulting in slow or lack of bone healing, or the patient can become acute septic, and in the worst case, the patient will need an amputation of the limb. During the treatment period with an EF, there is a need to monitor the patients frequently, and they have nursing care for cleaning and dressing the wounds to avoid infections one to several times weekly. Patients are examined at routine check-ups at the hospital and have X-rays every week or every few weeks throughout the whole treatment period as well. The post-surgical care regime and multiple outpatient clinic visits in the hospital are time and resource-consuming, both for patients and the healthcare system. Today, patients are discharged earlier from hospitals, shifting the postoperative surveillance to the home of the patient. The care is thus transferred from the highly specialized hospital to surveillance by municipality home nurses and general practitioners. During this shift, both information and knowledge of postoperative care are often lost, leaving the patient with uncertainty. A lack of agreement on the definition of surgical site infection by clinicians and little evidence of systematic measurement and monitoring of wounds after discharge from the hospital enhance this uncertainty. To summarize, there is a need to develop a point-of-care tool warning about early signs of infection to prevent complications of surgery.
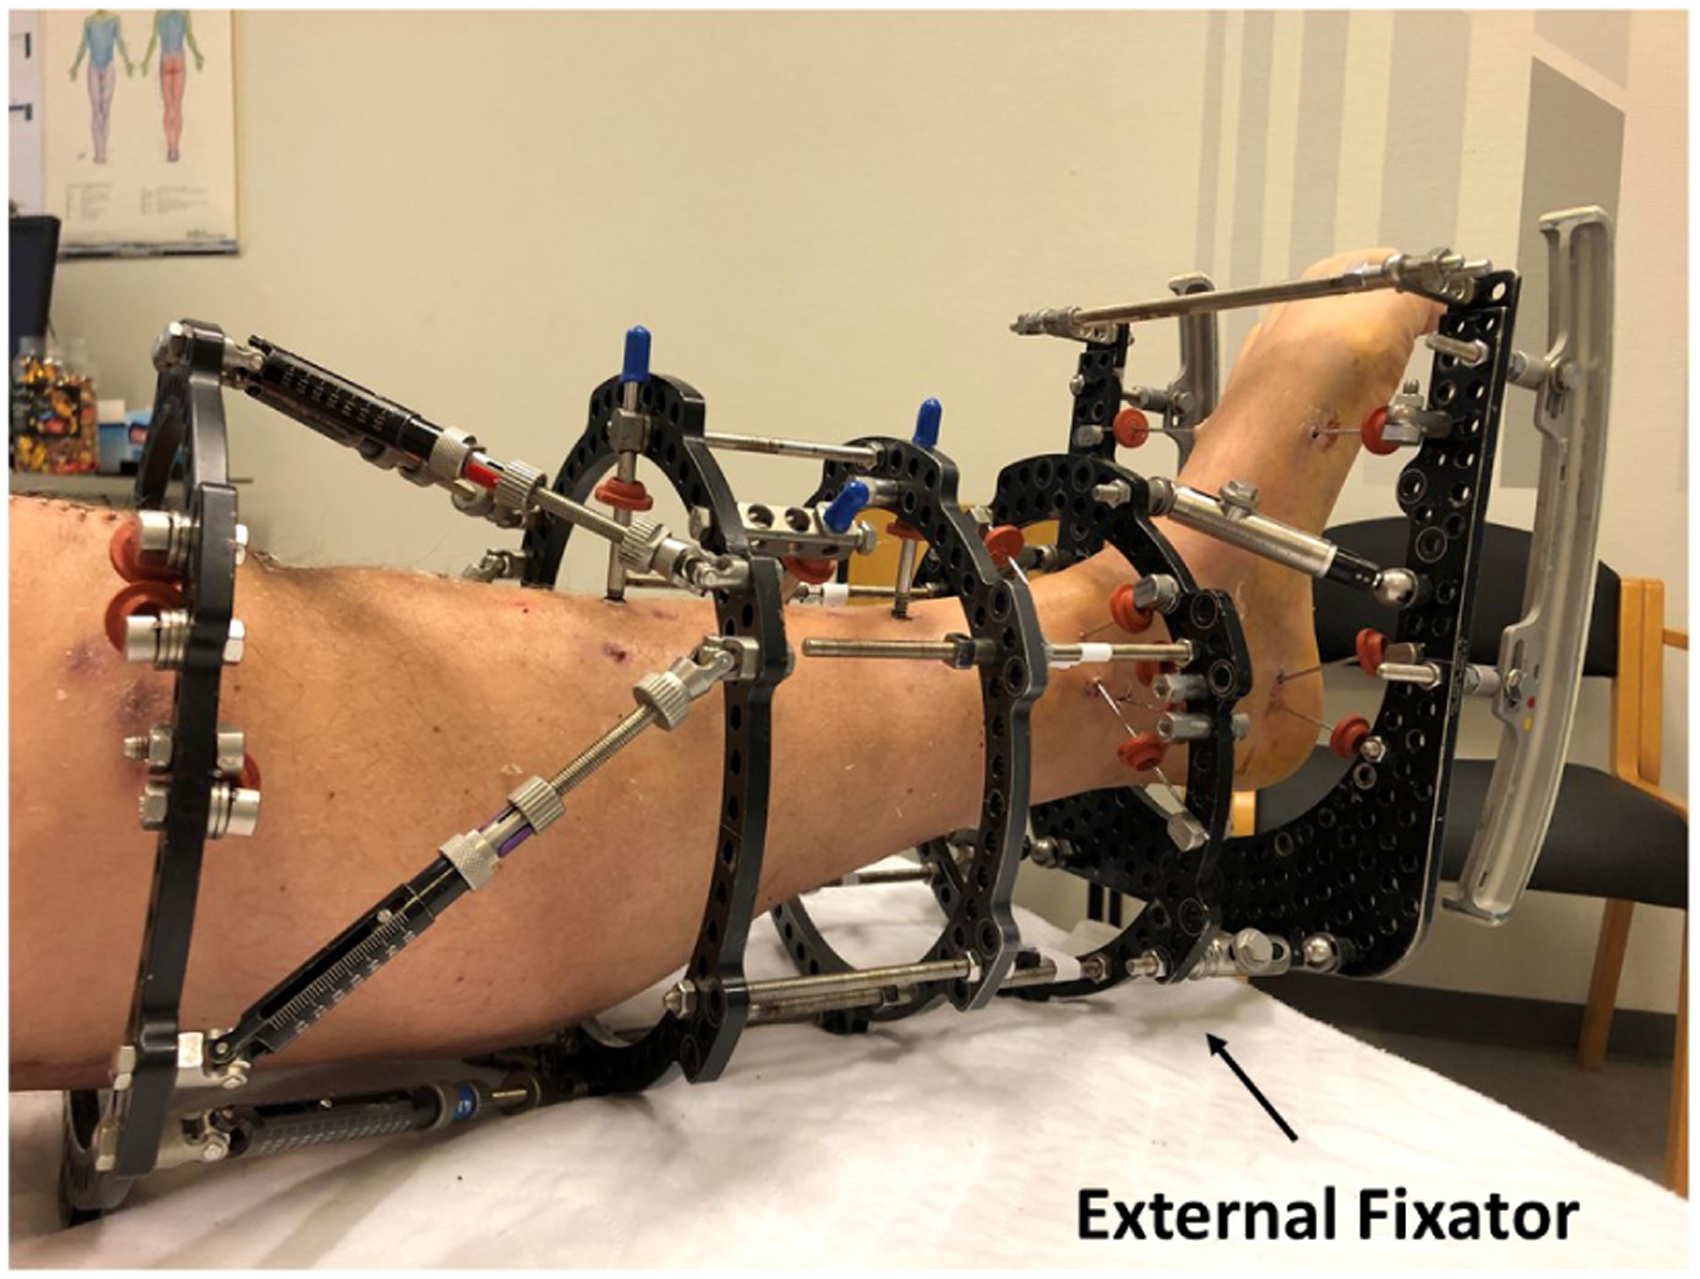
A patient with an external fixator (EF) after a lower limb bone fracture.

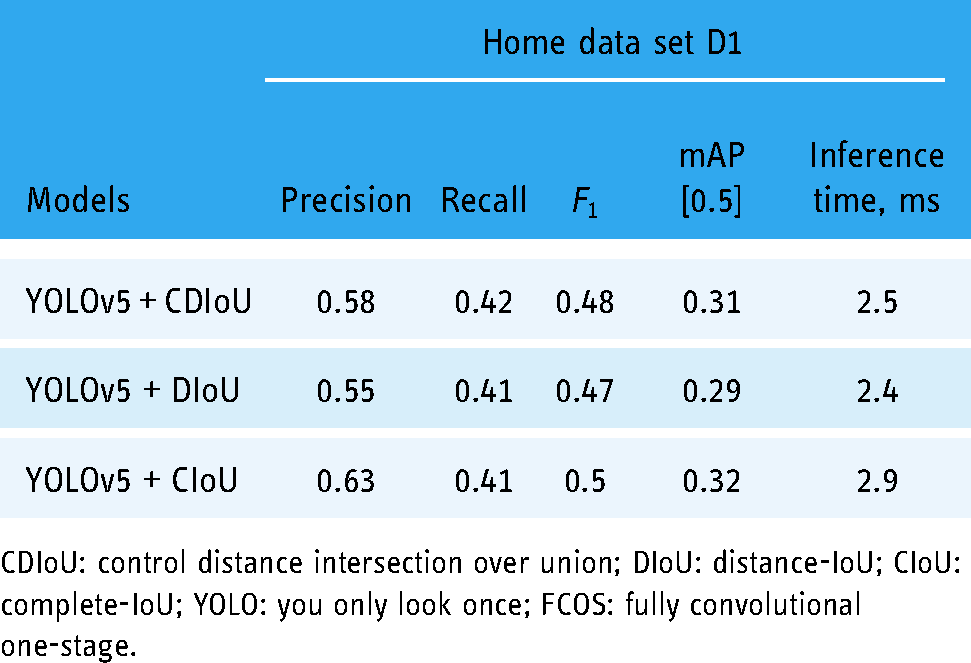
RGB visible images and infrared thermal images after external fixation. (a) RGB visual images, (b) images with bounding boxes annotating pin sites, as references for training, (c) thermal images.
It has been suggested that thermography is reliable in detecting signs of infection at pin sites. 2 The technology of those thermographic cameras is quickly evolving these days, and it is becoming possible to take good-quality infrared thermal images with a low-cost hand-held camera. 3 These new infrared cameras even now come as an add-on to a mobile phone device, giving the possibility to monitor the infection signs remotely, by the patients from the patients’ home setting and having the on-demand evaluation. Furthermore, analyzing the thermography by machine learning methods has shown powerful potential in the evaluation of health 4 and diagnosis of diseases including breast cancer 5 and Raynaud’s phenomenon, 6 but the training of model requires lots of data. To prepare the infection detection technology through temperature analysis, there is a need to annotate the essential pin site region on infrared thermal images. However, interfaces between skin and pins are not clearly visible to distinguish and mark based on their shapes and colours in most of the thermal images, for example, Figure 2 (c) while in RGB visible images like Figure 2 (b), they can be easily annotated in bounding boxes. For thermal images, pin sites that should have been monitored can be missed. To achieve higher accuracy of infection detection on thermography as well as the efficient collection of essential data, the idea is to first use the original visible images of RGB colours to detect the pin sites and transfer the selected regions to the corresponding infrared thermographic images. Considering a large amount of data of images, this repetitive task can take clinical manpower to complete and an automated and accurate annotation tool can effectively accelerate the detection with consistency.
In this paper, we propose a pin site detection model that automates the process of identifying and annotating regions of interest with bounding boxes on the corresponding RGB visible images and transfers the detected boxes to the targeted infrared thermal images. Therefore, this work contributes to preparing further research and potential applications in pin site infection detection using digital thermography for home-based care of patients after lower limb external fixation.
Literature review
Object detection
The implementation of an automatic pin site detection framework relies on object detection algorithms that can search and mark bounding boxes of the informative location from the given images. As a popular and important topic in computer vision, object detection has been widely studied and applied in many fields including face recognition, 7 auto-driving 8 and medical image analysis. 9 Some traditional algorithms follow the exhaustive method with many sliding windows 10 to find useful regions from the image. But they consume considerable computational resources with poor accuracy and speed, and there is a doubt about their robustness to the diversity of images. 11 Furthermore, those works that utilize rule-based algorithms for desired area extraction like statistical pattern recognition algorithm 12 require rules or features defined manually. 13 In the past decade, convolution neural networks (CNNs) have been introduced for object detection with possible superior performance in both accuracy and computation time, which greatly enhances the development of medical image assessment. 11
One-stage and two-stage object detectors
These CNN-based frameworks can be mainly divided into two groups, one-stage, and two-stage object detector. The former type, such as you only look once (YOLO), 14 only contains one step of regression and classification that takes input images to learn the coordinates of bounding boxes and probabilities of classes. While the latter group, like R-CNN (regions with CNN features), 15 fast R-CNN 16 and faster R-CNN, 17 achieves object detection by two steps, acquiring regions of interests in the first stage and then in the second stage making the decision from the selected regions. Compared to two-step frameworks that require separated stages to generate results, one-step methods require less consuming time and produce relatively lower but still acceptable accuracy. 18 In the state of the art one-stage object detectors like YOLOv4 19 and YOLOv5, 20 the accuracy is also improved with fast processing speed. Aiming to develop a lightweight application that can be deployed in mobile phones for patients, implemented by Pytorch, the one-stage framework YOLOv5 providing both processing speed and accuracy is chosen in this work.
Intersection over union in object detection
The evaluation of loss is significant to the bounding box regression in YOLO frameworks. To represent the similarity of the predicted box and ground-true box, the traditional intersection over union (IoU), as well as IoU loss function, is only determined by the overlapping area, which means different relative positions could result in the same IoU and degrades regression accuracy. Therefore, advanced methods have been suggested to comprehensively analyse the difference from various dimensions. For example, generalized IoU (GIoU) 21 introduces a penalty term for non-overlapping cases. Distance-IoU (DIoU) and complete IoU (CIoU) 22 take more aspects into account such as central distance and aspect ratio, but DIoU loss encounters difficulties when the center points of predicted boxes coincide while CIoU requires a relatively longer calculation time. In addition, one of the latest evaluation systems, control distance IoU (CDIoU), 23 can directly indicate the degree of difference between the predicted region and ground-true box and shows better performance with reduced complexity. Considering having an optimized selection for the pin site data set, in this work, we incorporate DIoU, CIoU, and CDIoU methods into YOLOv4 and YOLOv5 and observe their performance.
Transfer learning
Generally, collecting sufficient medical image data is expensive and challenging, requiring professional equipment and experienced clinical staff, and therefore transfer learning approaches are widely utilized to construct medical imaging analysis models. There are lots of strategies for transfer learning, including instance weighting, feature transformation, model control, and parameter control. 24 Parameter control approaches are commonly utilized for deep learning-based models by sharing the network parameters of the source domain and target domain. An initial neural network can be trained by a large data set of the source domain and then finetuned only using a small set of data from the target domain to adapt. In this process, parameter sharing is achieved by freezing some layers of the pre-trained network on the source domain and training the last layers by instances from the target domain like deep adaptation networks (DAN), 25 or initializing the network parameters from the pre-trained network without freezing. These approaches have been applied in medical image diagnosis, including Alzheimer’s disease 26 and knee osteoarthritis 27 and show good classification accuracy.
In our work, the photos taken by doctors in the hospital scenarios and by patients at home scenarios differ a lot in aspects including definition, pin site distance, and brightness, and hence the model trained by the large data set from the hospital has poor performance in the applications for patients at home. In addition, it is not possible to obtain sufficient patients’ data due to the lack of infrared cameras available at their homes and logistic problem. As a result, we employ transfer learning to finetune the pre-trained model on the hospital data set so that the final model has better accuracy for patients at home.
Camera calibration and registration
The metal pins are not always clearly visible on thermal images, and therefore the region of interest on the skin, the pin site, is detected on the RGB visible images and then transferred to the corresponding thermal images for temperature extraction. However, the spatial difference due to the physical location causes a shifting error in the transferred bounding boxes. Therefore, calibration of the camera and registration of the images are mandatory before analyzing the annotated regions. The coordinate systems of cameras not at the same spatial position are different. So, the purpose of calibration is to derive a matrix for converting coordinates from one system to another, based on which the images can be registered and aligned without any error in position and size.
With the rapid development in computer vision with the use of multiple cameras, lots of calibration and co-registration methods have been proposed. It is common and convenient to utilize a checkerboard or chessboard as the reference for calibration. By taking images of the checkerboard at a few orientations and annotating feature points, the parameters of the conversion matrix can be calculated.28,29 Functions provided by OpenCV can help to automate the process of locating points and estimating the parameters. 30
Methods
Data set
Visible and thermal image data set construction
In this work, the data sets contain RGB visible images and infrared thermography of external fixation from patients who are undergoing treatments for bone fracture. Table 1 introduces and classifies the data sets with different objectives and properties including size, collected method, scenario and image resolution. Besides, the specifications of digital cameras used for this work to capture images and construct the data set are presented in Table 2. To train the model for the pin site detection on visible images, data set P1 is collected using FLIR C3 cameras by professional clinical nursing staff the Aalborg University Hospital. Some samples of images in P1 are illustrated in Figure 3. After data augmentation, data set P1 is divided into a training group, a validation group, and a test group in the ratio of 8:1:1. In addition, data sets D1 and D2 are captured by patients themselves at home using FLIR C3 camera. With D1 data set, we have examined the performance of the detection model at home scenario as a practical application case, which was unsatisfactory due to scenario differences including uncontrolled illumination conditions, various angles and distances. As a result, the same data set, D1 is used to finetune the initial pin site model through transfer learning. To further validate the performance for harsh cases, this new transfer learned model is tested by another data set D2, which is also collected from home setting by patients and without any guidance from the research nurse and contains some images taken at a shorter distance. The pin site detection model training data sets are mainly collected from patients who have light skin tones from type 1 to type 2 based on the Fitzpatrick scale, and only the P1 data set contains 147 images of type 6 dark skin tone. Some of the patients have a certain stage of inflammation and infectious sign on their skin. Furthermore, most types of external frame constructions are included, containing various shapes taken from multiple orientations, as well as different numbers of thick and thin pins.

Hospital image data set of external fixation taken by FLIR C3 cameras, the second row contains manually annotated pin site boxes.

Images in the home data set: (a) D1 data set and (b) D2 data set.

(a) Visual and thermal images taken by FLIR One Pro in T1 data set. (b) Visual and thermal images taken by FLIR T540 in T2 data set.
Data sets collected and used in this work.

Specifications of cameras used for data set construction.

MSX: Multi-spectral dynamic imaging
Two sets of data (T1 and T2 in Table 1) including both RGB visible images and their respective infrared thermal images are acquired to validate the desired operation of the model. The effectiveness of the object detection model trained by the images taken by the FLIR C3 camera as well as temperature analysis is validated by these two data sets.
Data annotation
To construct a pin site detection model for infection assessment, the ground-true box plays an important role as the region of interest for training. In our work, pins along with the skin interfaces on the images are annotated within bounding boxes as pin sites, which is completed manually through visual object tagging tool to guarantee precision. Some examples of annotated ground-true pin sites are illustrated in Figures 2 (b) and 3, which are marked with blue boxes representing regions of interest. It should be noted only the clear and visible pins are annotated in bounding boxes, while those pins that are hard to distinguish due to obstacles or poor angles and distances are ignored as outliers. In addition, visible wounds are also included in the bounding boxes, allowing the measurement of clinical parameters for infection monitoring. Therefore, the center of the bounding box is defined by the interfacing point of the pin and skin as the pin site.
Data augmentation
There are three reasons for us to apply augmentation to our image data, which are listed below:
The size of the original base data set is too small with 1042 images, which is not sufficient to train a reliable pin site detection model with the desired accuracy. The collected data set is impossible to cover photos of all scenarios in real-world applications while the model needs to be trained with enough situations to achieve generalization. Therefore, it is essential to transform the original images into diverse conditions. Augmenting the image data is adapted to address overfitting based on our experience.
Therefore, the data set from the hospital is scaled up and enriched with a wide range of scenarios for model training. In our work, the data augmentation is implemented by 8 techniques: horizontal flip, vertical flip, motion blur with the Gaussian kernel equal to 15, alpha blend with the overlay factor from 0 to 1, linear contrast adjustment via scales between 0.4 and 1.6, gamma contrast adjustment in the range 0 to 2, rotation between

Augmentation techniques applied to the images, including flipping, motion blur, alpha blending, linear contrast, gamma contrast rotation, zooming in and shearing.
Thermography pin site detection model architecture
The objective of the pin site detection is to find and mark the regions of interest around the pin sites on the thermal images of external fixation, which prepares as a tool for future infection assessment. The processing flowchart of the complete model is illustrated in Figure 7, including data set construction, pin site detection model pre-training with the main hospital data set, finetuning through transfer learning with the home data set D1, testing on visible images in the home data set D2, camera calibration, image registration, bounding boxes transfer, and maximum temperature extraction. As shown in the flowchart, RGB visible cameras and infrared thermal cameras are calibrated, and thus thermal and visible images in the data set collected by those cameras are registered to remove the position and scale differences. Then, bounding boxes of pin sites are generated by the YOLOv5-based object detection model with CDIoU and transfer learning on visible images of external fixation. Because thermal images and visible images are well aligned after registration, those detected bounding boxes can be directly moved onto the respective thermal images. Based on each region of interest marked by the bounding box on temperature arrays of thermal images, we can obtain a set of maximum temperatures of their corresponding pin sites, which could be followed by future infection assessment research. For example, currently suggested by doctors, a threshold can be set for these maximum temperature values, above which a potential infection of the pin site is considered.

The flowchart of the construction of the pin site detection model.
Pin site detection model on visible images
In our proposed model, the pin sites are detected from the corresponding visible images and marked with bounding boxes. After that, these bounding boxes are projected onto the respective infrared thermal images. To achieve it on visible images as the first step, we propose the pin site detection model based on the anchor-based object detection framework YOLOv5. Instead of using GIoU as its loss function in the basic YOLOv5 model, we have investigated other novel loss assessment methods such as CDIoU, CIoU and DIoU, and propose that CDIoU could provide excellent results in our targeted pin site data set. Furthermore, fully convolutional one-stage (FCOS) 31 object detection framework also has been explored to achieve an anchor-free structure for potential optimization. However, its results are not as expected, which are attached in the ‘Results and Discussion section for comparison. In addition, considering the challenges of applying the model to low-quality images and the lack of data from patients’ homes, transfer learning techniques are introduced to adapt the model. The initial proposed model is pre-trained over a large data set from our hospital with data augmentation. Then, the transfer learning approach is employed to finetune the model with another small data set collected from home scenarios by patients, so that the final model can suit practical applications for patients at home.
YOLOv5
The novel object detection model with the one-stage and anchor-based framework, YOLOv5, is utilized for detecting pin sites in this work. As shown in Figure 8, YOLOv5 consists of three essential components, backbone, neck, and head. 20 The first component, backbone, is a CNN used for features extraction and implemented by the cross stage partial network bottleneck with a focus layer. In the neck section, a path aggregation network (PANet) and a spatial pyramid pooling structure are applied to generate feature pyramids with improved information flow. As the final detection stage, the head leverages the features and anchor boxes to generate predicted outputs with scores for regression. In our cases, the classification of objects is not necessary as only the pins are required to detect.

The architecture of the YOLOv5 object detection model.
As for activation functions, the middle and hidden layers employ the leaky rectified linear unit function while the final detection layer utilizes the sigmoid function. Besides, as the default optimization function, stochastic gradient descent (SGD) is used for training.
Loss functions
In the ‘Detection section, the calculation of loss function is only based on the bounding box loss for regression. To represent the relative position relationship between the predicted boxes and ground-true boxes, IoU-based loss evaluation methods are popular and powerful. While different methods result in different results, the selection of a suitable approach for the target data set is important. For detecting pins in our work, CDIoU is proposed and incorporated into the YOLOv5 model. Considering the targeted pin site data set, the region of interest for doctors is the wound around a pin and hence the center of the bounding box is set at the position where the pin inserts into the skin. As the center is also a key feature in our image data set, we believe that for fast loss convergence, it is important to reduce the central point distance between the predicted bounding box and ground-true box without an increase in the inference time. Therefore, DIoU and CIoU featured by minimizing central distance directly are first considered, within which CIoU also takes the aspect ratio into account but consumes more time for calculation. 22
Furthermore, the latest method CDIoU evaluates both the central distance and shape similarity in the loss function through a minimum bounding rectangle of the predicted box and ground-true box. It is possible to reduce the center distance while considering the aspect ratio but without the performance degradation in the calculation time. 23
In conclusion, the loss analysis methods performed in this work include CIoU, DIoU, and CDIoU, and their detailed loss functions are described below. Assuming 


Besides, with less calculation than CIoU, as vectors 

Calculation of control distance intersection over union (CDIoU) loss function. Rectangle
Transfer learning
The experience has been, that when the pin site detection model is trained on the images collected by a research team at the hospital, it obtains an excellent accuracy in the testing set. However, when this trained model is applied to images taken by the patients at their home setting (data set D1), we observe a considerable reduction in detection accuracy. It can be explained by the fact that the clinic nurses who take those images possess professional skills that those at-home patients do not have and that the characteristics of images vary greatly from patient to patient, including lighting conditions, appropriate distance to retain focus and optimal angles to make the pin sites most visible. Furthermore, home environments may not allow patients to take good images of the EF with pins. As the preliminary pin site detection model was trained from a data set where hospital images are the majority, its actual performance for real patients at home is heavily suffered by the image quality problems from home scenarios. Specifically, the doctors would take the images of the external fixation from a remote distance to capture a full view of the pins, whereas most patients’ images are taken at a relatively short distance. Meanwhile, it is not efficient to collect a large number of images from patients at home so that we can acquire a data set as large as the one from the hospital to retrain a model, limited by the imaging devices for patients due to logistic reasons.
As a result, to raise the detection accuracy on images taken by patients in practical applications, transfer learning is adopted in our work to deal with the low-quality images while the training data set is undersized. Firstly, the images from two environments are sorted into two groups accordingly. The main data set consists of a significantly larger number of images taken in the hospital by nurses as compared to the small-size data set D1 collected by patients in home environments. Then, the transfer learning steps via the data set D1 as demonstrated in Figure 7 are brought as a part of the overall model training procedure. The initial pin site detection model is pre-trained by the main hospital data set through the object detection framework as described in the previous section and then adjusted by the transfer learning techniques on the D1 data set. Transfer learning in our work is implemented by leveraging the pre-trained model as the initial setting and finetuning it with data set D1 as illustrated in Figure 10. We explore the performance of three approaches in Figure 10 to finetune the parameters of the pre-trained model during training the transfer learning model, including freezing 9 layers of the backbone (backbone freezing), freezing 23 layers of the backbone and neck (full freezing), and not freezing any layers (no freezing). The results of these three strategies could be compared and we propose no layer freezing method resulting in the best performance. Finally, the transfer learned pin site detection model is tested by data set D2, which is another set of low-quality images taken by patients, and its ability to detect challenging pin sites for real-world applications can be examined.

The processes of implementing transfer learning techniques.
Thermal camera calibration and image registration
Sections mentioned previously present our YOLOv5 with CDIoU pin site detection model and transfer learning algorithm on visible images. As infrared and visible images are captured by two separated cameras from the same device, which indicates different spatial locations, they use two coordinate systems that lead to shifts between the projection of objects onto the thermal images and visible images. The purpose of calibration is to derive the calibration matrix between the thermal camera and visible camera coordinate systems, based on which the thermal and visible images can be registered and aligned without any position and size differences. After the displacement errors between two types of images are eliminated, the bounding boxes of pin sites generated by the detection model can be simply transferred to the thermal images without shifts. Therefore, each camera containing an image sensor and a thermal sensor needs to be calibrated individually. In this work, both the registered visible images and the converted temperature values from the thermal sensor output are simply extracted from the FLIR Image Extractor tool https://github.com/nationaldronesau/FlirImageExtractor. This program for FLIR cameras provides functions for aligning thermal and visible images and for extracting the temperature values corresponding to visible pixels.
However, to further reduce the displacement error, we suggest two suitable calibration methods for thermographic images from the literature.
Geometric calibration of cameras has been extensively investigated in previous studies, for studies including computer vision. Zhang’s calibration method
28
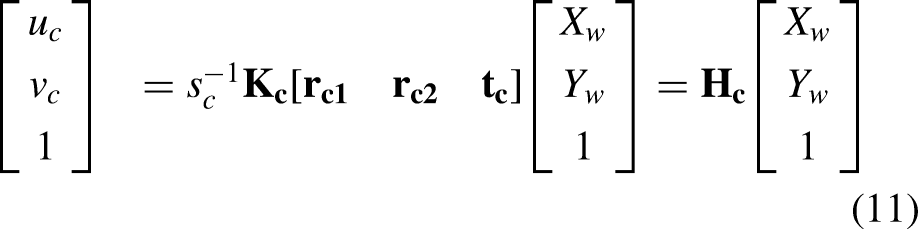
through a checkerboard is convenient and has been widely adopted. A three-dimensional (3D) point in the real world coordinate system can be denoted as 


However, the conventional method must rely on a checkerboard and its cross dots as the image and world points, which cannot be detected by thermal cameras and thus is not applicable directly. To address this problem, the calibration of thermal images includes a step to design patterns with clear feature points that can be recognized by infrared cameras before applying conventional calibration algorithms. As Method 1 shown in Figure 11, it leverages a foam metal plate
32
made of cold and black metal aluminum disks inserted into a pink foam board at the ambient temperature. Thus, it consists of round dots that vary in temperature from that of the plate as thermographic patterns, and hence both the RGB visible camera and the infrared thermal camera can capture the recognizable features of the board. As a result, it is now possible to apply the conventional calibration technique introduced above
28
to extract the homography matrices
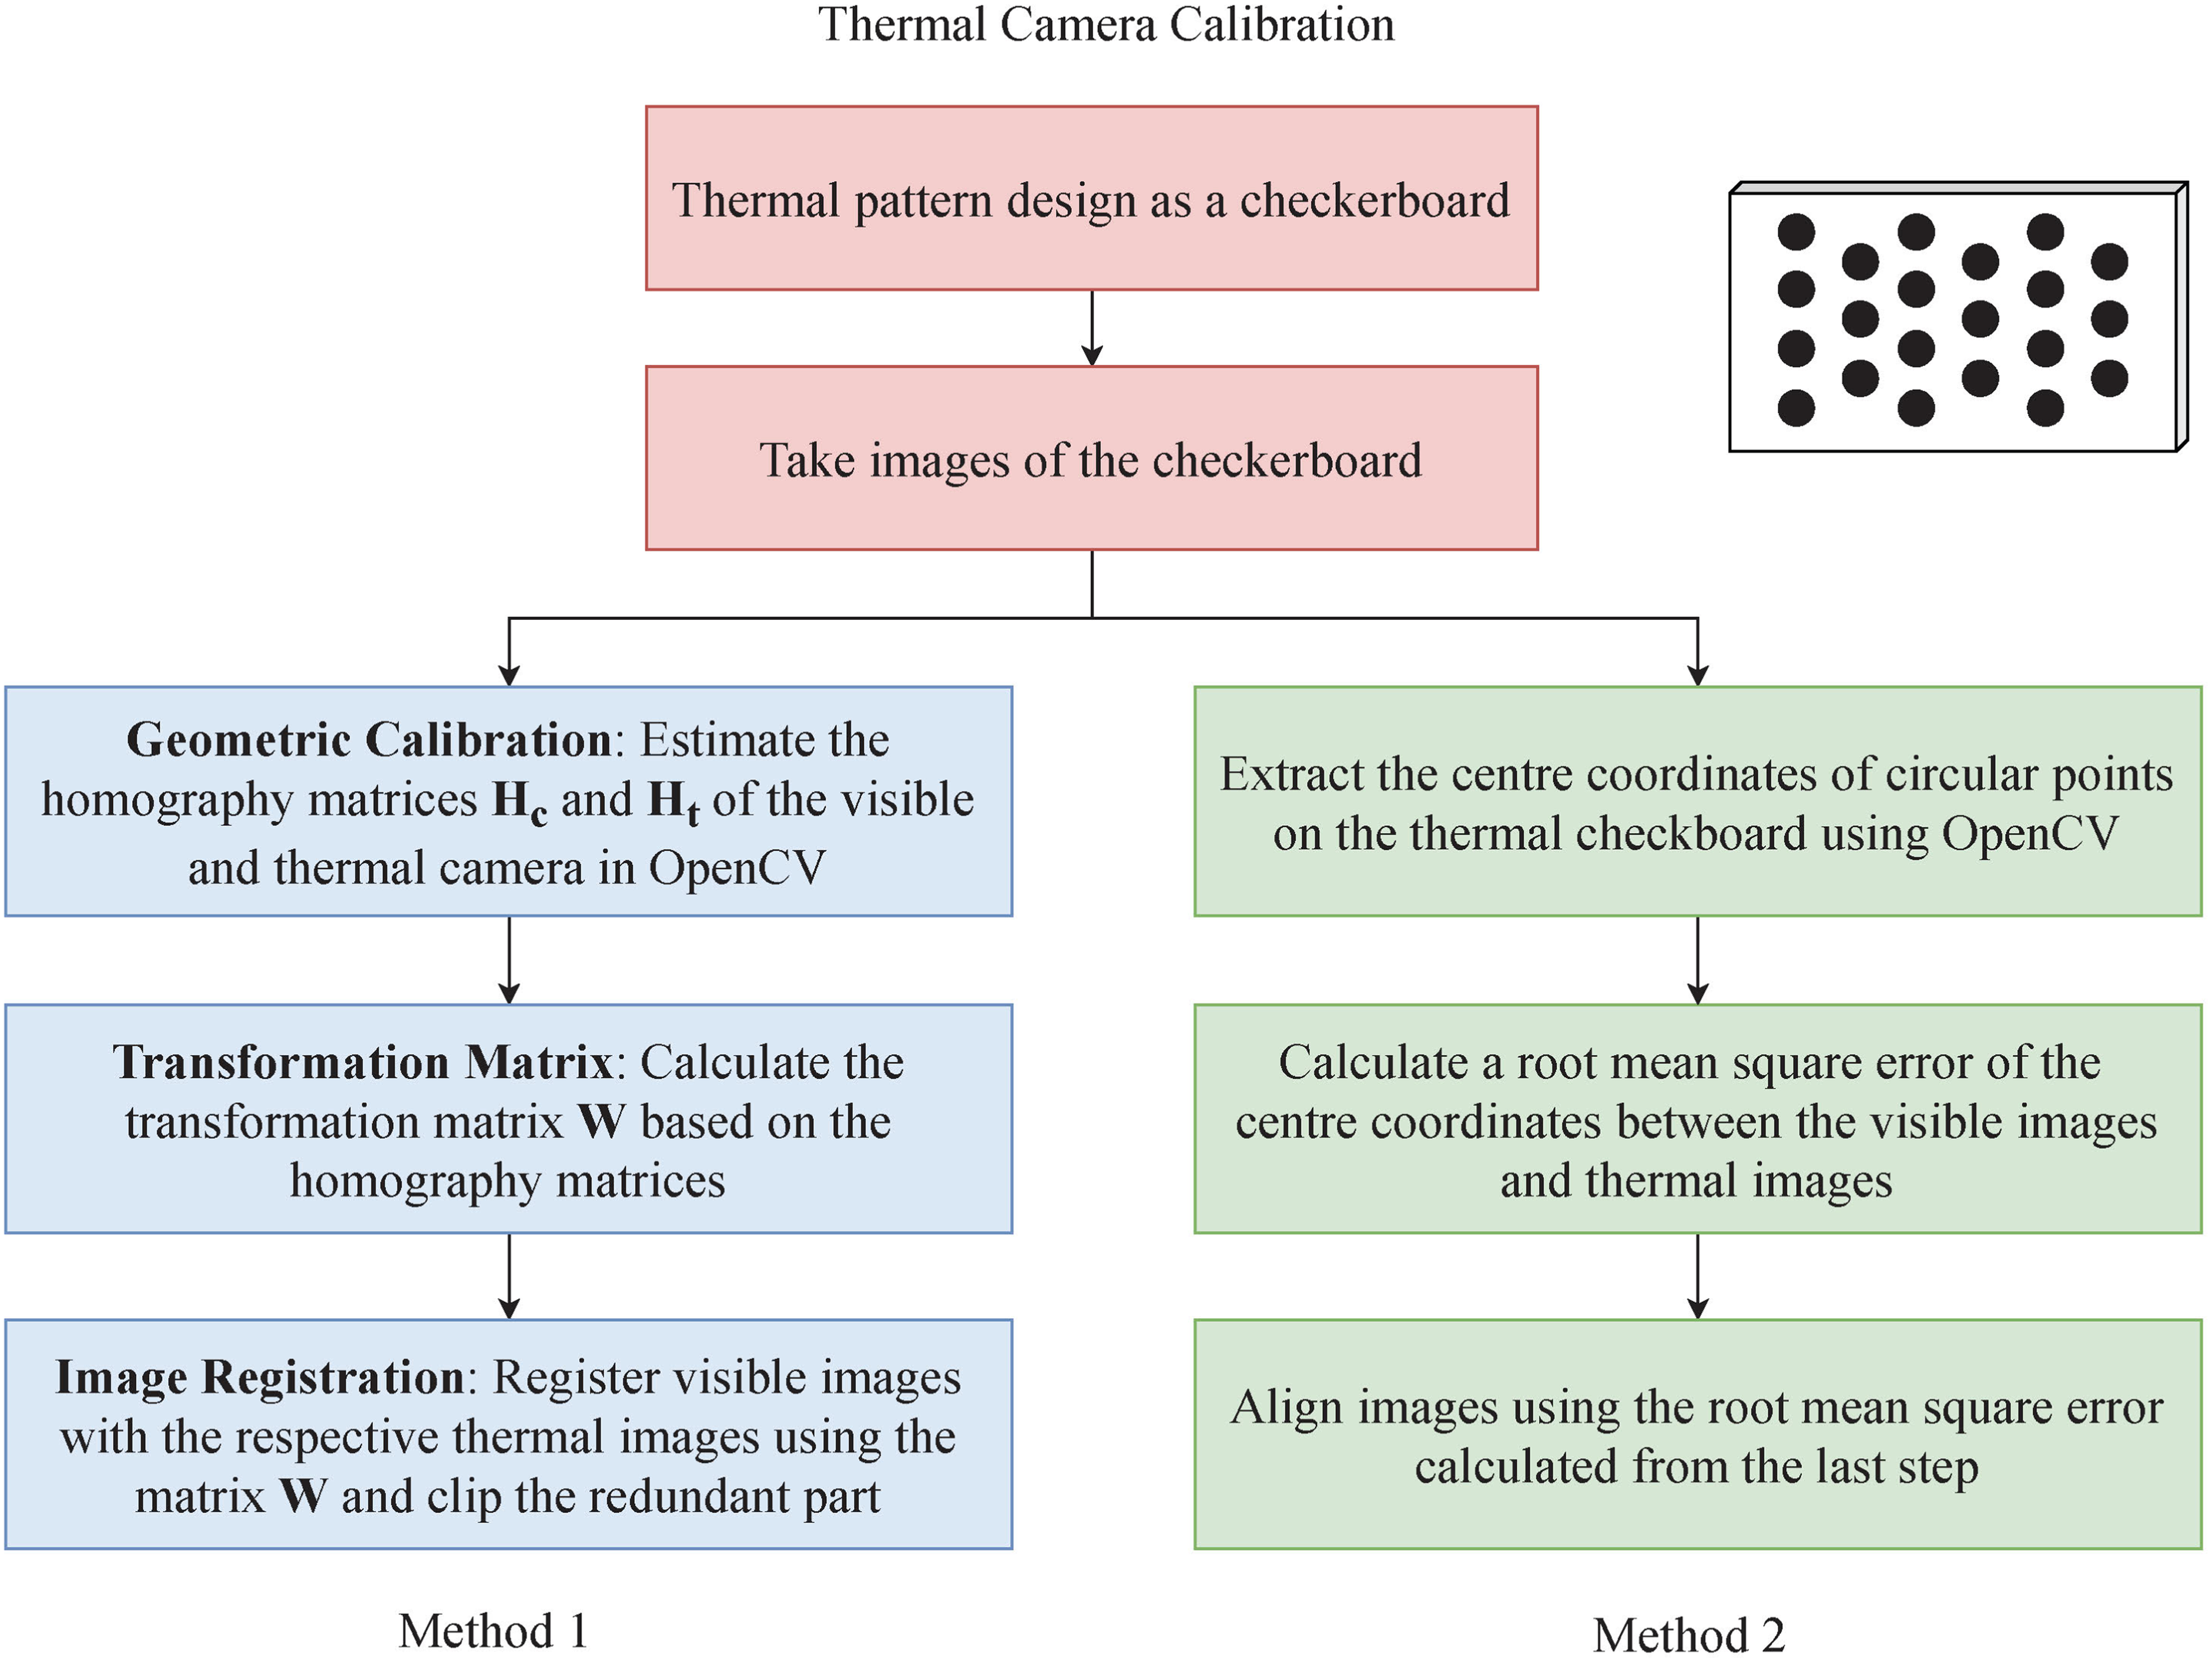
Two suggested methods for thermal camera calibration.
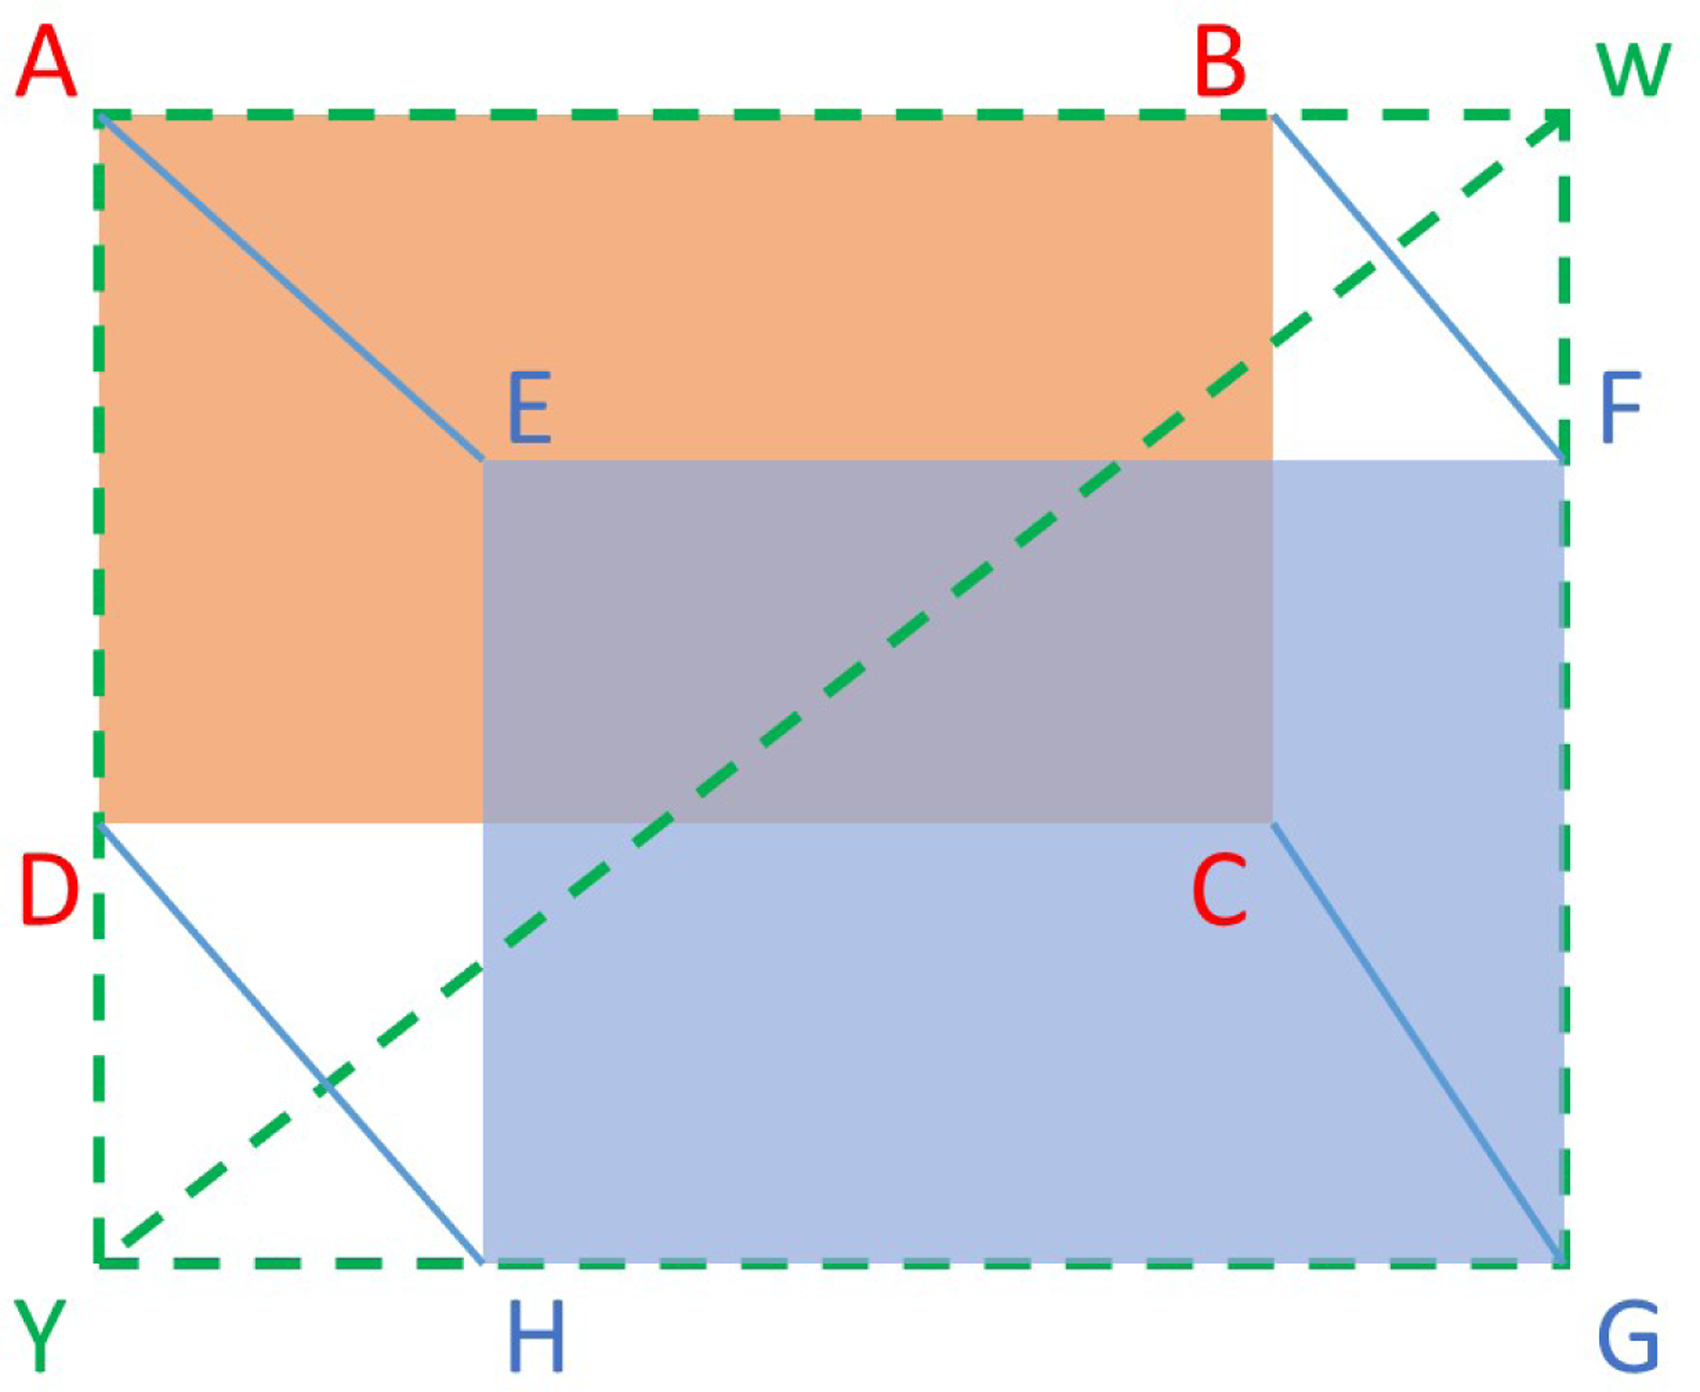
An alternative 33 simplifies the calculation of the transformation matrix for calibration and also requires a foam metal board as a checkerboard. Illustrated in Figure 11 as Method 2, pixels are translated by calculating a root mean square error (RMSE) of the centroids of the metal aluminum disks between the RGB visible image and infrared thermal images. It is feasible as the thermal and visible cameras are on the same plane and vertical line as the FLIR cameras we used in this work.
Maximum temperature extraction
The maximum temperature around each pin site region might be significant for the infection assessment according to our pilot research. As a result, the last step of the model is to automate the process of extracting the maximum temperature from the detected bounding box, which is shown in Figure 12. The pixel-level temperature values are directly readable from the FLIR images, as these follow the exchangeable image file format standard. After the bounding boxes are transferred to the calibrated thermal images, their coordinates can directly be obtained. As pin site regions on the temperature array are determined by the coordinates, the maximum temperature of each pin site can be calculated accordingly. As presented in Figure 12, the maximum temperature within the detected bounding box of the pin site is extracted based on the coordinates of 4 corners and relevant information in the temperature array of the thermography.

Maximum temperature extraction.
Model configuration and evaluation methods
The pin site detection model training is set as the YOLOv5-small configuration and carried out according to the processes shown in Figure 7. As the default anchor box setting for the COCO data set is used for the pin site data set as the best possible recall value for pin site annotations reaches 99% of the COCO data set. SGD optimizer is set with momentum 0.937 and weight decay 0.0005. The initial learning rate
To evaluate the performance of the model for pin site detection, the basic statistics are observed on the test data set like true positive (TP), false positive (FP), false negative (FN), representing true detections, missed detections and false detections, separately. In addition, inference time for the analysis of detection speed and advanced metrics including precision (P), recall (R), 


Results and discussion
Basic model performance
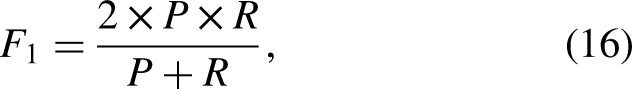
To evaluate the basic performance in an ideal setting (hospital environment), we compare the proposed pin site detection model (YOLOv5 with CDIoU) with other conventional models such as FCOS and YOLOv4, which are trained and tested with the hospital data set. Their performance metrics are shown and compared in Table 3.
Performance metrics of YOLOv5 and YOLOv4 pin site detection models with CDIoU, DIoU, CIoU or YOLOv5 + FCOS on the hospital data set.
mAP: mean average precision; CDIoU: control distance intersection over union; DIoU: distance-IoU; CIoU: complete-IoU; YOLO: you only look once; FCOS: fully convolutional one-stage.
YOLOv4 vs YOLOv5
It can be found that YOLOv5 object detectors lead to much faster operation and higher detection precision than the models based on YOLOv4. The detected boxes of pin sites generated by YOLOv5 models with CDIoU, DIoU and CIoU have a high precision from 0.97 to 0.98, outperforming the anchor-free FCOS model and YOLOv4 models by around 0.05. Similarly, mAP and
Besides, we have examined the anchor-free model using the YOLOv5 structure incorporated with FCOS. However, it performs worse than the traditional anchor-based frameworks YOLOv5 with CDIoU with obvious reduction in the recall rate and
Loss functions
The proposed combination of object detection framework and loss function, YOLOv5 with CDIoU, contributes to the leading metrics in the tests. More TP bounding boxes can be detected with the CDIoU loss, achieving an outstanding precision of 0.976 and nearly 0.1 higher recall rate than DIoU and CIoU. It is because the CDIoU loss can represent the difference in central distance and aspect ratio more comprehensively. Furthermore, in the NMS process, two or more predicted bounding boxes generated by DIoU and CIoU models with similar center points could have the same high IoU values in an image, which causes random selection of proposals and hence a decline in the recall rate. However, the model using CDIoU would result in different IoU values for NMS due to another loss calculation method considering both the centroid and aspect ratio. As a result, some proposals randomly discarded with DIoU and CIoU methods would be picked by using the CDIoU approach instead, so the recall rate is benefited. Such an improvement does not come at the cost of computational time, as the model using CDIoU stays a similar inference time to models with DIoU and CIoU at around 1.8 ms.
Improvements through transfer learning
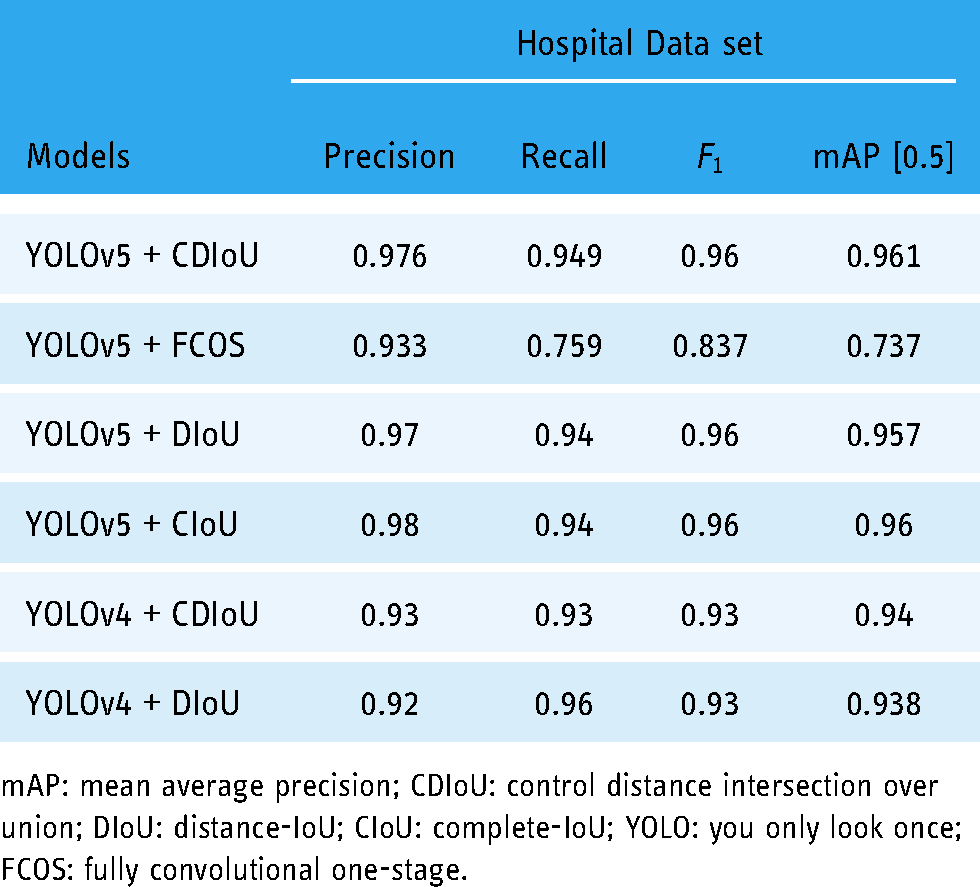
With the satisfactory results in the test, the models based on the YOLOv5 framework (without transfer learning) are applied to more images from different scenarios in the D1 data set to verify their performance. However, as presented in Table 4, the models with good metrics in the previous test obtain relatively poor detection precision in applications for patients. The mAP drops to around 0.3 with an AP of 0.58, using YOLOv5 models for patients. It could be deduced that patients lacking specialized skills lower the quality of images, which creates a challenge for the models trained by the high-quality images.
Performance metrics of YOLOv5 pin site detection models with CDIoU, DIoU or CIoU trained by the hospital data set and tested by the data set D1 from patients at home.
CDIoU: control distance intersection over union; DIoU: distance-IoU; CIoU: complete-IoU; YOLO: you only look once; FCOS: fully convolutional one-stage.
To address this issue, we take advantage of transfer learning to improve the pin site detection accuracy for the home data set without the need for a large amount of training data. A transfer learning technique based on parameter sharing is employed, trained, and tested using the D1 data set. We have an experiment on three strategies of defining sharing parameters for our targeted data set, including freezing backbone, freezing neck and backbone, and freezing nothing. Obviously, the no-freezing method is chosen for its fastest convergence rate based on the loss curve and highest mAP value with the same number of epochs. Finally, the finetuned model using YOLOv5 and CDIoU and freezing no layers in transfer learning achieves an mAP of 0.67 with high precision as shown in Table 5, which is greatly improved compared to the results before introducing transfer learning in Table 4.
Performance comparison of the YOLOv5 and CDIoU pin site detection model incorporated with TL methods using the home data set D1.

mAP: mean average precision; CDIoU: control distance intersection over union; TL: transfer learning; YOLO: you only look once.
In addition, the models based on YOLOv5 after transfer learning are further evaluated by another Data set D2, which contains low-quality images intentionally collected from patients at home. The metrics of their performance are concluded in Table 6 and compared to the models with the same object detection architectures but without transfer learning. There are considerable improvements in precision and recall rate by 0.1–0.11 and 0.13–0.14, separately, through implementing the transfer learning technique. And generally, the introduction of transfer learning increases the mAp scores by at least 0.17. The CDIoU loss incorporated with transfer learning still brings supreme performance, including detection accuracy and speed rather than DIoU and CIoU. It earns 0.01 higher recall rate and 0.008 better mAp score than other models while the inference time is 0.1 ms faster. However, the final pin site detection precision of 0.7 and recall rate at 0.58 in a new data set D2 is not as good as the performance with the test data set. To gain the generalization ability over a wide range of data collected in various environments, further development as well as a better design of model structure and parameters is necessary. The detected pin site results with red bounding boxes on images in the hospital data set and home data set are visualized in Figure 13 and Figure 14, respectively, which demonstrate the detection capability of the proposed YOLOv5 model with CDIoU and finetuned by transfer learning.

Pin site detection results in bounding boxes with confidence scores, generated by the proposed model using YOLOv5 with CDIoU on the hospital data set. YOLO: you only look once; CDIoU: control distance intersection over union.

Pin site detection results in bounding boxes with confidence scores, generated by the model pre-trained using YOLOv5 with CDIoU and finetuned by transfer learning on the home data set. YOLO: you only look once; CDIoU: control distance intersection over union.
Performance metrics of YOLOv5 pin site detection models with and without TL using the data set D1 and tested on the home data set D2 from patients.

mAP: mean average precision; CDIoU: control distance intersection over union; TL: transfer learning; YOLO: you only look once.
Results visualization
Pin site detection in thermography
Figure 15 illustrates the results of detected pin sites on thermography. The proposed pin site detection model based on YOLOv5 is firstly applied to the visible images in Figure 15(a). Then, the generated bounding boxes are transferred to the corresponding thermal images and illustrated as pin sites in Figure 15(b), thanks to the calibration of visible and thermal cameras and registration of images in advance. Although it is not possible to directly apply object detection models to thermal images where pins of EFs are not clearly visible, our proposed method leverages object detection model on visible images and camera calibration methods to find out pin sites and project detected bounding boxes onto the thermal images. Primarily detecting pin sites on visible images could have higher accuracy and calibration minimizes the displacement errors between cameras to transfer bounding boxes, contributing to the precise annotation of pin sites on thermal images.
Applications of the pin site detection model on the thermal images: (a) original visible images, (b) infrared thermal images with pin site bounding boxes generated by the proposed model on the original visible images.
Maximum temperature extraction
Based on the regions of interest for all pin sites generated by the model, the maximum temperature can be easily measured for infection evaluation. Figures 16 and 17 show maximum temperature values for some pin sites in data sets T1 and T2, respectively. These results are obtained by applying the proposed pin site detection model to visual images and extracting from the aligned bounding boxes on their corresponding thermal images. Not limited to extracting maximum temperatures within the annotated area, more analysis methods are possible to be performed to the extracted data from the regions, such as deriving a function of temperature and area. 34 We believe further studies on infection could be efficiently carried out with the help of our proposed model.
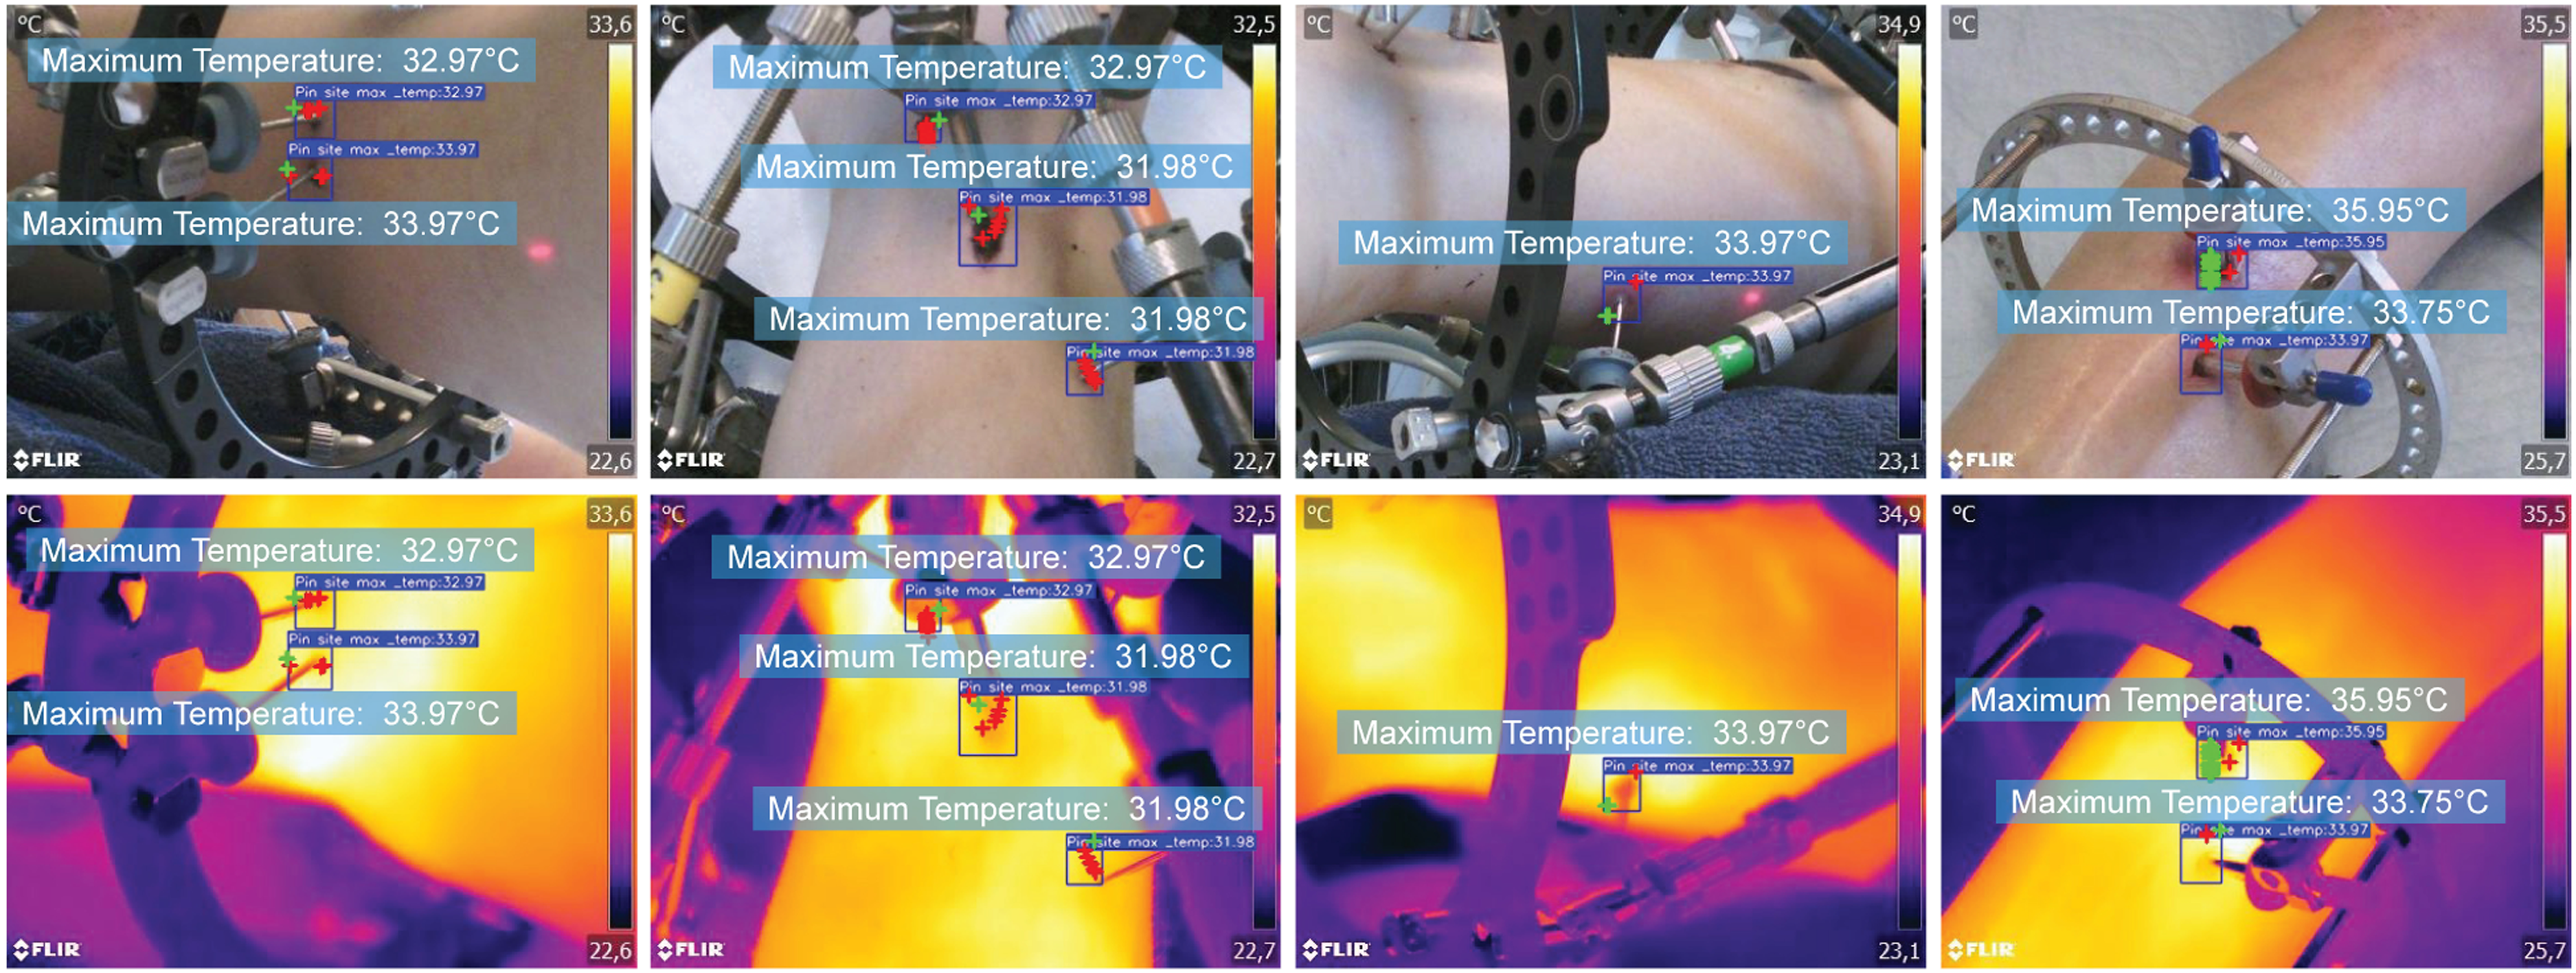
Measurement of maximum temperature in T1 data set.
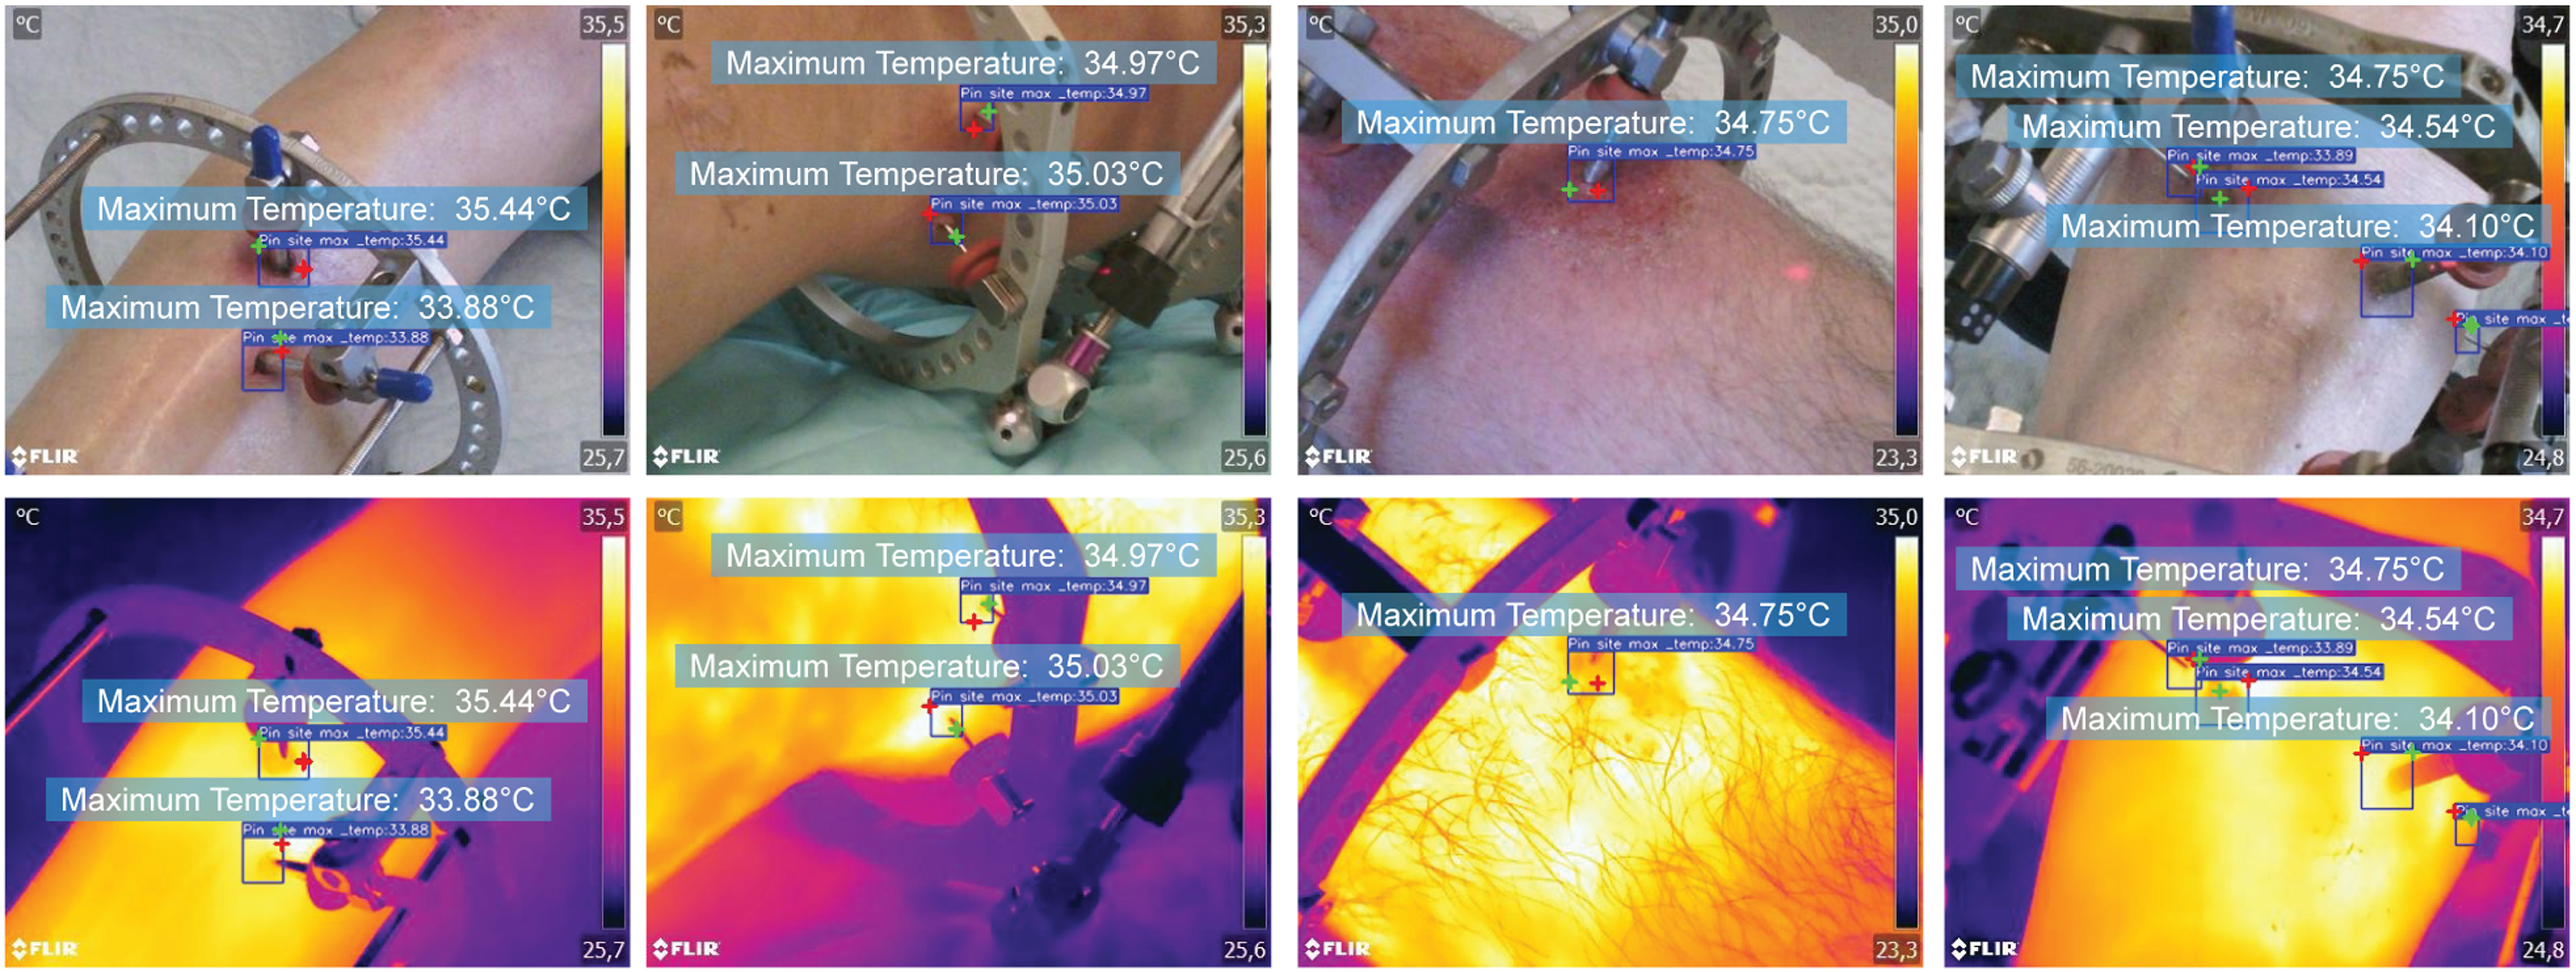
Measurement of maximum temperature in T2 data set.
Future work
The key task in our future work is to apply the pin site detection tool for studies focusing on infection detection. The temperatures at the pin site are associated with the early signs of wound inflammation and infection, and a thermography-based analysis might be an efficient tool to detect it.2,34 We will extend the size of our data set, and the developed pin site detection will be applied to automate the process of annotation to explore possible patterns of infection related to thermal imaging.
In addition, the results presented above demonstrate the general performance of the automatic pin site detection tool and indicate that it is ready for application in the research in infection detection for annotation of regions of interest. However, we notice that there is some room for improvement in our future work. First of all, the data sets in this work are collected from three different cameras while we were exploring the choice of cameras with the consideration of factors such as resolution, temperature accuracy, operating distance, costs and operational difficulties, which may be considered as weaknesses to the study. On the other hand, the use of diverse types of cameras and the different conditions, such as obtained by hospital staff or the patient himself, could introduce a strength to the proposed model since its generalization has been further expanded under different conditions with variations in image specifications. In future infection studies, the appropriate type of thermal camera will be selected for collecting the extended data set after careful assessment of those factors. Besides, a wider diversity of data related to pin site detection studies, such as skin tones, infection level and fracture type, will be collected and recorded in the future. The current pin site detection model has been trained primarily on images of light skin tones, as it reflects the predominant skin tones of actual patients from Scandinavian countries in our clinic. However, diversity is warranted, and more skin tones are essential for future refinement of the model. As for camera calibration and image registration, we simplify this step and obtain the registered visible images and temperature values from the thermal images with the help of the FLIR Image Extractor tool due to the limitation of materials. To transfer the region of interest to the thermal image more precisely, one of the two recommended calibration methods described in the ‘Method section will be implemented.
Conclusion
In this paper, we present a pin site detection model preparing for exploring a new technique of infection detection through thermography to monitor patients after lower limb external fixation. The challenge of annotating pin sites on thermal images has been overcome by applying the deep learning-based object detection model to the respective visible images and registering them with their corresponding thermal images. For locating pin sites on visible images, YOLOv5 object detection architecture is selected in this work, incorporated with a novel loss regression method by CDIoU and optimized by transfer learning to be adapted for patient applications in practical environments. Thanks to image registration, the detected bounding boxes can be transferred to the thermal images without losing accuracy and are ready for further temperature analysis. We have applied the proposed model to the data set, and the expected pin site regions and temperature values are successfully annotated and detected.
The development of the pin site detection model is significant to the future goal of studying the relationship between temperature and pin site infectionin patients with EFs with the following advances.
Provide an automatic pin site detection tool to extract targeted temperature information from a large number of thermal images, improving the efficiency of necessary data collection. Ensure the accuracy of marking pin sites by the conjoint utilization between visible images and thermal imaging through camera calibration and image registration. Optimize the YOLOv5 object detection architecture for pin site detection in general scenarios, which is achieved by integrating the CDIoU loss function and cooperating with the transfer learning algorithm. Pave the way for our further research to reveal the underlying patterns of infection detection through thermography.
Being able to extract targeted temperature information from a large number of images automatically, this time-consuming work is therefore simplified and necessary data for analysis would be available. In addition, we leverage the object detection model, YOLOv5, in this work for pin site detection. Instead of directly using the original model, the selection of loss functions is considered for potential optimization towards our aimed applications. Our experiment indicates CDIoU outperforms other conventional methods and is selected. It also verifies the effectiveness of the CDIoU loss function integrated into the YOLOv5 architecture in practical applications. Besides, the transfer learning algorithm is incorporated, and the motivation comes from our experiment results that the YOLOv5 pin site detection model trained in a hospital data set has a reduced accuracy when applied to a patient’s home environment. Despite the limitation of the size of the home scenario data set, after being finetuned transfer learning, the model manages to increase precision and recall rate by 0.1 and 0.14, respectively, showing the adaptability in the home scenario. In general, compared to the original model, for the data set from home scenarios, the introduction of CDIoU loss function and transfer learning improves the accuracy performance and maintains inference time similarly. The experimental results in this paper have demonstrated the desired capability as well as the performance of the proposed pin site detection model that satisfies the requirements of detecting pin sites above.
By calibrating and registering the thermal camera and visible camera, the detected bounding boxes of pin sites on the visible images can be transferred to the thermal images for temperature analysis and infection detection. Once we could determine the assessment criteria of pin site infection on thermal images, the patients could use their mobile phones with the proposed pin site detection model for remote monitoring every day at home. In total, this paper exhibits the first work applying an object detection model on thermographic images for pin site detection, which paves the way for our future research on infection analysis with temperature information.
Footnotes
Acknowledgements
The authors would like to thank the orthopedic patients who provided us with image data in this research.
Contributorship
SA and QH researched literature and wrote the first draft of the manuscript. SA designed the model and analysed data. MF and SA were involved in the data collection. All authors reviewed and edited the manuscript and approved the final version of the manuscript.
Conflict of interests
The authors declared no potential conflicts of interest with respect to the research, authorship and/or publication of this article.
Ethical approval
Ethical approval was not sought for the present study because the data we collected is not sensitive, has no ethical risks and is completely anonymous without personal information.
Funding
The authors received the following financial support for the research, authorship, and/or publication of this article: This work was supported by Innovation Fund Denmark (Project No.: 0161-00023).
Guarantor
Ming Shen.