
Abstract
Objective
Urinary tract infection is one of the most prevalent bacterial infectious diseases in outpatient treatment, and 50–80% of women experience it more than once, with a recurrence rate of 40–50% within a year; consequently, preventing re-hospitalization of patients is critical. However, in the field of urology, no research on the analysis of the re-hospitalization status for urinary tract infections using machine learning algorithms has been reported to date. Therefore, this study uses various machine learning algorithms to analyze the clinical and nonclinical factors related to patients who were re-hospitalized within 30 days of urinary tract infection.
Methods
Data were collected from 497 patients re-hospitalized for urinary tract infections within 30 days and 496 patients who did not require re-hospitalization. The re-hospitalization factors were analyzed using four machine learning algorithms: gradient boosting classifier, random forest, naive Bayes, and logistic regression.
Results
The best-performing gradient boosting classifier identified respiratory rate, days of hospitalization, albumin, diastolic blood pressure, blood urea nitrogen, body mass index, systolic blood pressure, body temperature, total bilirubin, and pulse as the top-10 factors that affect re-hospitalization because of urinary tract infections. The 993 patients whose data were collected were divided into risk groups based on these factors, and the re-hospitalization rate, days of hospitalization, and medical expenses were observed to decrease from the high- to low-risk group.
Conclusions
This study showed new possibilities in analyzing the status of urinary tract infection-related re-hospitalization using machine learning. Identifying factors affecting re-hospitalization and incorporating preventable and reinforcement-based treatment programs can aid in reducing the re-hospitalization rate and average number of days of hospitalization, thereby reducing medical expenses.
Keywords
Introduction
Outpatient treatment-sensitive diseases include acute/chronic complications of diabetes, hypertension, heart failure, chronic obstructive pulmonary disease in the elderly, asthma, community-acquired pneumonia, and urinary tract infection. 1 In 2021, Jung et al. 2 reported that outpatient treatment-sensitive diseases cost approximately 600 billion won per year, and in 2013, Freund et al. 3 reported that 41% of hospitalizations owing to outpatient treatment-sensitive diseases could have been prevented with appropriate intervention. Therefore, identifying the factors that affect the re-hospitalization of outpatients with treatment-sensitive diseases is important to prevent re-hospitalization. Recently, several studies have used logistic regression, a machine learning algorithm, to identify the factors affecting re-hospitalization. In 2012, Billings et al. conducted a series of logistic regression analyses to identify the variables that predominantly contributed to re-hospitalization prediction within 30 days after discharge by generating risk scores in the range of 0–1, which aided in identifying the expected probability of re-hospitalization. This model was used to estimate the risk and cost of re-hospitalization in National Health Service hospitals in the UK within 30 days of discharge. The positive predictive value, sensitivity, and area under the receiver operating characteristic curve (AUC) value were determined to be 59.2%, 5.4%, and 0.70, respectively. 4 In 2019, Cho et al. developed a re-hospitalization prediction model using logistic regression and examined the characteristics and status of re-hospitalization cases. The logistic regression model achieved a high AUC value of 0.81 with a misclassification rate of 0.21 using variables such as gender, age, region, main diagnosis group, Charlson Comorbidity Index, discharge type, emergency room transit, hospital days, surgery, total medical expenses, and payment type to predict re-hospitalization. 5
Previous studies that used logistic regression analysis were analyzed, and clinical factors affecting re-hospitalization that were determined using machine learning algorithms were also identified as a part of the literature review in this study. Analyzing re-hospitalization through this approach is useful; however, in 2017, Shin and Lee 6 recommended the inclusion of demographic, clinical, and medical expenses data when conducting a regression analysis.
Therefore, further research is required to analyze the factors affecting re-hospitalization for outpatient treatment-sensitive diseases, which are determined using various approaches, to identify ways to prevent re-hospitalization. Urinary tract infection is one of the most common bacterial infectious diseases in outpatient treatment. Statistics indicate that 50–80% of women experience it more than once in their lives, with a recurrence rate of 40–50% within a year, even if antibiotic treatment is appropriate. 7 However, in the field of urology, no research analyzing the status of re-hospitalization because of urinary tract infections using machine learning algorithms or considering preventable factors has been reported to date. The re-hospitalization rate is a primary outcome indicator used to evaluate the quality of medical services. In South Korea, the Health Insurance Review and Assessment Service calculates the number of re-hospitalizations within 30 days after discharge. 8
Therefore, this study aimed to analyze the clinical and nonclinical factors of patients who were re-hospitalized within 30 days owing to urinary tract infections among outpatients with treatment-sensitive diseases using various machine learning algorithms. Moreover, by classifying risk groups according to the top factors affecting re-hospitalization of urinary tract infections, indicators such as re-hospitalization rate, days of hospitalization, mortality, and medical expenses of each risk group were identified, and the amount of reduction in each indicator when the factor was prevented was determined.
Methods
Research environment
This study used an Intel(R) Core™ i7-10700 K (Intel, Santa Clara, CA, USA) processor with 32 GB RAM. The algorithms were run using Python (Version 3.8.12) on 64-bit operating systems. Machine learning was conducted using GeForce RTX 2080Ti 24GB (NVIDIA, Santa Clara, CA, USA).
Data
In this study, to analyze various factors related to patients who are re-hospitalized within 30 days because of urinary tract infection, the data of patients who visited Gachon University Gil Medical Center from May 2018 to May 2023 were collected; from this data, patients who were diagnosed with urinary tract infection and were readmitted within 30 days after initial discharge were identified. Patients with unplanned re-admission to the institution were selected as study subjects, resulting in 497 patients. When considering the size of the control group, because the ratio of the number of study subjects in the group to control size should not be more than 1:1.5, 496 patients who did not require re-admission within 30 days were selected as the control group. During the hospitalization process, the study subjects were informed that their medical record data would be used for research and gave written consent. The data related to the study subjects were collected retrospectively from medical records in the period from May 2018 to May 2023 using the Clinical Research Data Warehouse (CRDW) program. Research approvals were confirmed by the Institutional Review Boards of Gachon University Gil Medical Center (GBIRB2023-434).
The collected data consisted of 30 clinical and nonclinical factors that have been verified to affect urinary tract infections based on previous studies (Table 1). Clinical factors refer to those directly related to a patient’s health status or degree of function, such as demographic factors (age and gender), severity, acute clinical stability (vital signs and serum electrolytes), types of companion diseases, and physical functional status. In contrast to clinical data, nonclinical data refers to factors indirectly related to health status or function, such as patient attitudes and preferences, psychological, cognitive, and social functions, cultural, national, and socioeconomic beliefs and behaviors, and health-related quality of life. 9 The clinical and nonclinical factors considered in this study are listed in Table 1.
Urinary tract infection-related patient data.

Machine learning algorithms
Using a machine learning algorithm, the collected data were used to analyze the relative importance of re-hospitalization factors. Machine learning can be divided into two main categories: ‘supervised learning,’ in which data of outcome values are predicted, and algorithms learn and perform according to labeled data, and ‘unsupervised learning,’ which is used to classify outcome values without a fixed result value. Supervised learning can be divided into classification, which involves the prediction of one of several predefined possible classes, and regression, which refers to the prediction of multiple data in the form of graphs in two or three dimensions. 10 The data input to machine learning algorithms is divided into training and test data, and a model is created using the training data. Subsequently, only the independent variables of the test data are reflected in the model to predict a dependent variable, and the model is evaluated by comparing this value with the actual dependent variable value of the test data. Therefore, rather than an accurate estimation, the purpose is to determine the extent to which the predicted value of the dependent variable matches the actual dependent variable; through this, the performance of the model is determined. 11
We compared 15 machine learning models and identified four models—gradient boosting classifiers, random forests, naive Bayes, and logistic regression—that have exhibited superior performance in terms of accuracy, area under the precision-recall curve (AUC-PR), AUC, and F1-score. Logistic regression was included because of its frequent application in related studies. Among the four models, the best-performing model was adopted and learned, and the top 10 factors affecting re-hospitalization for urinary tract infections were finally derived in the form of a feature importance plot.
The gradient boosting classifier model solves regression problems in machine learning algorithms and generates a robust predictive model from a set of weak predictive models in an ensemble form. Thus, a tree is formed to compensate for the errors of the previous tree or a tree with a shallow depth. 10 The random forest model is an ensemble classification and regression approach developed by Breiman in 2001 and is the most successful way to scale and process information while maintaining statistical efficiency. In this model, a sample portion of the data is obtained, a random tree predictor is grown on each small piece, and these predictors are combined.12,13 The naive Bayes model is primarily used in supervised learning environments and refers to selecting the classification with the highest probability among the calculated probabilities by calculating the probability that any document belongs to a specific classification. 14 A logical regression model is a method for constructing statistical models to describe the relationship between dichotomous (yes/no type) results (dependent variables) and a set of independent predictors. 15
Statistical analysis
Numerical data were analyzed using an independent sample t-test to verify the collected data statistically. The test used the MedCalc program (Version 19.6.1, MedCalc Software Ltd, Ostend, Belgium).
Accuracy, AUC-PR, AUC, and F1-score were used as performance evaluation indicators for the machine learning models. A confusion matrix refers to a contingency table indicating the number of elements correctly predicted versus the number misclassified whenever an algorithm is used to distinguish between elements in a dataset under two conditions (positive and negative).
16
Equations (1)–(4) show the performance index calculation formulas. Here, true positive (TP) implies that an actual positive sample is accurately classified as positive, true negative (TN) implies that an actual negative sample is accurately classified as negative, false positive (FP) implies that an actual negative sample is incorrectly classified as positive, and false negative (FN) implies that an actual positive sample is incorrectly classified as negative.
17
The confusion matrix was used to generate a receiver operating characteristic curve,
18
and the area below the curve indicates the AUC. The AUC ranges between zero and one, and a value closer to one indicates a better classification.


Results
Results of relative importance analysis of re-hospitalization factors using machine learning algorithm
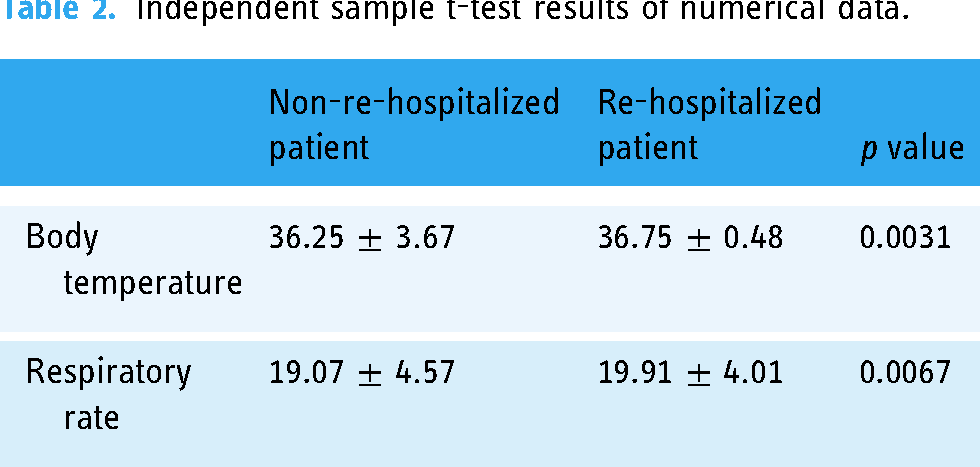
By collecting 19 numerical data from the aforementioned 30 clinical data and analyzing them using the independent sample t-test, we observed a significant difference in body temperature and respiratory rate between re-hospitalized patients and those who were not (Table 2).
Independent sample t-test results of numerical data.
The factors affecting re-hospitalization were analyzed using four machine learning algorithms: gradient boosting classifier, random forest, naive Bayes, and logistic regression. The gradient boosting classifier showed the best performance for nearly all performance indicators, with accuracy, AUC-PR, AUC, and F1-score of 0.8721, 0.9588, 0.9607, and 0.8825, respectively; therefore, it was adopted as the final machine learning model for this study (Table 3).
Performance assessment of various machine learning algorithms.
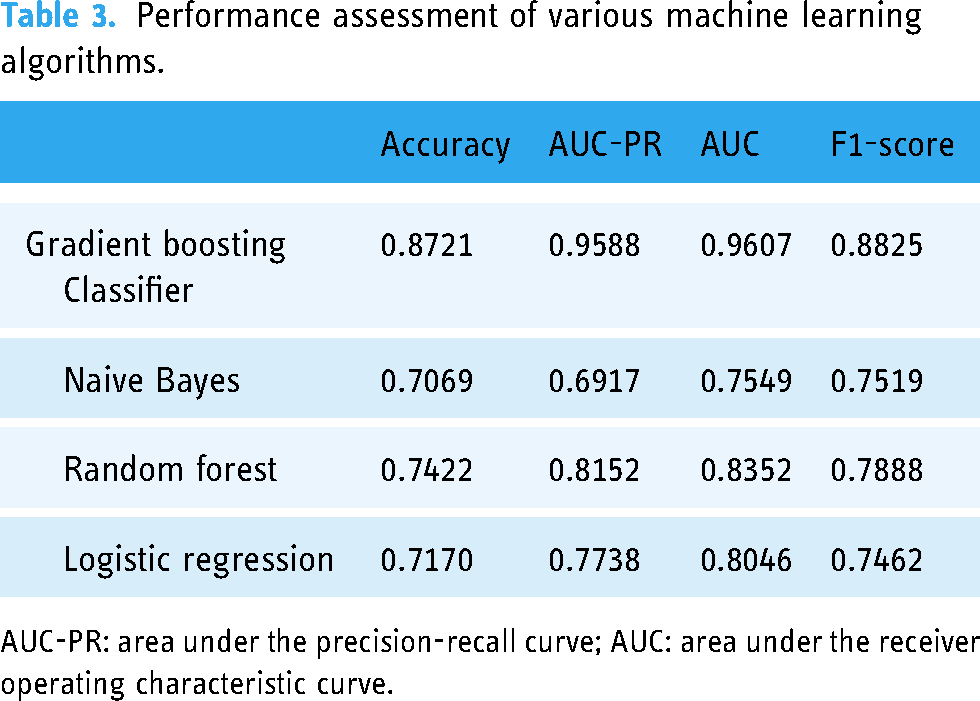
AUC-PR: area under the precision-recall curve; AUC: area under the receiver operating characteristic curve.
The top 10 factors affecting re-hospitalization for urinary tract infections that were derived using the best-performing gradient boosting classifier were determined using a feature importance plot. As shown in Figure 1, the top 10 factors affecting re-hospitalization because of urinary tract infections are respiratory rate, days of hospitalization, albumin, diastolic blood pressure (DBP), blood urea nitrogen (BUN), body mass index (BMI), systolic blood pressure (SBP), body temperature, total bilirubin, and pulse.

Feature importance plot derived from the gradient boosting classifier.
Analysis of re-hospitalization status and economic characteristics of risk groups according to re-hospitalization indicators
Based on the top 10 factors affecting re-hospitalization for urinary tract infections, 993 patients were classified into various groups with risk of hospitalization ranging from low to high values, and the re-hospitalization rate, average days of hospitalization, mortality, and medical expenses of each risk group were analyzed. The medical expenses were calculated based on the medical expenses of KRW 98,225 per day in hospitals in South Korea, 19 which were converted into U.S. dollars by applying the exchange rate on 18 August 2023 (Table 4).
Re-hospitalization rate, average days of hospitalization, mortality, and medical expenses analysis results according to risk group.

As shown in the graph, the re-hospitalization rate increases from the low- to high-risk group, showing that the top-10 factors for urinary tract-infection-related re-hospitalization derived from Result 1 were also verified in an external independent cohort. Moreover, the average number of days of hospitalization and medical expenses also increased in the low- to high-risk groups (Figure 2). In contrast, as re-hospitalization factors were prevented, the average re-hospitalization rate, average days of hospitalization, and average medical expenses decreased by 11.11%, 1.81 days, and 133$, respectively, from the high- to low-risk group.

Graph of re-hospitalization rate, average days of hospitalization, mortality, and medical expenses according to risk group.
Discussion
Previous studies have also analyzed whether the top 10 factors that were derived from the results of this study were related to re-hospitalization for urinary tract infections. Vital signs, which account for 50% of the top 10 factors, are an objective measure of the essential physiological functions of living organisms and refer to body temperature, pulse, respiratory rate, and blood pressure. The name ‘Vital’ indicates that the measurement and evaluation of these signs are essential first steps in all clinical evaluations. 20 The first vital sign, body temperature, is an essential measure of human health; therefore, abnormal body temperature is a potential marker of serious diseases in clinical practice and can determine infection, inflammatory reactions, and patient status. 21 Because fever in older patients is often an indication of more serious infections and is associated with life-threatening consequences, even subtle changes in the core body temperature can be an important discovery 22 ; therefore, it is considered an important factor for identifying older patients who are likely to be re-hospitalized for urinary tract infections. The second important factor, pulse, measures physiological and pathological processes affecting the body. High amplitude and rapid elevation can indicate conditions such as aortic valve regurgitation, mitral regurgitation, and hypertrophic cardiomyopathy 23 ; therefore, the pulse can indicate the possibility of re-hospitalization. The third important factor, tachypnea, is described as a respiratory rate of more than 20 breaths per minute, which can occur during physiological conditions such as exercise, emotional changes, or pregnancy. Pathological conditions such as pain, pneumonia, pulmonary embolism, asthma, foreign substance aspiration, anxiety, sepsis, carbon monoxide poisoning, and diabetic ketoacidosis can also result in tachypnea. Because respiratory rates are more sensitive than other vital signs in critically ill patients,24,25 they effectively screen critically ill patients who are likely to be readmitted. Finally, blood pressure is a vital sign for determining the hemodynamic condition of a patient, and a high SBP may result in aged blood vessels and increased arterial stiffness. 26 Vital signs accounted for one-half of the top 10 factors in this study because they are important indicators for measuring and evaluating the physical health status of a patient, similar to that in previous studies.
Among the laboratory values, total bilirubin, albumin, and BUN values were included in the top 10 factors for re-hospitalization. First, total bilirubin correlates with increased bilirubin levels and kidney damage 27 ; therefore, urinary tract infection-related re-hospitalization can be predicted from this factor. Moreover, persistent or progressive hyperbilirubinemia can indicate a high probability of re-hospitalization because it indicates an ongoing active infection. 28 According to a study by Yuwen et al. in 2017, the value of albumin between the infected and non-infected groups is statistically significant, 29 indicating the risk of urinary tract infection and the possibility of re-hospitalization. In the case of BUN, if renal failure occurs, the BUN concentration is high 30 ; therefore, high BUN values indicate a high possibility of re-hospitalization owing to urinary tract infection.
In 2006, Park et al. classified more than 10 days of hospitalization as a risk factor based on statistics published by the National Health Insurance Service in 2004 that the average hospitalization period for contracting hospital-acquired urinary tract infection is 9.35 days. 31 In this study, the average number of days of hospitalization for high-risk groups was also determined to be more than 10 days, which was considered a more prevalent factor for re-hospitalization; therefore, we can conclude that similar results were derived from previous studies.
Finally, the BMI is a tool medical professionals use to estimate the risk of developing chronic diseases. A BMI of 30 or higher indicates poor health conditions with a high risk of heart disease, stroke, diabetes, high blood pressure, and some cancers; therefore, a high BMI can indicate a high probability of re-hospitalization. 32
Among the top 10 factors derived from the gradient boosting classifier model, realistically preventable factors included respiratory rate, blood pressure, body temperature, pulse, and BMI, and preventable methods included music therapy and exercise programs. According to a study conducted by Hong in 1994, changes in vital signs of SBP, DBP, pulse, respiratory rate, and body temperature after music therapy were significantly lower in the experimental group than those in the control group. 33 Moreover, according to a study conducted by Lee Gun-ja et al. in 2007, exercise resulted in a positive change in the physical strength of subjects in both normal and obese groups with a significant decrease in weight and BMI. In addition to exercise intervention, studies have suggested that reinforcement programs such as active nutritional counseling or behavioral modification therapy should be included, 34 and exercise and reinforcement programs can reduce abnormal BMI values to prevent re-hospitalization for urinary tract infections. Therefore, among the factors influencing urinary tract infection-related re-hospitalization that were derived in this study, preventable factors can be reduced by music therapy and exercise programs; consequently, the actual re-hospitalization rate and average days of hospitalization can decrease, resulting in reduced medical expenses.
Conclusion
In this study, the clinical and nonclinical factors related to patients who were re-hospitalized within 30 days owing to urinary tract infections among outpatient treatment-sensitive diseases were analyzed using various machine learning algorithms. Moreover, indicators such as re-hospitalization rate, days of hospitalization, mortality, and medical expenses of each risk group were identified by classifying patients into risk groups based on the top factors affecting re-hospitalization for tract infections.
Re-hospitalization factors were analyzed using four machine learning algorithms: gradient boosting classifier, random forest, naive Bayes, and logistic regression. The gradient boosting classifier showed the best performance for nearly all performance indicators, with accuracy, recall, AUC-PR, AUC, and F1-score of 0.8721, 0.9598, 0.9588, 0.9607, and 0.8825, respectively; therefore, it was adopted as the final machine learning model in this study. According to the gradient boosting classifier model, the top 10 factors influencing urinary tract infection-related re-hospitalization were respiratory rate, days of hospitalization, albumin, DBP, BUN, BMI, SBP, body temperature, total bilirubin, and pulse. Based on these factors, 993 patients were classified into various groups with risks ranging from low to high values. The re-hospitalization rate, average number of days of hospitalization, mortality, and medical expenses were observed to increase from the low- to high-risk group. In contrast, the average re-hospitalization rate, days of hospitalization, and medical expenses decreased by 11.11%, 1.81 days, and 133$, respectively, from the high- to low-risk group.
This study is important because it is the first attempt to collect data using the CRDW program and analyze the re-hospitalization status and economic characteristics of urinary tract infections in South Korea. Moreover, various re-hospitalization factors, including the probability of repeated admission (PRA) score, which is often used to predict re-hospitalization, were analyzed. The PRA scale, which ranges from zero to one, was calculated using the following details of the patient: gender, age, presence of diabetic or ischemic heart disease, hospitalization in the previous year, prior visit to a doctor, self-evaluated health level, and presence of a care provider. Moreover, in addition to the re-hospitalization indicators used in the PRA scale, vital signs (body temperature, pulse, respiratory rate, and blood pressure) and laboratory values were also considered factors affecting re-hospitalization because of urinary tract infections. Furthermore, various machine learning algorithms and nonclinical factors were used to differentiate this study from previous studies, and among these, the gradient boosting classifier model was observed to be effective for analyzing the urinary tract infection-induced re-hospitalization indicators. This study also showed the possibility of re-hospitalization status analysis using machine learning algorithms other than logistic regression.
However, a limitation of this study is that the amount of data was smaller than that of previous studies. Moreover, although the attempt to analyze nonclinical factors was good, they did not feature among the top 10 factors that affected re-hospitalization for urinary tract infections. Furthermore, additional factors affecting re-hospitalization for urinary tract infections should be identified. In this study, data were collected using the CRDW program; therefore, collecting anatomical pelvic data was difficult. A large amount of data must be collected in future research to identify additional factors other than the nonclinical factors identified in this study. Lastly, since this study aimed to employ machine learning in identifying the factors and economic indicators influencing the re-hospitalization of urinary tract infection patients, an external independent cohort was not incorporated. Consequently, it appears imperative to undertake additional research by analyzing an external independent cohort in the future to ascertain the consistency of the findings with those of this study.
This study showed new possibilities in analyzing the status of re-hospitalization for tract infections using machine learning algorithms, which can reduce the re-hospitalization rate, average days of hospitalization, and mortality, thereby further reducing medical expenses.
Footnotes
Contributorship
JYM and KGK contributed to the study's conception and design. Material preparation, data collection, and analysis were performed by YHL, YSB, YJK, and HJS. The first draft of the manuscript was written by YHL and all authors commented on previous versions of the manuscript. All authors read and approved the final manuscript.
Declaration of conflicting interests
The authors declared no potential conflicts of interest with respect to the research, authorship, and/or publication of this article.
Ethical approval
This study was conducted in accordance with the principles of the Declaration of Helsinki. Approval was granted by the Institutional Review Boards of Gachon University Gil Medical Center (GBIRB2023-434).
Funding
The authors declared the following potential conflicts of interest with respect to the research, authorship, and/or publication of this article: This work was supported by the GRRC program of Gyeonggi province. [GRRC-Gachon2023(B01), Development of AI-based medical imaging technology], and by the Technology Innovation Program or Industrial Strategic Technology Development Program (K_G012001185601, Building Data Sets for Artificial Intelligence Learning) funded By the Ministry of Trade Industry & Energy(MOTIE, Korea).
Informed consent
Informed consent was obtained from all individual participants included in the study.
Guarantor
Kwang Gi Kim.