
Abstract
Background
Web portals providing health information online have the potential to reach large numbers of people. Yet few studies have assessed usage and costs of health portals, especially over an extended period of time.
Objectives
First, to assess the usage of a web portal on prevention and health promotion that was initiated by the German states of Berlin and Brandenburg. Second, to estimate average cost per pageview over the full web portal life-cycle.
Methods
Usage data were gathered through Google Analytics. The main usage metric assessed was pageviews originating from an IP address in Berlin or Brandenburg. Project cost data were reported by the local government and from own records. Descriptive and regression analyses were used to determine time trends in pageviews.
Results
The redesigned web portal Praeventionsatlas.de launched August 2011 and was discontinued March 2018. Analyzing the full calendar years only, the annual pageview number increased from 2012 (8492) to its peak in 2014 (11,876) and steadily decreased to its minimum in 2017 (7232). Pages of the web portal were most often viewed around lunchtime (12 to 1 p.m.), in the middle of the week (Wed to Thu), and at the beginning of the year (Jan to Feb). Adjusting for year, month, and weekday, the number of daily pageviews dropped on major public holidays (Easter −9, Pentecost −12, Christmas −12 and New Year’s Eve and Day −20; p < .001) and increased during the fasting period before Easter (+6; p < .001). Average cost per page viewed from relaunch until the web portal went offline was estimated to be €0.38 (€0.33 to €1.67) per pageview.
Conclusion
Usage of the web portal showed temporal variation and peaked before the middle of its 6.5 year life-cycle. Development and need for updates may require substantial investment in a web portal, such that a pageview can come at a considerable expense, even in small-scale projects. Assessing and discussing the cost-effectiveness of a web portal is therefore desirable.
Keywords
Introduction
Internet access and use are increasing, and using the Internet as a health information resource is, to a varying degree, common across age groups.1–4 In Germany, more than 20% of the German speaking population may have used the Internet occasionally or often in 2016 as a source for health tips or information about diseases and medicines. 5 Online health promotion activities therefore have the potential to reach many people. Yet, few studies have assessed usage and/or cost data of health promotion websites, especially over a long period of time.6,7
In an initiative to encourage people's participation in existing health promotion and disease prevention activities, the two German states of Berlin and Brandenburg, in 2008, launched a booklet and a web portal with regional focus. The content of the booklet and web portal corresponded. Both presented health tips and information on regionally available health promotion activities and projects. In 2011, the web portal and booklet were completely redesigned and relaunched, shifting the focus from the printed dissemination of information to the web portal.8–10 Furthermore, the city of Berlin endorsed the development of a second health promotion portal. It went online in February 2014.11,12 The second health portal was of a larger scale and additionally aimed to provide up-to-date information on specific health promotion courses and programs. In sum, more than €125,000 of public funds were probably invested between 2011 and 2014 in providing web-based information on disease prevention and health promotion activities in the German Berlin–Brandenburg region. 13 Ten years later, both health promotion portals have been taken offline.
On the one hand, web portals have the potential to reach large numbers of people. On the other, they usually require substantial start-up expense and ongoing investment to maintain quality. This study assesses and describes up to 6.5 years of usage data from the earlier of the two web portals on prevention and health promotion that existed in the German states of Berlin and Brandenburg. Further, major project costs incurred were evaluated in relation to the usage of the web portal over its life-cycle.
Methods
The web portal Praeventionsatlas.de
The two German states of Berlin and Brandenburg have been cooperating as a health region since 2007. One initiative within a joint master plan 14 for the health region was to take inventory of regionally available disease prevention and health promotion activities and providers. The results of mapping health promotion activities and providers in the Berlin–Brandenburg region were shared with the local community through a booklet and a web portal ‒ both called the Prevention Atlas Berlin-Brandenburg (in German: Präventionsatlas Berlin–Brandenburg) (Figure 1).

Screenshot of the health promotion portal Praeventionsatlas.de.
A first edition of the booklet and the web portal (Praeventionsatlas.de) were launched in 2008. 15 Both were revised and updated in a second edition 3 years later. The second edition of the booklet and web portal received €30,041.9113 direct funding by the local government and launched on August 30, 2011.16,17 The Institute for Social Medicine, Epidemiology and Health Economics at the Charité – Universitätsmedizin Berlin, which had developed the content of the first edition of the Prevention Atlas Berlin–Brandenburg, was again commissioned to develop the content for a new edition of the booklet and web portal and to program the web portal. A common design for the web page and booklet as well as the printing of the booklet was undertaken by other project partners on behalf of the federal states Brandenburg and Berlin. A total of 10,000 copies of the second edition of the booklet were printed.8–10 The web portal was discontinued and taken offline in March 2018 after a total website life-cycle of about 10 years, of which the assessed second edition existed for 6.5 years. The second edition of the Praeventionsatlas.de web portal, which is assessed in this study, received no significant technical or content updates over the course of its life-cycle.
The web portal had content that was specific to the Berlin–Brandenburg region, such as examples of local health promotion projects and activities, and general interest content, like health tips on the reduction of key risk factors for noncommunicable diseases (NCDs). The information provided through the web portal or booklet was organized around four health promotion themes:
diet; physical activity; stress; and addiction (focus on smoking).
To encourage visitors of the web portal to make use of health promotion activities, which are locally available at no or low cost, Praeventionsatlas.de offered brief health advice (5 to 10 bullet points for each health promotion theme). The health advice was combined with a searchable database of examples of corresponding regional health courses and projects. Typical health promotion activities included in the searchable database were examples of free health activities, courses eligible for a subsidy by the statutory health insurance, and good practice examples of health promotion activities in different settings (e.g., in local kindergartens, schools, workplaces, or communities).
Usage metrics and data sources
Usage data of the web portal were gathered through Google Analytics (GA) from the launch date of the redesigned, second edition of the web portal Praeventionsatlas.de (August 30, 2011) until the web portal went offline (March 12, 2018). Anonymized GA data were downloaded using the GA Application Programming Interface through a spreadsheet add-on. 18 The GA data describe user activities on the web portal for each page viewed with its path, a time stamp, and an estimate for the duration a user was active on the page. Further, an approximated geographic origin of users is provided, based on user IP addresses, which were not reported by GA. Data about the direct costs of developing the second edition of web portal and booklet were derived from a Berlin state government report 13 and from own records.
The GA metrics selected for analysis included pageviews, sessions, average session duration, new and returning users, and the bounce rate. Pageviews were chosen over the number of users or the number of sessions for an extended analysis because the pageview metric reflects a mix of the frequency of website visits and the intensity of engagement with the content of the website. Detailed metrics definitions can be found on the GA website. 19 This study reports GA metrics according to their 2017 definition.
Study design and analysis
The study consists of two parts. Part one examined how the web portal was used. Engagement of new and recurring users with the main content of the web portal was analyzed retrospectively. Part two is a costing study that estimated the development of the average cost per pageview and per new user over time.
In part one, GA metrics were summarized by different natural time units (year, month, day, hour) and graphically presented to describe how users’ engagement with the website and users’ information-seeking behavior with respect to specific content developed over time. To obtain, for instance, the metric pageviews per day, pageviews recorded by GA were summed-up by the hour of the day recorded in the GA time stamp. Trends in desktop or laptop, tablet, and mobile phone access of the web portal, intensity of its usage, and users’ interests on the web portal were described based on the development of the number and distribution of pageviews over time. Multivariable regression analysis was used to assess the independent associations of the number of daily pageviews with public holidays, religious festivals, and the festive season after adjusting for the calendar year, month of the year, weekday, and the launch of a second web portal on prevention and health for the city of Berlin in February 2014; Huber-White robust standard errors were used.
In the second part, average costs at a certain time point were estimated by dividing the project costs for developing the content of the Präventionsatlas Berlin–Brandenburg booklet and web portal and for programming the web portal by the number of pageviews or by the number of new users that were counted up to a certain date. No other expenses, for example, design or operating costs, were considered. As usage of the web portal was exceptionally high immediately after its launch, data on initial pageviews and new users were adjusted using 2012 to 2017 average values from August 30 to September 30 in the average cost estimation for the period from August 30 to September 30, 2011. Lower average cost bounds were derived by omitting this adjustment and counting all 2011 engagement with the web portal. Upper average cost bounds were derived by dividing the development costs of the second health promotion portal in Berlin by the adjusted pageviews and new users data of the Praeventionsatlas.de web portal, respectively.
Analyses were usually limited to data from visits originating in Berlin and Brandenburg because parts of the web portal content, like sample health courses and projects, targeted only these two states. Some analyses were conducted for the years 2012 to 2017 only to focus on comparable GA data that were collected for a full year and to exclude the unusual post-relaunch data of 2011. If not indicated otherwise, results are reported for pageviews from January 1, 2012 to December 31, 2017, by new and returning users who accessed the web portal from an IP address in Berlin or Brandenburg. Data processing and statistical analyses were performed using Stata 15.1 SE.
Results
Main elements of the web portal
The Praeventionsatlas.de web portal consisted of six main elements, each of which covered in this study:
A start page welcoming the user with a brief explanation of the web portal and links to other main elements. Brief health tips (5 to 10 bullet points per theme) organized around four health promotion themes. A search page for the course and project database as well as an always visible search tab, shown at the side of each site, to display or hide a quick search bar for the database that can be superimposed on any content. A page dedicated to downloading or ordering the printed booklet free of charge. Activity-provider lookup-pages organized by provider type: health insurance, sports clubs, education centers, and other providers. Other elements: a help page, a contact form, and an “about us” page.
From where do users access the web portal?
A total of 71,758 pageviews of the web portal from users in Berlin or Brandenburg accounted for 75% of the 96,106 pageviews recorded for Germany and for almost 70% of the 103,764 pageviews counted worldwide over the life-cycle of the Praeventionsatlas.de web portal (August 30, 2011, to March 12, 2018). The majority of pageviews originated from Berlin (62,329) and the second largest share originated from the state of Brandenburg (9429). At the end of 2017, the populations of Berlin and Brandenburg were estimated at 3.6 and 2.5 million people, respectively. The most populous German state, North Rhine-Westphalia, accounted for another 6547 pageviews, and the second most populous German state, Bavaria, for another 3253 pageviews (populations of 17.9 and 13.0 million people at the end of 2017, respectively, according to the Federal Statistical Office of Germany). The three highest numbers of pageviews originating outside Germany were registered for the United States (903), Austria (726), and Brazil (521) (see supplementary tables S1 and S2).
How did users access the web portal?
User access data were only available for all users worldwide. Overall, 81% of all user sessions from 2012 through 2017 were from a computer (desktop or laptop) and 19% came from either a mobile phone (12%) or a tablet (7%). The sessions of computer users compared with mobile phone and tablet users were characterized by a lower bounce rate (61% versus 72% and 63%, respectively). Both computer and tablet users engaged more with the web portal than mobile phone users (pages per session: 2.3 and 2.2 versus 1.7; average session duration: 1.5 min versus 1 min).
A significant change since the launch of the web portal has been the rapid growth in the share of sessions by users who accessed the web portal from a mobile phone or a tablet (5% in 2012 versus 29% in 2017). In turn, the share of web portal sessions on computers steadily decreased from 95% in 2012 to 71% in 2017. The number of web portal sessions on computers peaked in 2014. The number of tablet sessions peaked one year later in 2015. In contrast, mobile phone access continued to increase in numbers until 2017 (Figure 2(a)). In the first months after the web portal’s relaunch, computer users viewed about 1.5 to 4 times as many pages per session during longer sessions than mobile phone and tablet users. Between 2012 and 2017, computer and tablet users’ engagement became increasingly similar both featuring more pageviews per session and longer sessions than mobile phone users. (Figure 2(b)).
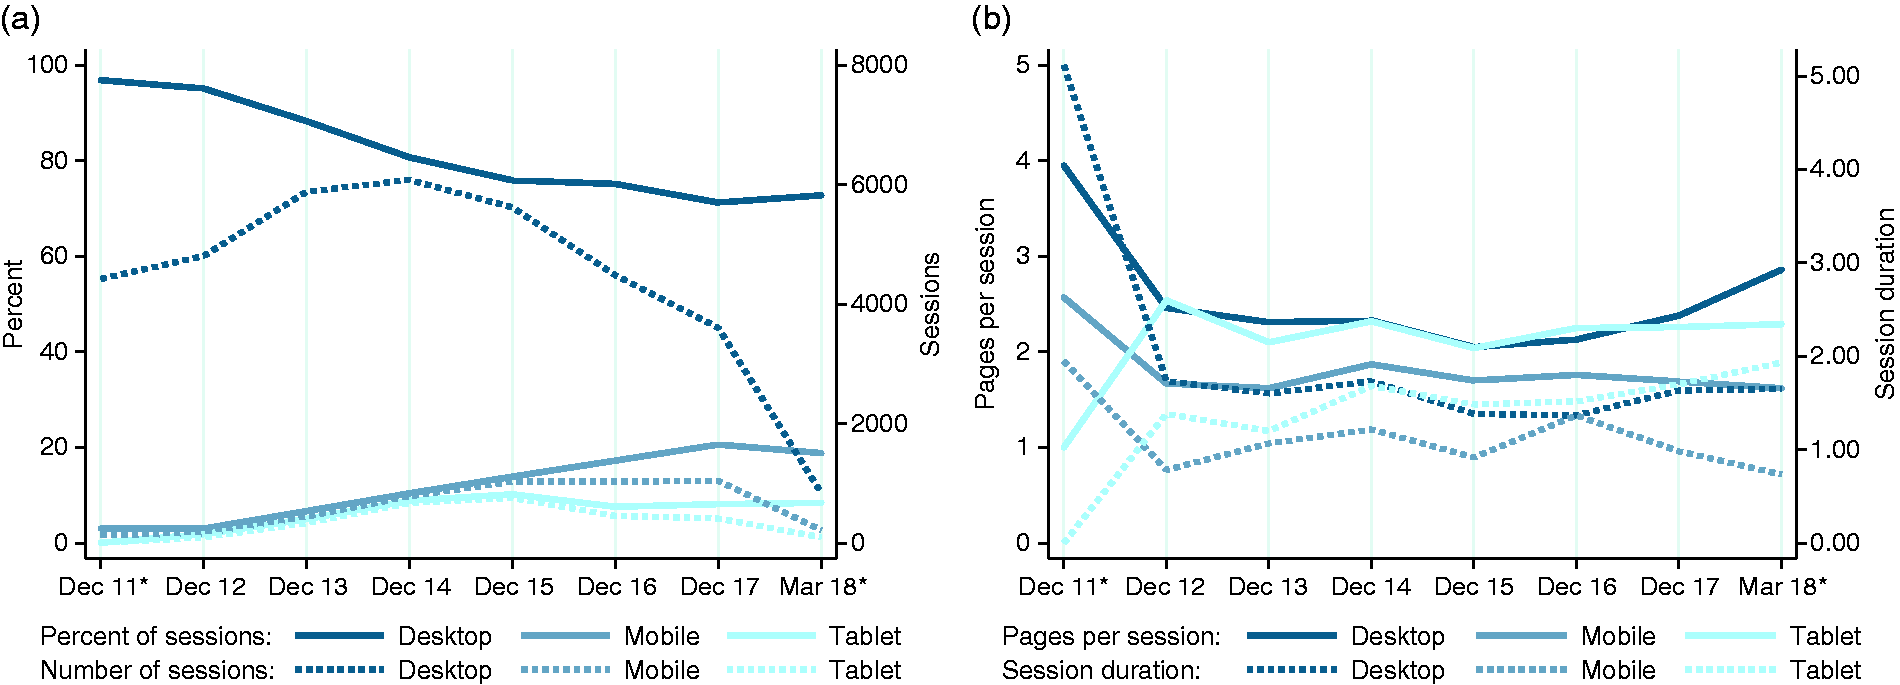
Trends in desktop, tablet, and mobile phone use of the web portal Praeventionsatlas.de: a) sessions by type of device, and b) pages and duration per session by type of device.
Organic search results, that is, search engine results pages that match the user's search query based on relevance not because they are paid advertisements, caused 61% of the sessions worldwide. Direct traffic led to 12% of the traffic, referring websites to 11%, and social networks to 0.3%. For 15% of the worldwide sessions, no detailed information was available.
How did users engage with the content?
Usage metrics of the web portal Praeventionsatlas.de for users within Berlin or Brandenburg.

*Partial year data. Data source: Google Analytics from August 30, 2011 to March 12, 2018 (monthly data are provided in supplementary Table S3).

User engagement with the web portal Praeventionsatlas.de: a) pageviews, sessions and users, and b) session characteristics and bounce rate.
Berlin–Brandenburg users, on average, viewed 2.4 pages per session from 2012 to 2017. An average session lasted 1.8 min. The average bounce rate was 57%, indicating that more than half of the users left the web portal directly from the landing page. In terms of user loyalty, 87% visited the website one time only. If tracking cookies were deleted from the device of a returning user, however, then this user was counted again as a new user.
Neither the yearly number of pageviews, nor the yearly number of sessions or users exhibited a linear trend over time (Figure 3(a)). Partly starting with global maximum values for the last months of 2011, these metrics reached local maximum values in 2014 and continuously decreased afterwards. The lowest annual numbers of pageviews, sessions and users in 2017 corresponded to a 30% to 40% reduction compared to the peak of user engagegment in 2014. The percentage of new sessions increased from 78% in 2011 to 88% between 2015 and 2017. The bounce rate reached its global maximum of 61% in 2015 (Figure 3(b)).
What information did users view?
The most frequently used feature of the web portal was the searchable database on health courses and projects (Figure 4(a)). Searches for prevention and health promotion activities accounted for 24,997 pageviews (45% of all pageviews) from 2012 to 2017. Viewing the pages with lists of providers was the second most used feature, accounting for 12,932 pageviews (23%). The start page (7,098; 13%) and pages with health tips (5634; 10%) were viewed more often than the page offering the download of a booklet with similar information (1457; 3.6%) or the remaining pages of the health portal (3429; 6.2%) regarding “help,” “contact,” and “about us.”
Relative interest in the activity search and the provider lookup increased over time. In turn, interest in other content remained similar or decreased over time (Figure 4(c)). Within the health tips pages only, the information on physical activity (3074; 55%) was viewed most often. User interest was substantially lower in the information on the remaining themes including stress management (1140; 20%), dietary health (989; 18%), and addiction (431; 7.6%). The topic of physical activity was the only theme for which the absolute number of pageviews and the relative share of pageviews within health tips increased in the initial years. Interest in viewing health tips, particularly in the remaining three themes of diet, stress, and addiction, decreased as early as 2012 (Figure 4(b) and (d)).
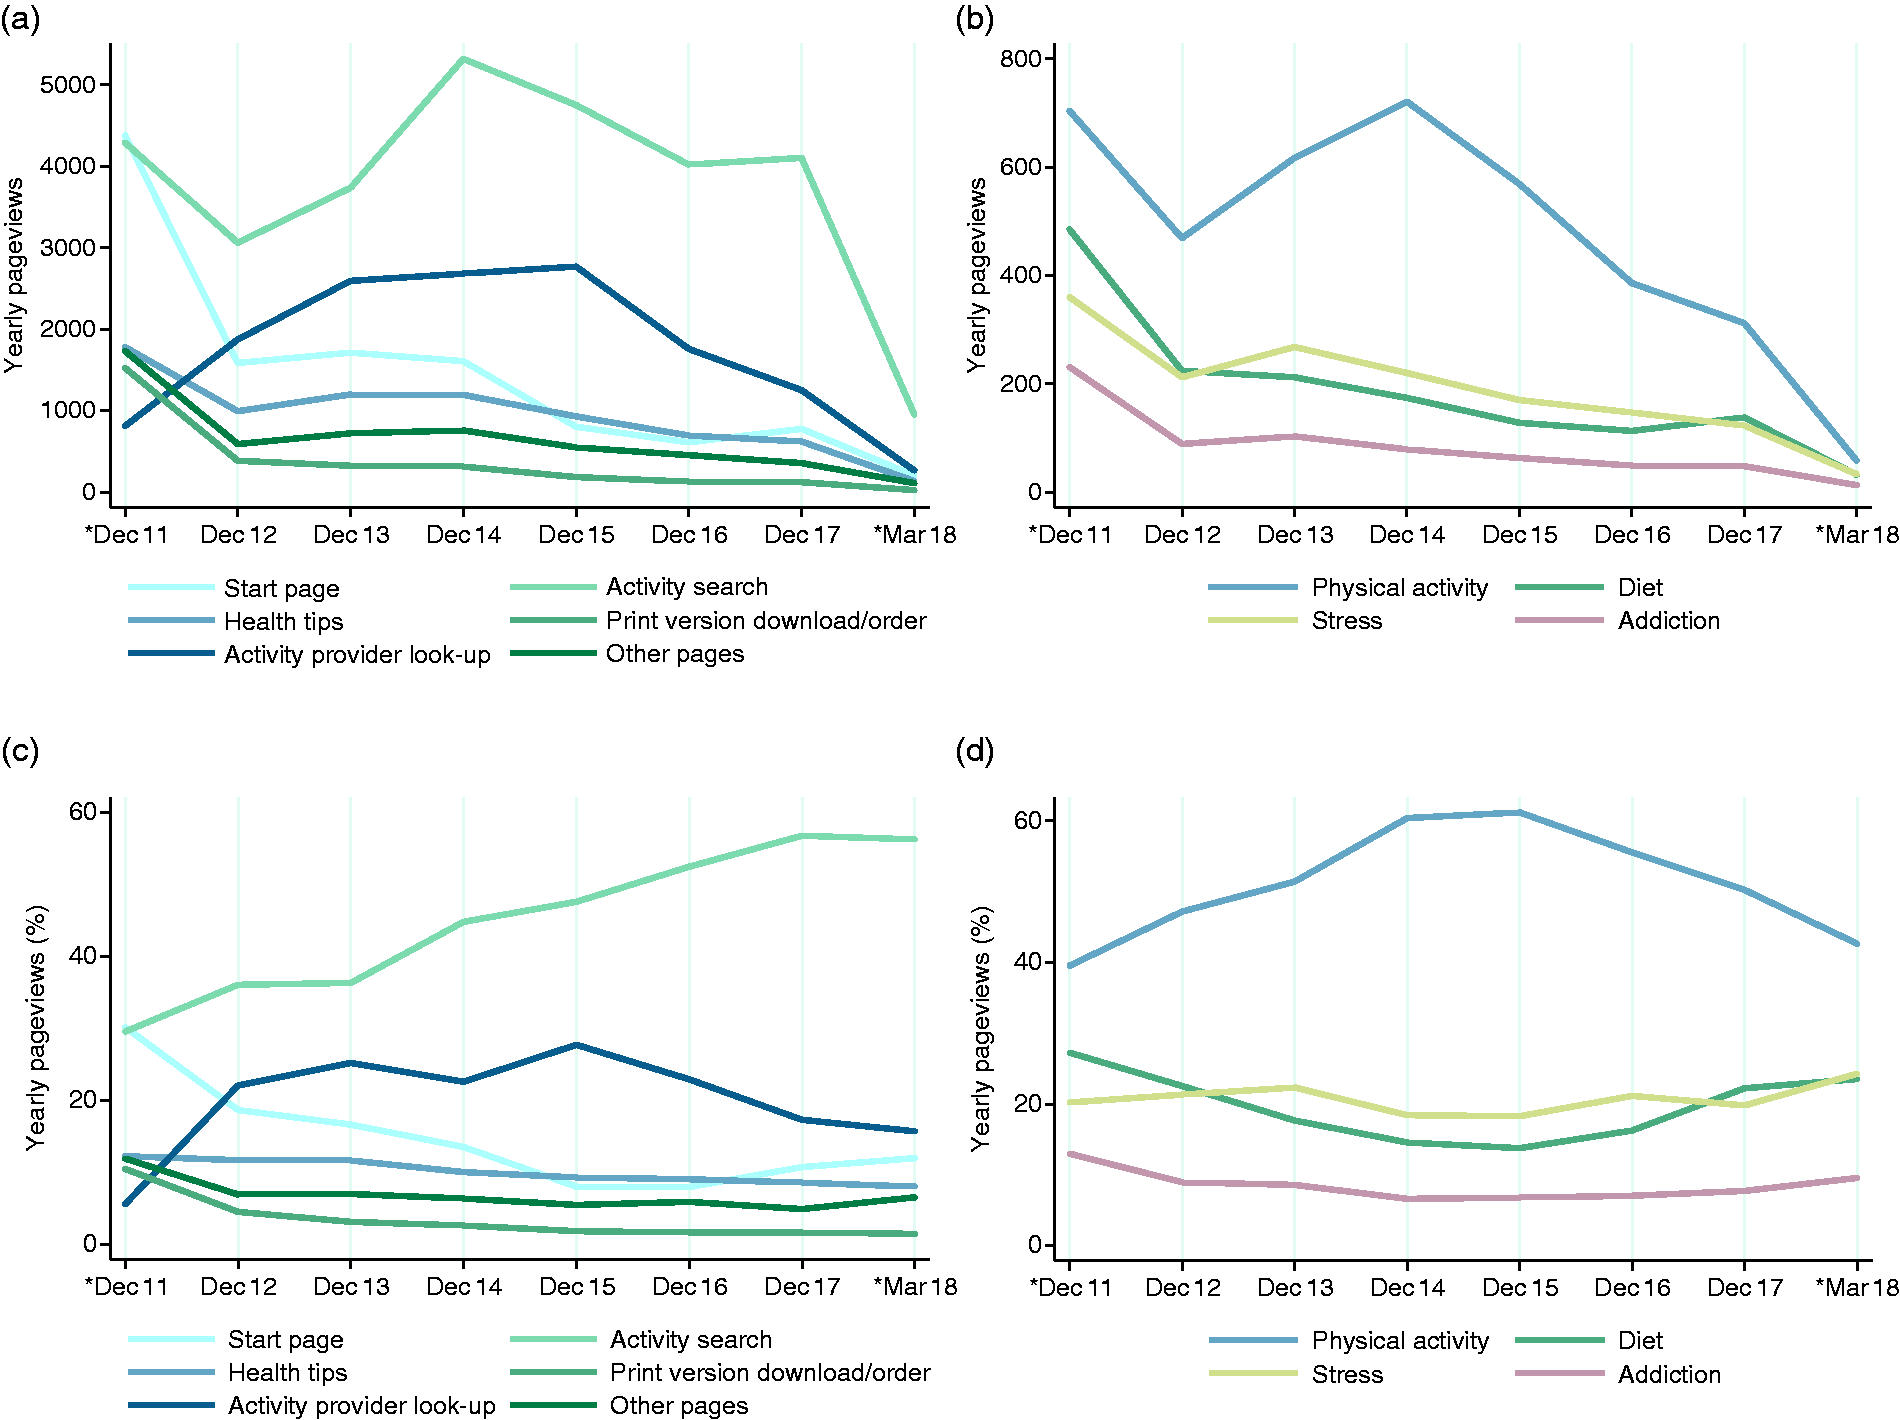
Users’ information seeking on the web portal Praeventionsatlas.de: a) distribution of pageviews, b) distribution of pageviews within health tips, c) distribution of pageviews (%), and d) distribution of pageviews within health tips (%).
When did users view content?
The monthly, weekly, daily, and hourly pageviews over the course of a year, week, or day, respectively are shown in Figure 5. On average, the fewest pageviews occurred in December and the most pageviews occurred at the beginning of the year, particularly in January. The average activity on the web portal was the lowest from April through August and increased during the autumn months before dropping to its December minimum. A spike in pageviews occurred during February 2014, the month when a second web portal for prevention and health promotion was launched in the city of Berlin (Figure 5(a)). Within the health tips pages, users’ interest in viewing pages about physical activity, a healthy diet, or stress management followed a similar seasonal trend. In contrast, interest in pages on addiction, the theme receiving the fewest pageviews within the health tips pages, on average, varied little over the course of a year (Figure 5(b)).

Temporal variation in information seeking behavior on the web portal Praeventionsatlas.de: a) by year and month, b) by theme and month, c) by year and day of the week, d) by theme and day of the week, e) by year and day of the week, and f) by theme and day of the week.
The daily number of pages viewed varied substantially over the course of a week. Daily pageviews were highest between Monday and Wednesday and lowest on Saturday and Sunday. On average, most pages were viewed on Wednesday and fewest on Saturday (Figure 5(c)). Within health tips only, interest in a healthy diet and physical activity was stronger earlier in the week with a peak on Tuesdays. Interest in viewing pages on stress management increased from Monday to Thursday, and interest in addiction was fairly constant during weekdays (Figure 5(d)).
Within an average day, the largest number of pageviews per hour occurred around lunchtime. On average, hourly pageviews decreased steadily from early morning until they peaked at noon. Within health tips only, peak interest occurred between 1 p.m. and 2 p.m. for the themes physical activity and stress. Tips about a healthy diet were, on average, viewed most often in the afternoon between 3 p.m. and 4 p.m. Pageviews on addiction started to increase later in the morning, and subsequently increased at a faster rate than pageviews on the other health tips. As a result, interest in viewing pages about the prevention and treatment of addiction peaked between noon and 1 p.m. (Figure 5(d) and (e)).
User engagement on the web portal during public holidays, religious festivals and the festive season
On an average day in the years 2012 to 2017, 25 (interquartile range: 13 to 34) pages of the web portal were viewed by users in the Berlin–Brandenburg region. The association of the number of daily pageviews with specific annual events, like the festive season, religious festivals, and public holidays, was assessed in a multivariable regression model. That model adjusted for the year, month, day, and hour as well as for the outlier month, February 2014, in which a second web portal on health promotion for the city of Berlin was launched (Table 2).
Association between daily pageviews and public holidays, religious festivals, or the festive season on Praeventionsatlas.de.

Data source: Google Analytics from January 1, 2012 to December 31, 2017.
Significantly fewer pages of the web portal were viewed during the major public holidays of Easter (−9; 95% CI: −12 to −6), Pentecost (−12; 95% CI: −18 to −7), Christmas (−12; 95% CI: −17 to −6) and New Year’s Eve and Day (−20; 95% CI: −25 to −15). The number of pageviews per day increased significantly during Lent (+6; 95% CI: +3 to +9) as well as in the middle of the week and at the beginning of a year. Pageviews were not associated significantly with Ramadan, Labor Day, or the Day of German Unity (October 3, the national day of Germany).
Short-run and long-run cost per pageview
The development, implementation, and dissemination of the second edition of the Prevention Atlas Berlin–Brandenburg (booklet and web portal) was funded with €30,041.91 in 2011 according to information disclosed by the Berlin House of Representatives. 13 Content and web portal development were responsible for approximately three quarters of the total expense, design and printing for one quarter. Attributing the costs for content and web portal development completely to the web portal and assuming negligible web portal design and operating costs, a rough lower bound of €0.33 for the average cost per pageview, from the perspective of the state governments in Berlin and Brandenburg, was estimated by dividing the one-off development costs incurred in 2011 by the total of 71,758 pageviews from within Berlin and Brandenburg during the years 2011 to 2018. Adjusting for the exceptionally high numbers of 11,045 pageviews and 2015 new users between August 30 and September 30, 2011, by assuming that only the 2012 to 2017 average number of 800 pageviews by 282 new users had occurred in 2011 (instead of the increased numbers of pageviews and new users following the relaunch) results in an adjusted total of 61,513 pageviews on Praeventionsatlas.de by 21,860 new users from within Berlin and Brandenburg over the life-cycle of the second edition of the web portal. The average cost estimated with adjusted total pageviews was €0.38 per pageview by the time the portal went offline. A rough upper bound of €1.67 per pageview by the end of the web portal's life-cycle was derived by dividing assumed development costs of €103,000 by the adjusted total pageviews on Praeventionsatlas.de. The latter amount, about four times the approximated expense of the Praeventionsatlas.de web portal, was budgeted by the city of Berlin in the years 2013 and 2014 for the development of its second health promotion portal.12,13
Figure 6(a) illustrates the relationship between the average cost per pageview and the cumulative number of pageviews over time. Figure 6(b) shows a similar relationship between cost and the cumulative number of new users reached through the web portal. Both average cost per pageview and average cost per new user follow an exponential decline. Per pageview, average cost decreased to €5.49 (€1.62 to €24.10) by the end of the year 2011. After a further 2, 4, and 6 years, the average cost per pageview continued to decrease to €1.02 (€0.7 to €4.47), €0.52 (€0.43 to €2.29) and €0.39 (€0.34 to €1.72), respectively. To further reduce the average cost to about half of their last estimate of €0.38 (€0.33 to €1.67) when the web portal went offline, that is, below €0.20, the web portal would have had to have been able to attract approximately 56,000 (46,000 to 453,000) more pageviews without causing operational costs or requiring investment in its content, software, or design. If the same number of pages as in 2017 were going to be viewed in the following years, too, then the average cost would have fallen below €0.20 per pageview in the year 2025 (2024 to 2080).

Cost of information seeking on the web portal Praeventionsatlas.de: a) average costs per pageview, and b) average costs per new user.
Discussion
Motivation for web portals on prevention and health promotion and their evaluation
NCDs are a growing burden globally, and part of this burden is due to modifiable risk factors.20,21 Urbanization, which is increasing worldwide, has been associated with an increase of several NCDs.22,23 At the same time, urban areas usually provide better health services and more opportunities to hear about and participate in health promotion activities than rural areas. Globally increasing Internet use and access might provide an important opportunity to reach people in urban as well as rural areas with information about health promotion and the prevention of NCDs. 1 Thus, web portals on health promotion can potentially play an important role in disease prevention, for instance, by helping people find health information and/or available health promotion activities.
The four health themes addressed in the Praeventionsatlas.de web portal (diet, physical activity, stress, and addiction) related to key lifestyle-related and modifiable risk factors of NCDs, namely, physical inactivity, an unhealthy diet, tobacco use, and harmful use of alcohol.20,24 Stress was considered by the web portal because it can aggravate unhealthy behaviors, such as overeating or eating unhealthy foods, smoking or drinking, or directly contribute to cardiovascular diseases.25–27
To share insights from the Praeventionsatlas.de health promotion portal, which was online for almost 10 years, this study assessed the usage, user behavior, and costs of information seeking over the full life-cycle (August 30, 2011, to March 12, 2018) of the second edition of the web portal.
Usage of web portal
By and large, the variations in users' engagement in the web portal over the day, week, and calendar exhibited a pattern that can be summarized as follows: interest in the web portal was highest in the middle of the day, in the middle of the week, and at the beginning of the year. The number of pages viewed by users visiting the health tips provided on the web portal varied most for the physical activity theme, which attracted most pageviews, and least for the theme of addiction, which attracted the fewest pageviews across all years. Pageviews relating to the themes diet and stress exhibited a medium amount of variation. The pages of the web portal where viewed most often in the months immediately after the relaunch of the web portal. The relaunch of the web portal was featured intensively in the regional media. Usage, when measured by the number of pageviews during a full calendar year, peaked after 3 years and fell to about 60% of its maximum after 6 years (7232 pageviews in 2017 versus 11,876 pageviews in 2014). Information seeking in the health promotion course and project database, which was a core feature, caused most pageviews throughout the web portal's life-cycle. At the time the database was created, the decision was made to include typical examples of courses and good practice examples of health promotion, rather than to include details or specifics of ongoing activities. The reasons for this were, on the one hand, the desire to provide information of mid- to long-term relevance and, on the other, an anticipated lack of resources for regularly updating a database of health activities. A long-lasting interest in the database search and an only slowly falling user base over several years suggest that the aim of creating long-term value despite a lack of resources for technical and content updates might have been achieved with the web portal.
A significant change during the web portal's life-cycle was the steady decrease in the share of web portal sessions attributed to desktop or laptop computer users. In turn, the proportion of web portal sessions attributed to tablet and mobile phone users increased (from 5% in 2012 versus 29% in 2017). The increased importance of mobile devices, particularly smartphones, for health promotion and health education is recognized and reflected in a large number of mobile health applications developed in recent years.28–30 At the time the Praeventionsatlas.de web portal was developed, usability of a web portal across device types was not anticipated, but providing a mobile-friendly user experience appears to have become a key component for reaching people with Internet-based health information.
The data on how users came to the web portal indicate that search engines played a crucial role in attracting visitors to the web portal: most sessions started after a referral from a search engine. The evaluated user acquisition data further suggest importance of the cross-media promotion of the Praeventionsatlas.de web portal through other channels, like the concomitant booklet or word-of-mouth:31,32 direct traffic (e.g., people typing in the website address because they had heard about it) and referring websites were jointly responsible for approximately one-fifth of all sessions in which users engaged with the web portal.
Notwithstanding how users came to the web portal, most users left the web portal after a single page view in all years after the launch year (average bounce rate of 57% from 2012 through 2017). This bounce rate of the Praeventionsatlas.de web portal appears similar to the bounce rate of other health, wellness, and fitness websites.33,34 However, a bounce rate is content-specific and comparability across websites is limited. For example, single-page sessions are likely whenever relevant content can be viewed on one page (e.g., a blog entry). On the other hand, if a page is a gateway to other content, then a high bounce rates suggests user dissatisfaction. Thus, singe-page views can be generated by users that were satisfied with the page they arrived on (i.e., they wanted to view only that page) as well as by users who were dissatisfied with their experience and, thus, left without viewing more than one page. Dissatisfaction could relate to the content as well as the technical experience, for instance, a slow-to-load page or a page not optimized for mobile device use.
We could not investigate the reason for users viewing a single page only, but we observed lower bounce rates for the start page, search page, and other overview pages than for pages with topical content, like search results for specific target groups, provider lists, or topical health tips. These differences in the bounce rate of the web portal support the interpretation that at least some users left the web portal after viewing a single page only because they were satisfied with the content viewed.
Cost and cost-effectiveness of the web portal
The web portal that we examined was one of two publicly funded web portals on prevention and health promotion for the Berlin–Brandenburg region in Germany. For both health portals, probably more than €125,000 of public funds were invested between 2011 and 2014. 13 Whether this was money well spent is an important yet difficult question to assess. Our study of the whole life-cycle of the health promotion portal Praeventionsatlas.de found that one pageview costed the two funding states, on average, €0.38 (€0.33 to €1.67).
In the UK, explicit thresholds between £20,000 and £30,000 (or €23,000 and €34,500 at an exchange rate of 1.15 € per £) per quality adjusted life-year (QALY) have been used to assess cost-effectiveness. 35 Assuming a cost-effectiveness threshold of €23,000 per QALY for Germany and the lower bound average cost per pageview of €0.33, the Praeventionsatlas.de web portal would have been cost-effective if approximately 1 in 70,000 pageviews caused a behavioral change in a user that resulted in gaining one additional QALY, for instance, through avoiding or alleviating later illness. As the portal received 71,758 pageviews in the Berlin–Brandenburg region over its life-cycle, it thus may have been cost-effective from the Berlin and Brandenburg state governments’ perspective if one QALY was gained in the region through the web portal that would not have been achieved spending the public funds invested in the Praeventionsatlas.de web portal differently. For the second health promotion portal (Berlin), 12 which was online from 2014 to 2017 only, a budget about fourfold the approximated cost of the Praeventionsatlas.de web portal has been reported. 13 Given these higher costs, the second health promotion portal would have had to result in a gain of 4.5 QALYs over its shorter life-cycle to be considered cost-effective at a €23,000 per QALY threshold.
Strengths and limitations
We are not aware of other studies reporting on long-term user behavior on a health promotion portal or on the cost and cost-effectiveness of reaching users with web-based information on health promotion. Hence, the described results help build and share knowledge about health portals, which have become a frequently used but potentially costly health tool.
Learning from the experience of the Praeventionsatlas.de web portal is limited by the fact that it was a custom-designed health intervention. Described usage and user behavior may therefore have been driven by the specific content of the web portal rather than by generic principles. Regarding data quality, new users were identified with error as deletion of cookies, use of a virtual private network, or use of a new device or different browser without cookie-transfer resulted in returning users being classified as new users by GA. Furthermore, a probably small but unknown amount of research- or service-oriented page visits were also measured. Within the costing study, neither costs for web design nor operating costs, such as costs for website hosting, domain registration, or minimal updates, were considered, but these costs were likely small in comparison to the budget that funded the content and technical development of the web portal.
Despite the limitations, the reported use of the Praeventionsatlas.de web portal and the estimated average cost per pageview over the life-cycle of the web portal could be typical for small-scale web portal projects that are promoted in a community or region through local media and networks. While the Praeventionsatlas.de web portal has been discontinued, the results of this study may thus offer guidance for planning and improving other Internet-based health promotion and disease prevention tools.
Conclusions
Web portals are a frequently used health tool and have the potential to reach numerous people over many years. At the same time, development and updating of a web portal may require substantial financial investment. The pages of the second edition of the Praeventionsatlas.de web portal have been viewed more than 70,000 times during its 6.5 year life-cycle. Average cost per pageview decreased quickly at first, then slowly and were estimated at €0.38 (€0.33 to €1.67) by the end of the web portal’s life-cycle in 2018. We conducted a back-of-the-envelope cost-effectiveness analysis and found that the Praeventionsatlas.de web portal may have been cost-effective if web portal users gained one additional QALY that would not have been achieved with the alternative use of the public funds spend on the web portal. The cost-effectiveness of other health portals may be lower (higher) than the one estimated for the Praeventionsatlas.de web portal if, other things being equal, other web portals' user base is smaller (larger), their life-cycle is shorter (longer), their costs are higher (lower), or their health impact is smaller (larger).
Supplemental Material
DHJ872090 Supplemental Material - Supplemental material for Usage of a German prevention and health promotion web portal and cost per pageview: A life-cycle assessment
Supplemental material, DHJ872090 Supplemental Material for Usage of a German prevention and health promotion web portal and cost per pageview: A life-cycle assessment by Stefan Kohler, Thomas Keil, Thomas Reinhold, Falk Müller-Riemenschneider, Stefan N Willich and Stephanie Roll: for the ALICE (All-Literature Investigation of Cardiovascular Evidence) Group in Digital Health
Footnotes
Conflict of interest
The authors declare following potential conflicts of interest with respect to the research, authorship, and/or publication of this article: SK, FMR and SW were funded for developing the content of the second edition of the Prevention Atlas Berlin–Brandenburg by the Cluster Gesundheitswirtschaft Berlin-Brandenburg – HealthCapital.
Contributorship
SK conceived the study, performed data analysis, lead the interpretation of results, and drafted and revised the manuscript. SR participated in the development of the study, interpretation of the results and writing of the manuscript. TK, TR and FMR contributed to the development of the study, interpretation of results and final manuscript. SW and FMR acquired funding for developing the content of the second edition of the Prevention Atlas Berlin-Brandenburg. All authors read and agreed to the final version of the manuscript.
Ethical approval
Ethical approval was not required for this study.
Funding
The author(s) received no financial support for the research, authorship, and/or publication of this article.
Guarantor
SK
Peer review
This manuscript was reviewed by an individual who has choose to remain anonymous.
Supplemental material
Supplemental material for this article is available online.
References
Supplementary Material
Please find the following supplemental material available below.
For Open Access articles published under a Creative Commons License, all supplemental material carries the same license as the article it is associated with.
For non-Open Access articles published, all supplemental material carries a non-exclusive license, and permission requests for re-use of supplemental material or any part of supplemental material shall be sent directly to the copyright owner as specified in the copyright notice associated with the article.