
Abstract
Background:
Kidney transplantation is the optimal treatment for patients with end-stage renal disease; however, long-term outcomes remain suboptimal.
Objective:
The objectives of our study were to examine the variation in survival rates and determine whether center volume and case mix are associated with transplant outcomes and explain the variation across kidney transplant centers in Ontario, Canada.
Design:
This was a population-based cohort study using health care administrative databases.
Setting:
A total of 5 transplant centers across Ontario, Canada.
Patients:
We included adults (≥18 years) undergoing primary, solitary kidney transplantation between January 1, 2000 to December 31, 2013.
Measurements:
The co-primary outcomes were death-censored graft loss and total mortality.
Methods:
Multivariable Cox proportional hazards regression was used to assess potential associations and describe variation, using hazard ratios (HRs) with 95% confidence intervals (CIs) for each center relative to the average across all centers.
Results:
The study cohort included 5037 patients followed for a median of 5.3 years, interquartile range (2.7-8.6). In multivariable models, recipient age, body mass index, Charlson Index, time on dialysis, donor type, and age were found to be significantly associated with death-censored graft loss, and recipient age and sex, Charlson Index, time on dialysis, donor age, and time era of transplant were associated with total mortality. There was statistically significant variation across centers observed for death-censored graft loss (P = .04) with HRs ranging from 0.72 to 1.22. However, neither adjusting for case mix nor center volume meaningfully changed the HRs reflecting each center-specific effect. There was a tendency toward reduced risk of graft loss (HR, per additional 25 patients, 0.90 [95% CI, 0.78-1.04]) in centers with higher volumes. For total mortality, there was statistically significant variation across centers with HRs ranging from 0.82 to 1.13 (P = .04); however, neither adjusting for case mix or center volume meaningfully changed the HRs. Center volume was not significantly associated with total mortality (HR, per additional 25 patients, 1.04 [95% CI, 0.90-1.20]).
Limitations:
This study was limited by the small number of centers included.
Conclusions:
Outcomes differ across the 5 transplant centers in Ontario. We did not find any strong support for our hypotheses that case mix or center volume is responsible for these differences.
What was known before
Short-term graft and patient-survival rates have improved since the introduction of newer immunosuppressive therapies. Center variation in kidney transplantation outcomes has been described; however, potential contributing center factors have not been studied well.
What this adds
This is the first Canadian study to examine center variation after kidney transplantation in a cohort of patients who were transplanted exclusively beyond the year 2000 who had up to 10 years of follow-up.
Introduction
Between-center variation in graft and patient-survival rates have been observed in studies from the United States,1-3 Canada, 4 and Europe.5-7 Specific methods that have been applied to measure and compare center outcomes in kidney transplantation include descriptive analyses such as Kaplan-Meier survival curves or cumulative incidence as well as comparative analyses including standardization and regression modeling.8,9 In the United States, program-specific report cards for each transplantation center are published every 6 months by the Scientific Registry of Transplant recipients. 10 This report card includes both unadjusted survival rates as well as an adjusted standardized ratio of the observed to expected events (graft losses and deaths) for each center compared with the national average.11-14 The standardized ratios use Cox regression modeling to incorporate the effect of different important patient covariates on the outcome as well as to calculate the expected number of events.15,16 This method ensures that a transplant center is not unnecessarily penalized due to the type of patient population it serves.
While the role of patient characteristics (both recipient and donor) at the time of transplant have been well examined,1,2,4,5,7,17 center-level factors which may contribute to variation have not been extensively examined. To date, studies examining center-level factors, including center volume3,4,17-21 and center type22,23 (eg, for profit or teaching hospital), have found conflicting results. Many of the studies that assessed the center volume–outcome relationship included patients transplanted before 2001,1,3,4,17,19-21 which may be less relevant, given changes in practice over time.
The objectives of this study are to compare the graft and patient survival rates across 5 transplant centers in Ontario, Canada, to determine if center volume is associated with transplant outcomes and to determine whether center volume explained center variation after accounting for case mix. An additional objective was to determine whether the provider characteristics such as type of provider and provider experience are associated with graft and patient outcomes and contribute to center variation. We hypothesized that higher center volume would be associated with improved graft and patient survival.
Methods
Study Design and Setting
We conducted a population-based retrospective observational cohort study using health care databases at the Institute for Clinical Evaluative Sciences (ICES) in Ontario, Canada. Ontario has a population of approximately 13.6 million residents who have universal access to health care services. There are currently 6 kidney transplant centers in Ontario, Canada. The use of data in this project was authorized under section 45 of Ontario’s Personal Health Information Protection Act, which does not require a review by a research ethics board. The reporting of this study followed the Strengthening the Reporting of Observational Studies in Epidemiology and Reporting of Studies Conducted using Observational Routinely-Collected Health Data reporting guidelines.24,25 The full data set creation plan and underlying analytic code are available from the authors upon request, understanding that the programs may rely on coding templates or macros that are unique to ICES.
Data Sources
We used 4 linked data sets to create the cohort and to obtain patient, center, provider, and outcome data as previously described. 26 These data sets were linked using unique encoded identifiers and were analyzed at the ICES. We used the Canadian Organ Replacement Register (CORR) to identify kidney transplant recipients as well as determine certain patient-level characteristics. The CORR’s sensitivity to correctly identify kidney transplant recipients is 96% and positive predictive value is 98%. 27 Demographic and vital status of kidney transplant recipients were obtained using the Ontario Registered Persons Database. The Canadian Institute for Health Information Discharge Abstract Database and the Ontario Health Insurance Plan (OHIP) were used to obtain information on recipient comorbidities and outcomes. These were determined using codes that were similar to those used in previous kidney transplant studies (Supplemental Table S1).27-29
Study Cohort
The creation of this study cohort has been previously described. 26 In brief, we included all adults (≥18 years) who received a first-time solitary kidney transplant in Ontario, Canada, between January 1, 2000 and December 31, 2013. We excluded those with an invalid ICES key number (IKN; a confidential ICES patient number), or who were not from Ontario, died before transplant date, had unknown age or sex, and whose OHIP transplant billing or hospitalization dates did not align with transplant date (Supplemental Figure S1). For this study, we excluded a center due to the small volume of transplants performed over the study period (n = 55).
Definition of Patient, Center, and Provider Characteristics
Transplant recipients were classified by the center at which their transplant occurred using the CORR facility code number. Information on the transplant center was obtained using CORR and OHIP. The surgical transplant fee code has been validated for identifying kidney transplant recipients. 23
Outcomes
Patients were followed from the date of transplant until March 31, 2015. The co-primary outcomes were death-censored graft loss and total mortality. Total mortality included any death that occurred during follow-up, even if after the allograft had failed.
Statistical Analysis
We used descriptive statistics to summarize characteristics of patients at the time of transplant by center and by the entire cohort. Continuous variables were described using mean and standard deviation (SD) when the data followed a normal distribution or median and interquartile range if skewed. Frequencies and percentages were used for categorical data.
To describe the distribution of center volume over time, we categorized the study period into 3 eras: the first time period was from January 1, 2000 to December 31, 2004; the second was from January 1, 2005 to June 30, 2009; and the third was July 1, 2009 to December 30, 2013. Distribution of center volume within each time era was compared across centers using the chi-squared test. The 1-, 5-, and 10-year survival distributions were described per center using the Kaplan-Meier method, and statistical significance of differences across centers was assessed using the log-rank test.
To statistically examine variation in outcomes across transplant centers, while accounting for differences in patient case mix, we used the fixed-effects multivariable Cox proportional hazards regression. Fixed-effects modeling was used because of the limited number of centers available for analysis (ie, 5). We first calculated unadjusted center hazard ratios (HRs) for both co-primary outcomes (death-censored graft loss and total mortality). To account for differences in patient case mix, we obtained adjusted HR with 95% confidence intervals (CIs) for each transplant center, using effects coding to express differences relative to the average across all centers. The statistical significance of differences across centers was examined using Wald tests. We adjusted for the following patient case mix factors: recipient age, sex, race (categorized Caucasian, African, Asian compared to other) cause of end-stage renal disease (ESRD), body mass index (BMI), Charlson Comorbidity Index, pretransplant dialysis modality (none vs hemodialysis or peritoneal dialysis), years on dialysis before transplantation, era of transplant (as defined previously), donor source (living vs deceased), and donor age. Centers having HRs with both upper and lower confidence limits less than 1 imply that the center has a survival rate significantly better than the average after accounting for patient case mix, while HRs for centers with both limits greater than 1 imply that the center is performing significantly worse than the average. On the contrary, centers with CIs including 1 have a survival rate that is not significantly different than the average after accounting for patient case mix.
To statistically examine whether center volume explained any additional variation in outcomes across transplant centers, after accounting for differences in patient case mix, we then added center volume to the Cox regression models. We examined the statistical significance of center volume as an independent predictor of outcomes in these models, as well as the extent to which the differences in center-specific HRs are attenuated through the addition of center volume. In these models, center volume was defined as the total number of transplants performed at a given center in the calendar year prior to a patient’s transplant. Center volume was specified as continuous variables to avoid losing meaningful information and power through categorization. 30 To interpret the resulting HRs in a clinically relevant manner, HRs for volume were expressed in units of 25 transplants performed. While we wanted to examine the association between provider characteristics and transplant outcomes, this was not possible because there was not one specific provider who was most responsible for the patient’s care.
Data were missing for the following variables: recipient race (10.0%), cause of ESRD (7.9%), Charlson Comorbidity Index (5.5%), BMI (16.9%), donor type (0.75%), and donor age (0.75%). Before analysis, we performed a multiple imputation using the fully conditional specification method which does not assume a joint distribution for all variables in the imputation model but instead applies a separate conditional distribution for each of the variables to be imputed. 31 For categorical variables, we used the discriminant method and for continuous variables, linear regression. We conducted 10 imputations using 100 burn-in iterations. Multivariable analyses were conducted for each imputation data set and combined across data sets using Rubin’s rules. 32 All statistical analyses were performed using SAS (Statistical Analysis Software) version 9.4 (SAS Institute, Cary, NC). A 2-sided P value < .05 was considered statistically significant.
Results
Patient, Center, and Provider Characteristics at the Time of Transplant
The study included 5037 primary kidney transplant recipients from 5 transplant centers in Ontario. The mean (SD) age of the overall cohort was 50.9 (13.5) years, 63.1% were male and 63.4% were Caucasian (Table 1). The characteristics of the transplant population across centers have previously been reported. 26 The percentage of different ethnic groups did vary significantly by center. For example, the total percentage of Caucasians transplanted at a given center ranged between 47.8% and 79.4%, whereas total percentage of Asians ranged between 2.5% and 13.1%. The annual transplant volume varied by transplant center and time era of transplant (Table 1).
Participant Characteristics at the Time of Kidney Transplant (n = 5037).

Note. ESRD = end-stage renal disease; BMI = body mass index; IQR = interquartile range.
Total number for deceased also includes those with missing donor type.
The first time period is 5 years, and the second two are 4½ years.
Observed Survival Rates
Outcomes—Death-censored graft loss and total mortality
Over the study period, 807 (16.0%) patients experienced graft loss, and there were 921 (18.3%) deaths. The overall observed death-censored graft-survival rates ranged between 75.8% and 85.8% at 10 years after transplantation and differed significantly across centers (log-rank P = .001; Table 2). The overall observed patient survival rates ranged between 67.5% and 76.7% at 10 years after transplantation and varied significantly across centers (log-rank P < .0001; Table 2; Figures 1 and 2).
Death-Censored Graft Loss and Patient-Survival Rates Across Centers at 1, 5, and 10 Years After Transplantation.

Overall P = .001.
Overall P < .0001.

Death-censored graft-survival curves by center.

Patient-survival curves by center.
Unadjusted and Adjusted Hazard Ratios
Outcomes—Death-censored graft loss and total mortality
Results from the multivariable Cox proportional hazards regression analyses for death-censored graft loss are presented in Table 3. Center-specific HRs and 95% CIs obtained from these analyses are displayed graphically in Figure 3, showing variation across centers before adjusting for patient case mix, and then after adjusting for patient case mix alone, and patient case mix plus center volume. The results showed that raw center-specific HRs for death-censored graft loss varied significantly across centers (P = .001), from a minimum of 0.76 to a maximum of 1.24 (Figure 3A). Patient case mix factors found to be significantly associated with death-censored graft survival in multivariable models were recipient age, BMI, Charlson Index, pretransplant time on dialysis, donor type, and donor age. While in univariate (unadjusted models) for the outcome death-censored graft loss being of African ethnicity had worse graft survival, HR 1.37 (1.01-1.84), compared to the reference group, in the multivariable models, this finding was no longer significant. After accounting for patient case mix, differences across centers still ranged substantially from 0.78 to 1.18. Center volume was not statistically significantly associated with graft loss (HR = 0.90; 95% CI, 0.78-1.04).
Center-Specific Patient Hazard Ratios From Multivariable Cox Proportional Hazards Regression Analysis for Graft Loss Censoring at Time of Death Over Full Follow-Up (Total Number of Events = 807).

Note. HR = hazard ratios; CI = confidence interval; ESRD = end-stage renal disease; GN = glomerulonephritis; RVD = renal vascular disease; BMI = body mass index.
Other includes Aboriginal, Indian subcontinent, Pacific Islander, other/Multiracial.
Pretransplant dialysis includes both peritoneal dialysis and hemodialysis.
Center—the reference is the average across all centers.
Center variation in death-censored graft loss: (A) unadjusted hazard ratios comparing each center versus the average; (B) hazard ratios comparing each center versus the average after adjusting for patient case mix; and (C) hazard ratios comparing each center versus the average after adjusting for patient case mix and center volume.
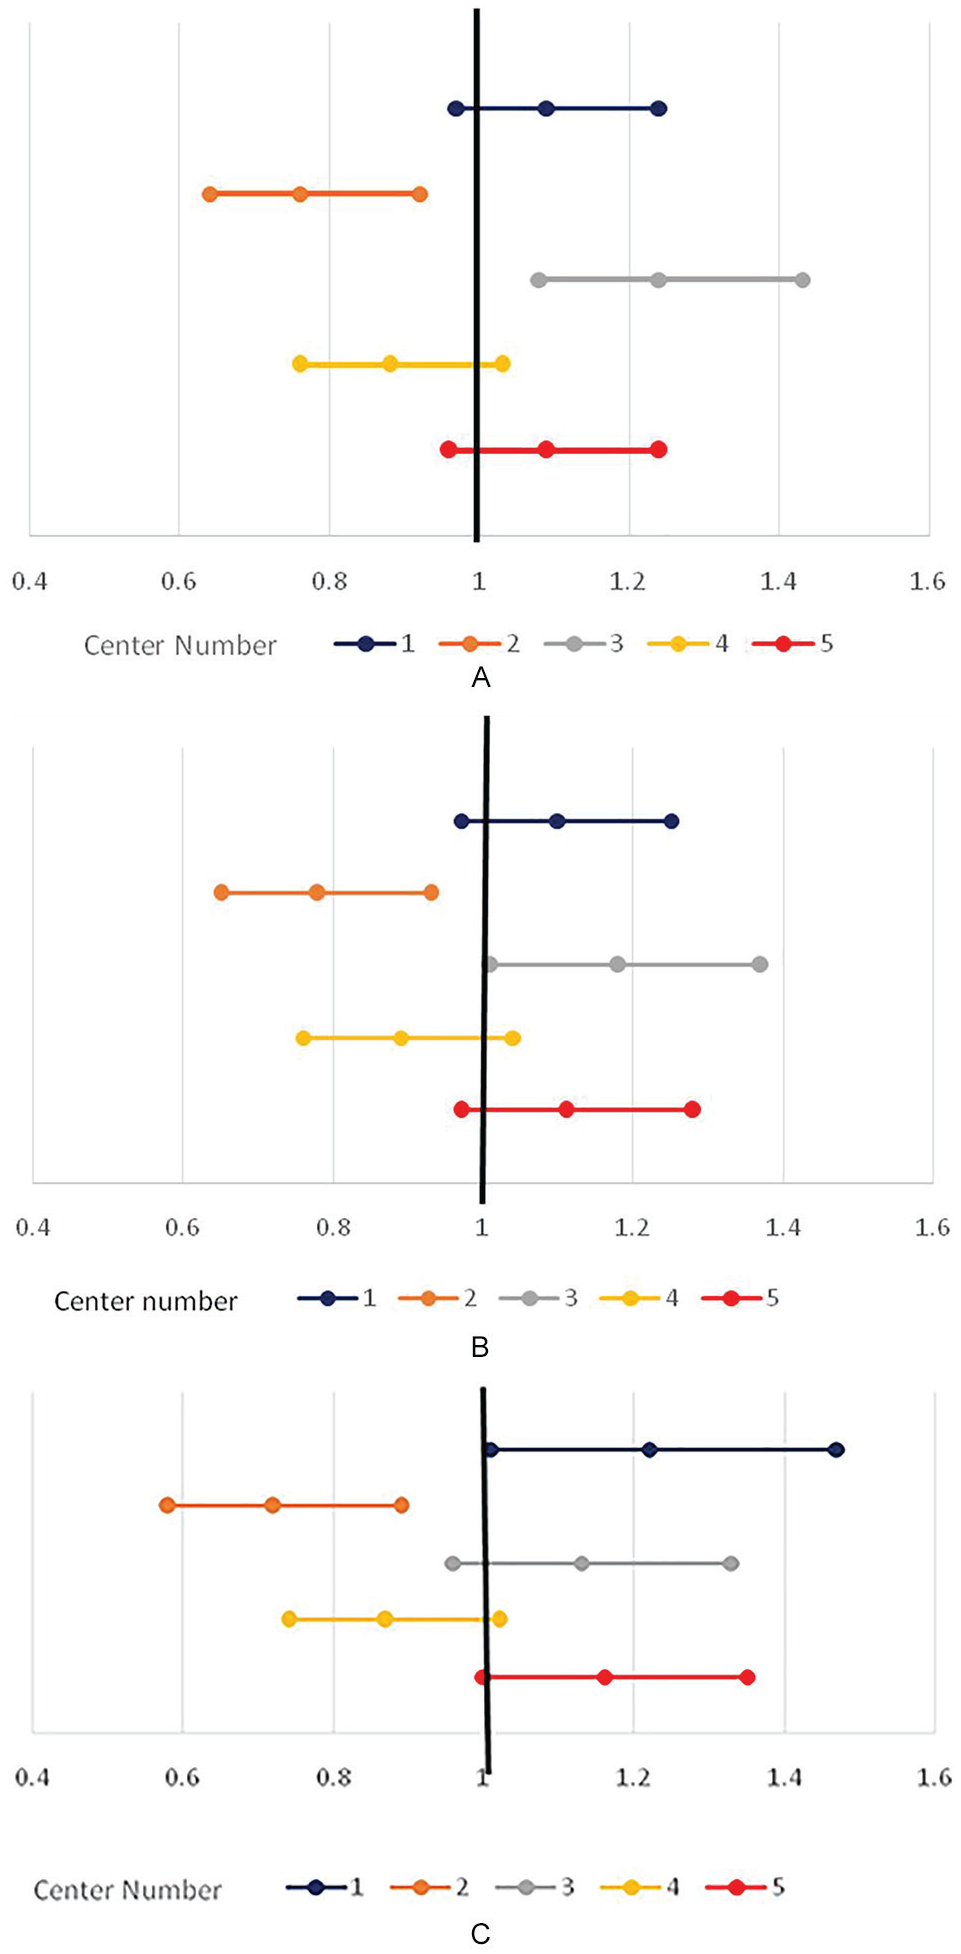
Results from the multivariable Cox proportional hazards regression analyses for total mortality are presented in Table 4. Center-specific HRs and 95% CIs obtained from these analyses are displayed graphically in Figure 4, showing variation across centers before adjusting for patient case mix, and then after adjusting for patient case mix alone, and then patient case mix plus center volume. The results showed that raw center-specific HRs for total mortality varied significantly across centers (P < .0001) from a minimum of 0.82 to a maximum of 1.16 (Figure 4A). Two centers were significantly lesser and the other 2 were significantly more than the average for all centers. From the multivariable models, patient case mix factors found to be significantly associated with total mortality were recipient age and sex, Charlson Index, time on dialysis pretransplant, donor age, and time era of transplant. In univariate (unadjusted models), being Caucasian had worse patient survival HR 1.41 (1.12-1.77) compared to the reference group. The results were similar in multivariable models (with being Caucasian associated with worse survival), although the overall P value for race was nonsignificant. After accounting for patient case mix, differences across centers still ranged from 0.85 to 1.11 (P = .01). Center volume was not statistically significantly associated with total mortality (HR = 1.04; 95% CI, 0.90-1.20; Table 4). After adjusting for center volume, center-specific HRs ranged from 0.82 to 1.13 and remained statistically significantly different (P = .04).
Center-Specific Hazard Ratios From Multivariable Cox Proportional Hazards Regression Analysis for Total Mortality Over Full Follow-Up (Total Number of Events = 915).
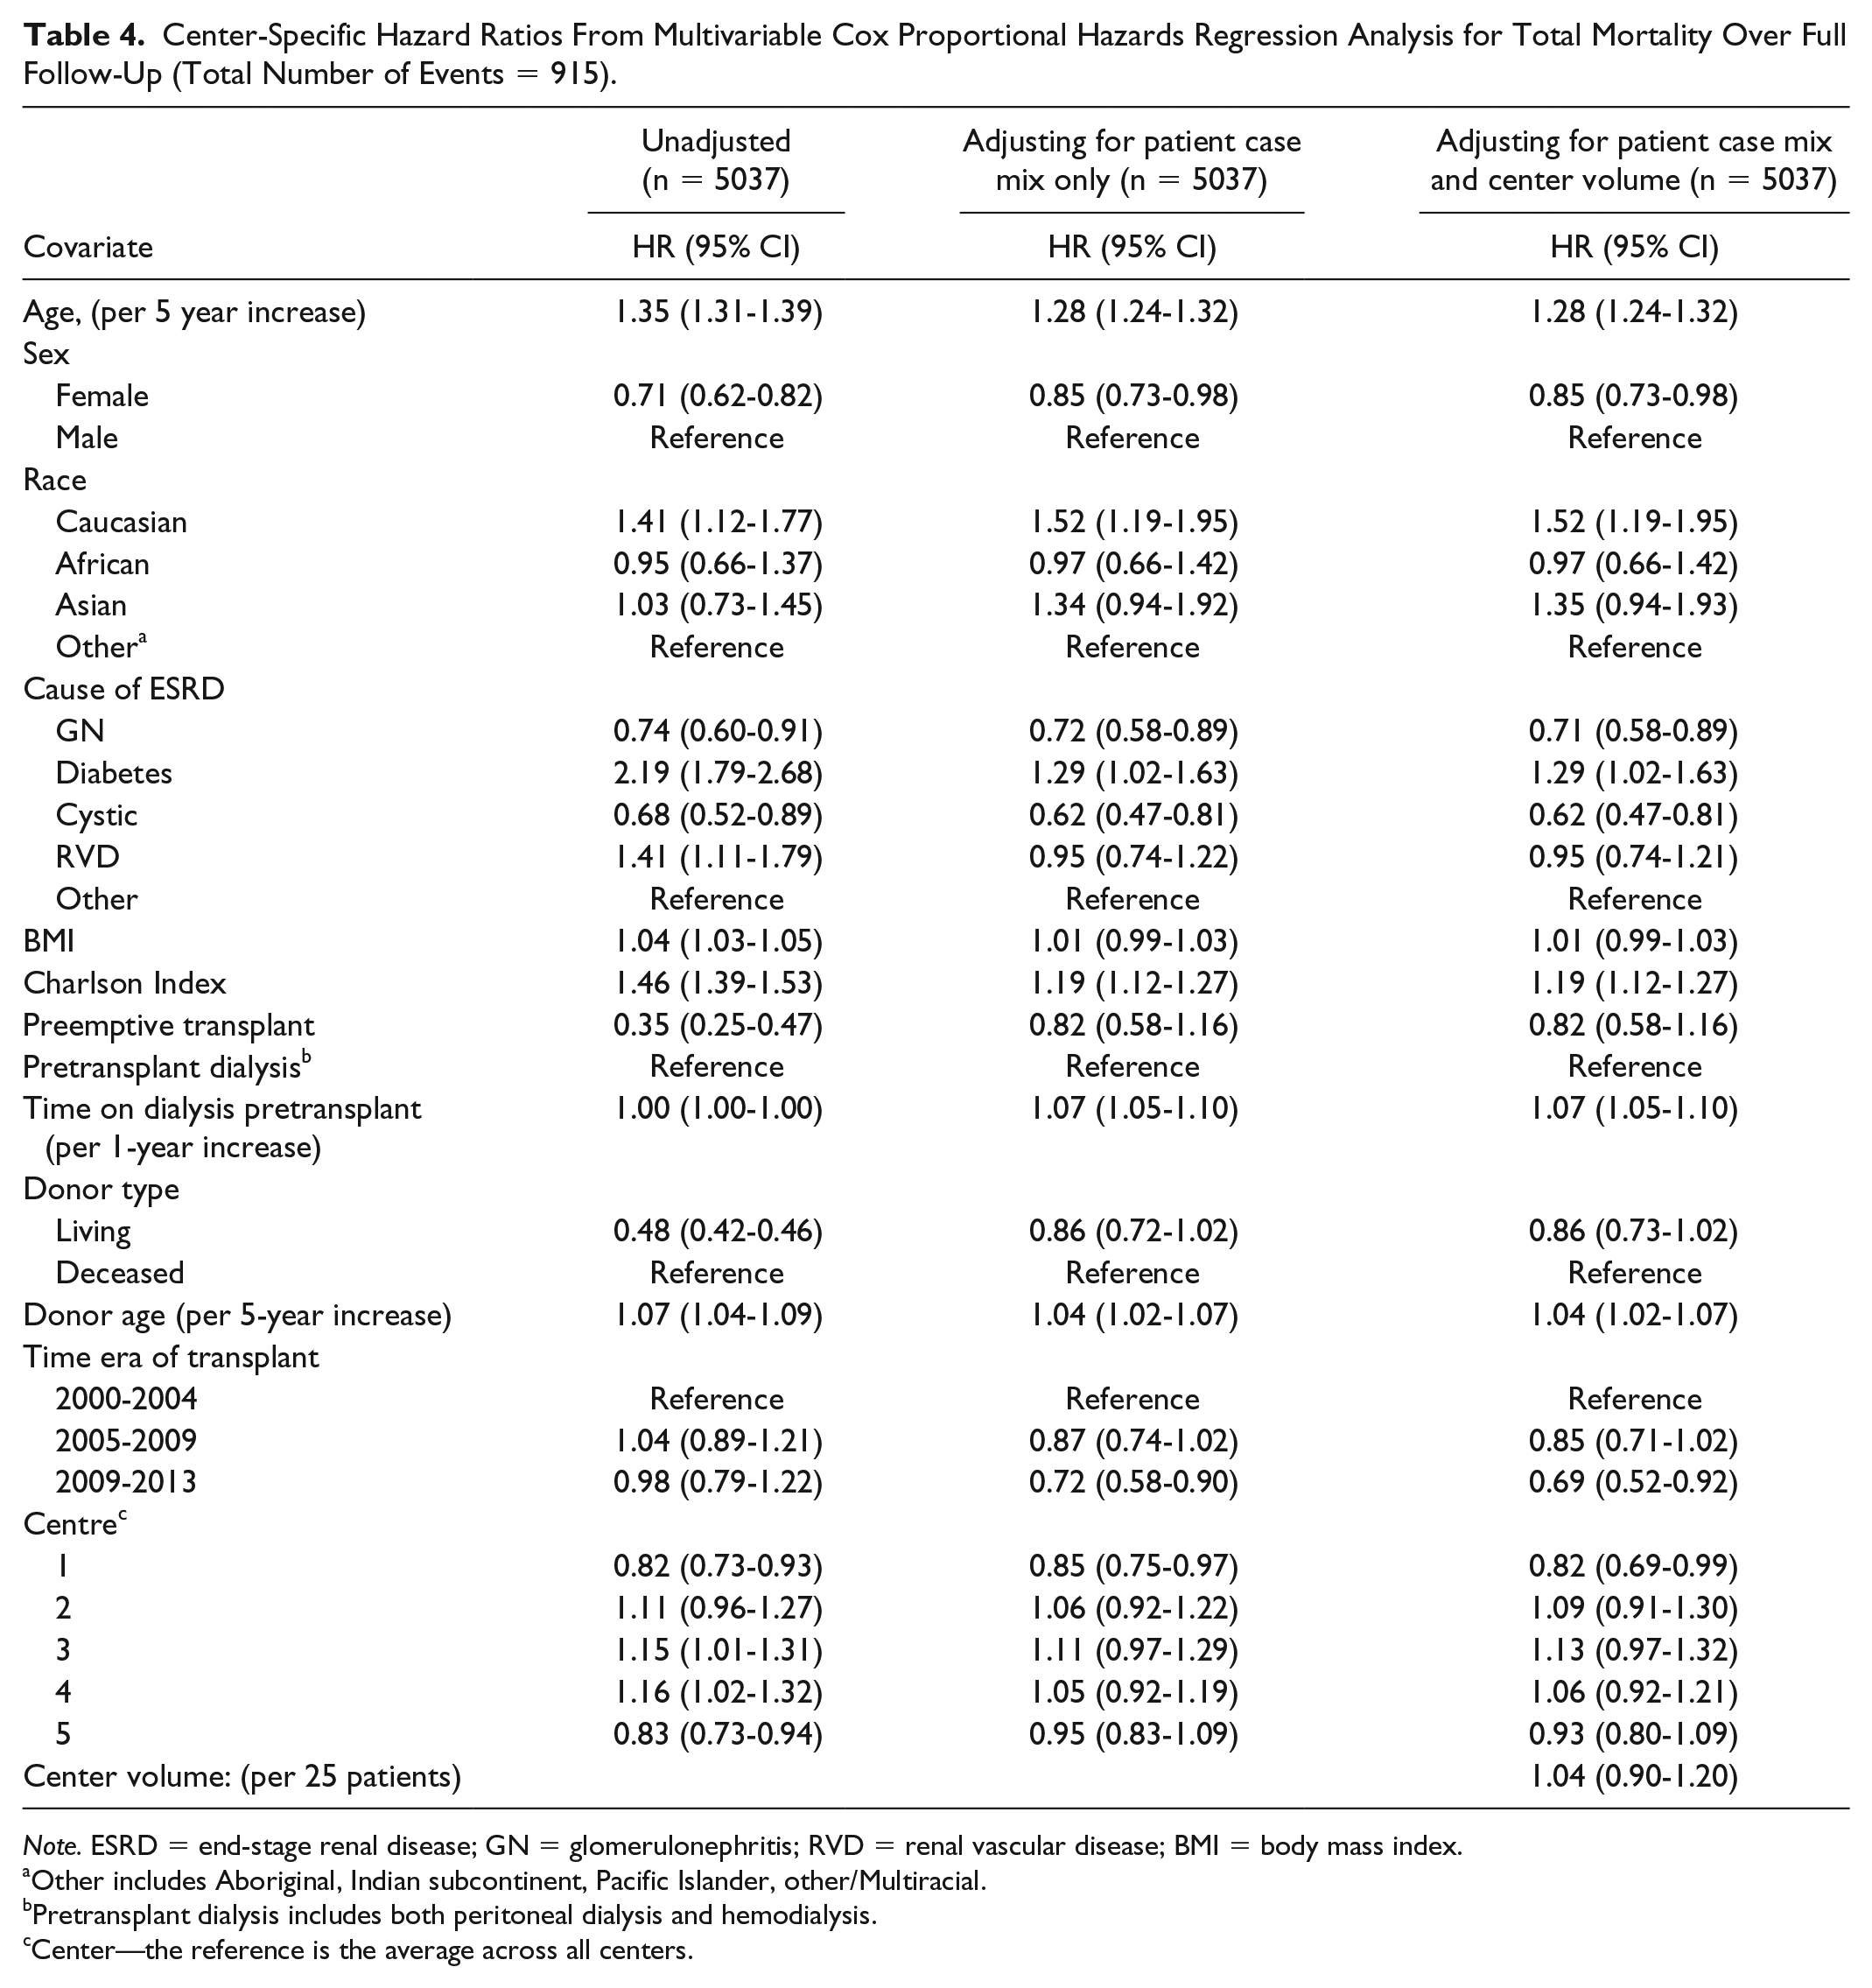
Note. ESRD = end-stage renal disease; GN = glomerulonephritis; RVD = renal vascular disease; BMI = body mass index.
Other includes Aboriginal, Indian subcontinent, Pacific Islander, other/Multiracial.
Pretransplant dialysis includes both peritoneal dialysis and hemodialysis.
Center—the reference is the average across all centers.

Center variation in total mortality: (A) unadjusted hazard ratios comparing each center versus the average; (B) hazard ratios comparing each center versus the average after adjusting for patient case mix; and (C) hazard ratios comparing each center versus the average after adjusting for patient case mix and center volume.
Discussion
Our study found statistically significant center variation in the co-primary outcomes death-censored graft loss and total mortality across 5 Ontario kidney transplant centers even after adjusting for patient case mix and center volume. Additionally, there were clinically significant differences in the adjusted HRs across centers. For example, the risk of death-censored graft loss, after adjusting for all covariates, was close to 30% lower than the average at one center (HR = 0.72; 95% CI, 0.58-0.89) compared with 20% higher than the average at another center (HR = 1.22; 95% CI, 1.01-1.47). While CIs were wide, they were indicative of important differences across centers.
These results are similar to what was previously found in a Canadian study by Kim et al, 4 which included 5082 participants transplanted across 20 Canadian centers between 1988 and 1997. Their study found significant variation in facility-specific covariate-adjusted HRs for both total graft survival as well as total mortality. Other studies,5,7,17 which have also compared center outcomes, have found conflicting results. Briganti et al 17 found significant variation in graft-survival rates across 16 transplant centers in Australia when using a fixed-effects multivariable Cox proportional hazards regression model; however, when hierarchical modeling treating center as random effects was used, there was no longer a significant difference in the outcome. Elinder et al 7 describe nonsignificant variation in graft-survival rates across 3 transplant centers in Sweden and a significant difference for mortality. Medcalf et al 5 found significant variation for both graft and patient-survival rates across 5 transplant centers when comparing to one reference center. Plausible explanations for the differences in findings include: the time era of transplant, the length of follow-up period, the inclusion and exclusion criteria of the cohort studies, the choice of reference center, and covariates used for adjustment.
Patient and transplant-specific characteristics known to affect graft and patient survival have been well documented.6,7,17 In the study by Gjertson, 2 the following patient factors were found to contribute to center variation in outcomes from living donors: recipient race, age, sex, cause of ESRD, obesity status, time on dialysis, donor relationship, donor age, sex, and race. In addition to patient characteristics, the calendar year of transplantation has also been shown to impact variability in graft-survival rates. While our study found some of the same patient case mix factors to be significantly associated with improved graft survival in multivariable models (recipient age, BMI, pretransplant time on dialysis, donor type, and donor age), we were unable to identify which specific patient factors contributed directly to center variation nor were we able to provide a percentage. Patient-survival rates have been found to be influenced by recipient age, comorbidities, and the type of donor (living compared to deceased). 33 From the multivariable models, patient case mix factors found to be significantly associated with total mortality were older recipient age and male sex, greater Charlson Index, greater time on dialysis pretransplant, older donor age, and earlier time era of transplant. While the overall P value was not significant for race, being Caucasian had worse patient survival compared to the reference group with its CI excluding 1.
Interestingly, we did not detect any independent statistically significant association between a center’s transplant volume and either graft survival or patient survival in our adjusted multivariable models. The literature examining whether an association between kidney transplant center volume and posttransplantation outcomes exists was recently summarized in a systematic review. 34 While just under half of these prior studies found a positive and significant association between greater volume and graft survival,1,4,1819-21,23 the remainder of previous studies included in the review, either found no association between volume and outcome3,6,35-37 or were inconclusive.2,17,38,39 We acknowledge that center volume is likely a surrogate marker, as there are many factors that we were unable to measure that may impact quality of care and therefore transplant outcome. Some of these include the infrastructure of the hospital (number of years as a transplant center, number of beds dedicated to transplant patients, and the type of dedicated health care providers for transplant patients), experience of the medical physicians and surgeons caring for the patient in hospital, and the postoperative care in hospital (experience of team caring for the patient), follow-up procedures after discharge (eg, frequency of clinic visits after hospital discharge and the location of transplant follow-up care).
Our study included a cohort of over 5000 patients who underwent primary solitary kidney transplantation in Ontario between 2000 and 2013 and is the first large analysis to examine center variation in kidney transplant outcomes transplanted exclusively beyond the year 2000. This is relevant, given that short-term patient- and graft-survival rates have ameliorated with improvements in the newer immunosuppressive therapies. Furthermore, we included patients who had more than 10 years of follow-up, enabling an assessment of outcomes at 10 years after transplantation. This is important because a previous Canadian study found greater variation in the survival rates across centers with increasing time from transplantation. 4
Our study had several limitations. First, there was a high percentage of missing data for certain covariates which precluded the use of a multiple imputation approach and meant that covariates, such as cold ischemia time, panel-reactive antibody, and distance to hospital, which have been found to be associated with graft survival and potentially contribute to a center variation could not be analyzed. Second, the small number of centers included in the analyses meant we could not perform hierarchical modeling. Third, given the nature of our study which used administrative databases, we were unable to take into account some important patient and clinical process variables such as immunosuppressive protocols which may vary at institutions and explain differences in patient outcomes. Fourth, adjustment for all comorbid conditions across centers was challenging, given the nature of the study. and therefore. it is possible that certain factors were not accounted for. Finally, while it was our intention to analyze the association between provider experience and transplant outcome, the estimate used for provider experience was an average of all the different physicians billing for one patient at the time of transplant, as there was not one specific provider who was most responsible for the patient’s care. While a shared-care model itself is not a limitation, this type of model hindered our ability to conduct meaningful analyses.
As the number of patients with ESRD continues to increase and the number of available kidneys for transplantation remains steady, optimizing graft-survival rates is essential. While identification of patient factors that affect transplant outcomes is important, such factors are not always modifiable. Examining center factors in association with transplant outcomes is important, as some of these variables may be adjustable. For example, learning that center transplant volume was not associated with graft or patient-survival rates is a key finding and reassuring for patients. While the results from this study are meaningful, they will need to be confirmed using a larger sample of transplant centers. A larger study can be further enriched by including additional data that are not routinely collected and that may explain center variation, for example, by surveying transplant directors about factors such as induction and maintenance immunosuppression protocols and clinic follow-up intervals.
In conclusion, we found significant variation in graft- and patient-survival rates across kidney transplant centers in Ontario. While the association with center volume and graft survival did not reach statistical significance, there was a tendency toward reduced risk of graft loss in centers with higher volumes; however, center volume was not associated with total mortality. We did not find strong support for our hypotheses that neither case mix nor center volume explained some of the variations across the centers. There are other factors, such as provider characteristics, which were not examined in this study that may account for differences in patient and graft survival. Future studies with more granular capture of provider details will be needed to improve our understanding of between-center differences in kidney transplantation.
Supplemental Material
SUPPLEMENTAL_TABLES – Supplemental material for The Effect of Transplant Volume and Patient Case Mix on Center Variation in Kidney Transplantation Outcomes
Supplemental material, SUPPLEMENTAL_TABLES for The Effect of Transplant Volume and Patient Case Mix on Center Variation in Kidney Transplantation Outcomes by Anne Tsampalieros, Dean Fergusson, Stephanie Dixon, Shane W. English, Douglas Manuel, Carl Van Walraven, Monica Taljaard and Greg A. Knoll in Canadian Journal of Kidney Health and Disease
Footnotes
Acknowledgements
Parts of this material are based on data and information compiled and provided by the Canadian Institute of Health Information (CIHI). However, the analyses, conclusions, opinions, and statements expressed herein are those of the author and not necessarily of the CIHI. No endorsement by the Institute for Clinical Evaluative Sciences (ICES) or the Ontario Ministry of Health and Long-Term Care is intended or should be inferred. The research was conducted partly by members of the ICES Kidney, Dialysis, and Transplantation team, at the ICES Western facility who are supported by a grant from the Canadian Institute of Health Research.
List of Abbreviations
BMI, body mass index; CIHI-DAD, Canadian Institute for Health Information Discharge Abstract Database; CI, confidence intervals; CORR, Canadian Organ Replacement Register; ESRD, end-stage renal disease; ICES, Institute for Clinical Evaluative Sciences; IQR, interquartile range; OHIP, Ontario Health Insurance Plan; SD, standard deviation; RPDB, Ontario Registered Persons Database.
Ethics Approval and Consent to Participate
This project was conducted under section 45 and approved by ICES’s Privacy and Compliance Office. ICES is a prescribed entity under section 45 of Ontario’s Personal Health Information Protection Act (PHIPA). Projects conducted under section 45 do not require review by a Research Ethics Board.
Consent for Publication
Not Applicable.
Availability of Data and Material
The data set is held securely in coded form at the Institute of Evaluative Sciences (ICES), While data sharing agreements prohibit ICES from making the data set publicly available access can be granted to those who meet prespecified criteria.
Author Contributions
A.T. was responsible for the conception and design of the study, analysis and interpretation of data, drafted and finalized the manuscript. D.F. participated in the conception and design of the work, analysis, and interpretation of data, drafting and final approval of the manuscript. S.D. was responsible for creating the data set, for analyzing and interpreting the data, drafting and final approval of the manuscript. S.W.E. participated in the interpretation of data and writing of the manuscript. D.M. participated in the interpretation of data and in writing the manuscript. C.V.W. participated in the analysis and interpretation of the data, drafting and final approval of the manuscript. M.T. was responsible for the statistical analysis and interpretation of the data, drafting and approval of final manuscript. G.A.K. was responsible for the conception and design, analysis and interpreting the data, drafting and approval of final manuscript.
Declaration of Conflicting Interests
The author(s) declared no potential conflicts of interest with respect to the research, authorship, and/or publication of this article.
Funding
The author(s) disclosed receipt of the following financial support for the research, authorship, and/or publication of this article: G.A.K. is supported by the University of Ottawa Chair in Clinical Transplantation Research. A.T. was supported by the Kidney Research Scientist Core Education and National Training Program. This study was supported by the Institute for Clinical Evaluative Sciences. Institute for Clinical Evaluative Sciences is funded by an annual grant from the Ontario Ministry of Health and Long-Term Care. The opinions, results, and conclusions reported in this paper are those of the authors and are independent from the funding sources
Supplemental Material
Supplemental material for this article is available online.
References
Supplementary Material
Please find the following supplemental material available below.
For Open Access articles published under a Creative Commons License, all supplemental material carries the same license as the article it is associated with.
For non-Open Access articles published, all supplemental material carries a non-exclusive license, and permission requests for re-use of supplemental material or any part of supplemental material shall be sent directly to the copyright owner as specified in the copyright notice associated with the article.