
Abstract
Background:
Kidney transplantation is the best treatment option for patients with end-stage renal disease. While patient-level factors affecting survival are established, the presence of variation in the management of transplant recipients remains unknown.
Objective:
The objective of this study was to examine center variation in kidney transplantation and identify center and provider characteristics that may be associated with clinical outcomes.
Design:
This is a systematic review.
Data sources:
Ovid Medline, Embase, and Cochrane library from inception to June 2016 were used.
Study eligibility:
Any study examining the association between center or provider characteristics and graft or patient survival, quality of life, or functional status were included.
Results:
We identified 6327 records and 24 studies met eligibility. Most studies used data registries. Characteristics evaluated include center volume (n = 17), provider volume (n = 2), provider experience (n = 1), center type (n = 2), and location of follow-up (n = 1). Outcomes assessed included graft survival (n = 24) and patient survival (n = 9). Significant center variation was described in 12 of 15 and 5 of 7 studies for graft and patient survival. There was a significant and positive association between center volume and graft and patient survival in 8 and 2 studies, respectively. Provider experience and volume were significantly associated with less allograft loss and provider volume with lower risk of death. There was no association between graft survival and location of follow-up or center type.
Limitations:
There was substantial heterogeneity in the variables assessed and methodology used to analyze associations.
Conclusion:
This systematic review found center variation in kidney transplantation. Future studies in the current era are necessary to better evaluate this important topic.
What was known before
Prior earlier studies have described center variation in graft and patient survival rates post kidney transplantation. However, it has yet to be established which center and provider factors may contribute to this variation.
What this adds
This review highlights the heterogeneity of studies published on center variation and provides a comprehensive summary on center and provider factors that have been examined in association with center variation. The literature suggests there is center variation in graft survival rates; however, it remains unclear which center and provider factors contribute to this.
Introduction
Kidney transplantation is the optimal treatment for end-stage renal disease (ESRD) as it is associated with increased survival, improved quality of life, and reduced cost compared with chronic dialysis. 1 With improved immunosuppression regimens, 1-year graft and patient survival rates are now greater than 90%. 2 Despite these improvements, medium- and long-term graft survival remains unchanged, with 20% suffering from transplant failure within the first 5 years 3 and up to 50% by 10 years. 4
Traditional recipient and donor risk factors for graft and patient survival have been established and include such variables as recipient age, race, gender, body mass index, time on dialysis, medical comorbidities, etc.5,6 While these patient-level factors, among others, have been associated with graft and patient survival, they do not fully explain differences in survival across transplant centers. The “center effect,” defined as the variability in graft outcomes at different centers that cannot be accounted for by case mix or chance alone,7,8 was first described by Opelz in 1975. 9 Since then, several studies have attempted to better understand this phenomenon.6,10-13 A study by Zenios et al 14 reported that 29% of graft failures and 33% of deaths could be attributed to differences across centers. That is, if every center included in their study matched the top center for outcomes, 33% of deaths and 29% of graft losses would be avoided over the 3 years. However, reasons for the observed differences were not determined. 14
Specific center-level factors that could potentially affect transplant outcomes include surgical volume at the center, type of transplant center (pediatric compared with adult), type and number of providers caring for patients in-hospital, model of care at the center (shared care compared with individual provider-level care), location, and frequency of follow-up visits after transplantation. The provider-level factors which could potentially affect outcomes include years of experience, provider specialty (eg, general surgeon compared to urologist), country of medical school graduation, location of practice (eg, urban or rural), and caseload. These center- and provider-level factors may differ further depending on the type of patient population, pediatric compared with the adult population. Neither center- nor provider-level factors have been analyzed in a systematic fashion to determine to what extent they explain center variation in important clinical outcomes. The purpose of this systematic review is to describe the magnitude of center variation in kidney transplantation and to identify and summarize center- and provider-level variables associated with patient-important outcomes (allograft and patient survival, quality of life and functional status) following kidney transplantation in randomized and observational studies. We hypothesized center variation would not be explained by case mix alone.
Methods
Search Strategy
This study was conducted and prepared using the Meta-analysis of Observational Studies in Epidemiology statement. 15 We conducted systematic electronic searches using Ovid Medline (1946 to 2016 June), Embase (1947 to 2016 June), and Cochrane Central (2016 January) databases without language restriction. The search strategy was designed and implemented by an information specialist. Full details are in Appendix A. Bibliographies from recent reviews and published studies were searched as well. A protocol for this review has not been registered.
Study Selection
An initial screen of identified titles and abstracts was performed by 2 investigators (A.B., N.F.) and clearly irrelevant records removed at this stage. Full-text versions of potentially eligible studies were obtained and independently screened by 2 of 3 investigators (A.T., A.B., N.F.) to determine their eligibility based on the selection criteria. Any disagreements during the screening process were resolved through discussion among the authors in accordance with the selection criteria. We included studies that met the following criteria: (1) randomized controlled trial, prospective nonrandomized interventional study, prospective or retrospective cohort or case control study involving kidney transplant recipients (all ages) with a time to event outcome; (2) compared any type of center or provider differences post kidney transplantation; (3) reported either graft survival, patient survival, quality of life, or functional status. We excluded (1) articles not available in English; (2) studies that lacked more than one comparison group; (3) animal studies; (4) abstracts without a full-text publication; (5) case reports, reviews, commentaries, and unpublished studies; (6) cross sectional studies or other studies that lacked follow-up post transplantation. Reason for study exclusion was noted.
Data Abstraction
Data were abstracted independently by 2 of 3 investigators (A.T., A.B., N.F.) using a standardized data abstraction form. Any disagreements were resolved by discussion or a third reviewer. Reviewers were not blinded to the authors or journal articles. Our primary outcomes were allograft failure and patient death. Allograft failure was defined as a permanent return to dialysis, retransplantation, or death. Patient death was defined as death at any time post transplant. Secondary outcomes included quality of life and functional status. We collected information on the following characteristics: primary author, publication year, country, number of centers, number of participants, study design, data registry, calendar years the transplants were conducted, length of follow-up, inclusion/exclusion criteria for selecting participants, method of analysis, and outcome assessed. Data collected on the exposure(s) included type of exposure (eg, center volume, provider experience), how the exposure was measured (categorical, continuous), statistical modeling used, and methods and variables considered if adjusted for case mix. When data were only available in figures, the GNU Image Manipulation Program (GIMP 2.8; http://www.gimp.org/) was used to extract data. Contact with authors was not made as half (n = 12) of the articles were published prior to the year 2000, 10 of which were registry based further complicating the ability to obtain missing information. Abstracted studies which did not have an appropriate exposure (eg, socioeconomic status) or included only a subgroup of transplant recipients (eg, recipients with only a certain diagnosis) were excluded from the review.
Risk of Bias Assessment
Study quality was independently assessed by 2 of 3 investigators (A.T., A.B., N.F.) who were not blinded. All studies were assessed using a modified version of the Newcastle-Ottawa Scale16,17 (see Appendix B for scale applied). We considered >20% missing in follow-up to have high risk of bias. 18
Data Analysis
Survival rates, unadjusted or adjusted for case mix, were described at variable time points post transplant using tables and a figure. Outcome data adjusted for case mix was summarized based on the analytical method used in the study, which included odds ratios, hazard ratios, and risk ratios. We were unable to pool the data as studies were too heterogeneous in both exposures, approaches to analysis and type of reported effect size. We were unable to use any statistical indices to quantify heterogeneity in the study.
Results
Study Selection
The electronic search revealed 6327 independent records. After exclusions, we reviewed the full-text version of 236 citations and 215 were excluded (Figure 1). We found additional references from reviewing bibliographies of included articles. Twenty-four independent studies met all eligibility criteria.

Flow diagram demonstrating electronic search results.
Description of Included Studies
The characteristics of each study are presented in Table 1. Studies were published between 1975 and 2014. Most of the studies (n = 23) were retrospective observational studies with the exception of one prospective observational study. 19 Twelve studies originated from the United States,7,12,20-29 6 from Europe,10,19,30-33 2 from Taiwan,34,35 1 each from Canada, 6 North America, 9 Australia, 11 and South Africa. 36 Eight studies included adult patients (≥18 years),6,7,10,11,20,30,32,35 8 studies included patients of all ages,12,21,24,25,27-29,34 and 2 studies were restricted to pediatric patients (<21 years).22,23 Six studies did not report the selected age range included.9,19,26,31,33,36 All 24 studies assessed graft survival as an outcome; however, only 1 study censored for death, 30 13 included death in their graft survival outcome6,10-12,19-21,25,27,29,32-34 while the rest of the studies did not specify. Nine studies also assessed patient survival. The mean (SD) of the number of centers assessed was 99 (98), ranging from 1 to 258. One study did not report the number of centers included. 26 We did not identify any studies assessing center differences associated with quality of life or functional status.
Characteristics of Included Studies.

Note. OPTN = Organ Procurement and Transplantation Network; UNOS = United Network for Organ Sharing; CORR = Canadian Organ Replacement Register; SRTR = Scientific Registry of Transplant Recipients; ANZDATA = Australia and New Zealand Dialysis and Transplant Registry; NAPRTCS = North American Pediatric Renal Trials and Collaborative Studies; NHS = National Health services; NR = not reported.
Unclear if graft failure includes death.
Risk of Bias
The quality of the included studies is presented in Table 2. There was a range in the quality of the studies, with most having some risk of bias or were unclear due to insufficient reporting. Just over half of the studies had high risk of bias with regard to the representativeness of the study cohort as they only included a specific subset of the transplant population, for example, living donor only. The greatest source of bias in the included studies related to the differing methodologies and the diverse analytical approaches used within individual studies to assess for center variation. For example, 10 studies7,9,19,23,24,26,31,33,35,37 did not appropriately adjust for differences in patient case mix across centers that may have confounded the estimates of center effect. With regard to follow-up, the vast majority of studies were not clear in their reporting or had high risk of bias as they either did not report the percentage that was missing in follow-up or more than 20% of their study population missing by study end.
Risk of Bias and Methodological Quality Assessment of Observational Studies.

Note. “+” indicates low risk of bias; “–” indicates high risk of bias; “?” indicates unclear.
Center variation
Graft survival
Fifteen studies assessed the extent of center variation in graft survival (Table 3). All of these studies with the exception of 27,19 adjusted for patient case mix, 11 adjusted for calendar year or era, 6,10-12,21,22,26,27,30,32 and 1 study adjusted for center volume. 6 Nine studies provided the spread in 1-year graft survival across centers (Figure 2) while only 2 studies provided the spread across centers in 3- and 5-year graft survival. Twelve studies6,7,12,19,21,22,25-27,30,32,33 reported significant variation across centers in graft survival (2 of these studies did not adjust for case mix), and 3 studies found no significant variation across centers.10,11,29 Five studies used fixed-effects Cox proportional modeling of which 3 studies6,10,30 provided hazard ratios for graft failure/survival, 1 study provided relative risk for graft failure, 29 and 1 study did not describe their findings. 32 Five studies used random-effects Poisson regression modeling and described center variation using intraclass correlation coefficients.12,21,22,25,27 Two studies used random-effects logistic regression modeling, both reporting survival rates.11,26 The remaining 3 studies used actuarial life tables and the log-rank method.7,19,24
Studies Which Assessed Center Variation in Graft and Patient Survival.

Note. ICC = intraclass correlation coefficient; HR = hazard ratio; RR = relative risk; ESRD = end-stage renal disease; PRA = panel reactive antibody; HLA = human leukocyte antigen; CMV = cytomegalovirus; BMI = body mass index; NR = not reported.
Relative to a reference site.

The range in 1-year graft survival rates across centers (n) reported by each study. Studies are organized by year they were conducted as well as whether they adjusted for case mix. The * symbol implies the study adjusted the rate for case mix and the ǂ symbol implies the study adjusted the rates for center volume.
The variation in graft survival between centers in some studies was quite small, while in others it was substantial. For example, in Briganti et al, 11 the 1-year graft survival ranged between 89.2% and 92.2% across 16 different sites, while in Gjertson et al, 27 the 1-year graft survival ranged between 62% and 100% at 223 different sites, despite adjustment for case mix in both of these studies. We stratified studies warranting further analysis by using the risk of bias tool. When including only those studies with the lowest risk of bias (defined as “3 or more +”), 6 out of the 24 studies remained, all of which were published after 2000.10-12,20,30,34 Of the 4 studies which assessed center variation and graft survival rates, 212,30 found statistically significant variation while the others did not.10,11
Patient survival
Seven studies reported on center variation in patient survival6,10,11,19,29,30,33 (Table 3). Five studies adjusted for case mix,6,10,11,29,30 4 adjusted for time era,6,10,11,30 and 1 study adjusted for center volume. 6 Six studies provided the spread in 1-year patient survival across centers (Figure 3) while 3 studies provided the spread across centers in 3- and 5-year graft survival. Four studies used fixed-effects modeling6,10,29,30 to test for variation with 2 studies reporting hazard ratios,6,30 1 reporting mortality rates, 10 and 1 reporting relative risk. 29 Briganti et al 11 used random-effects logistic regression modeling. The remaining 2 studies used actuarial life tables and log-rank tests of survival rates19,33. Five studies found statistically significant variation in patient survival across centers,6,10,19,29,30 1 study reported no significant variation, 33 and in 1 study, their conclusions were not clear. 11 Again, between-center differences was highly variable across studies. For example, Elinder et al 10 reported 1-year patient survival that varied only minimally from 97.9% to 98.6% across 3 centers, while Kim et al 6 reported a range from 89.9% to 97.7% across 20 centers. When considering only those studies with the lowest level of bias,10,11,30 of the 3 studies which assessed center variation and patient survival rates, 210,30 of 3 found statistically significant variation while the other was inconclusive. 11

The range in 1-year patient survival rates across centers (n) reported by each study. Studies are organized by year they were conducted as well as whether they adjusted for case mix. The * symbol implies the study adjusted the rate for case mix and the ǂ symbol implies the study adjusted the rates for center volume.
Effect of volume on clinical outcomes
Graft survival
Seventeen studies examined the relationship between center volume and graft survival/graft loss (Table 4); 11 studies categorized volume data,6,7,11,20,21,23,24,26,28,34,35 4 presented volume as a continuous measure,9,12,22,27 and 2 studies described a volume relationship without providing any supporting numbers.29,32 We were unable to present pooled results due to heterogeneity in number of categories and thresholds described, methodology used, and reporting of outcomes. For example, some studies reported a binary outcome while others used time to event outcomes. Overall, 8 studies documented improved graft survival with higher center volume;6,20-23,28,34,35 however, 1 study did not provide effect measures, P values, or confidence intervals. 21 Gjertson et al 22 and Schurman et al 23 were the only 2 studies which included pediatric patients exclusively. In both studies, there was a significant association between center volume and 5-year graft survival rates. Five studies did not observe an association between volume and graft survival/failure,7,9,26,29,32 and 4 studies were inconclusive and did not give any estimates with regard to the nature of the relationship (direction or significance).11,12,24,27 When including only low risk of bias studies which assessed volume and graft survival, 2 studies reported a positive and significant association with graft survival20,34 while the other 2 were inconclusive.11,12
Studies Which Assessed Center Volume in Association With Graft and Patient Survival.
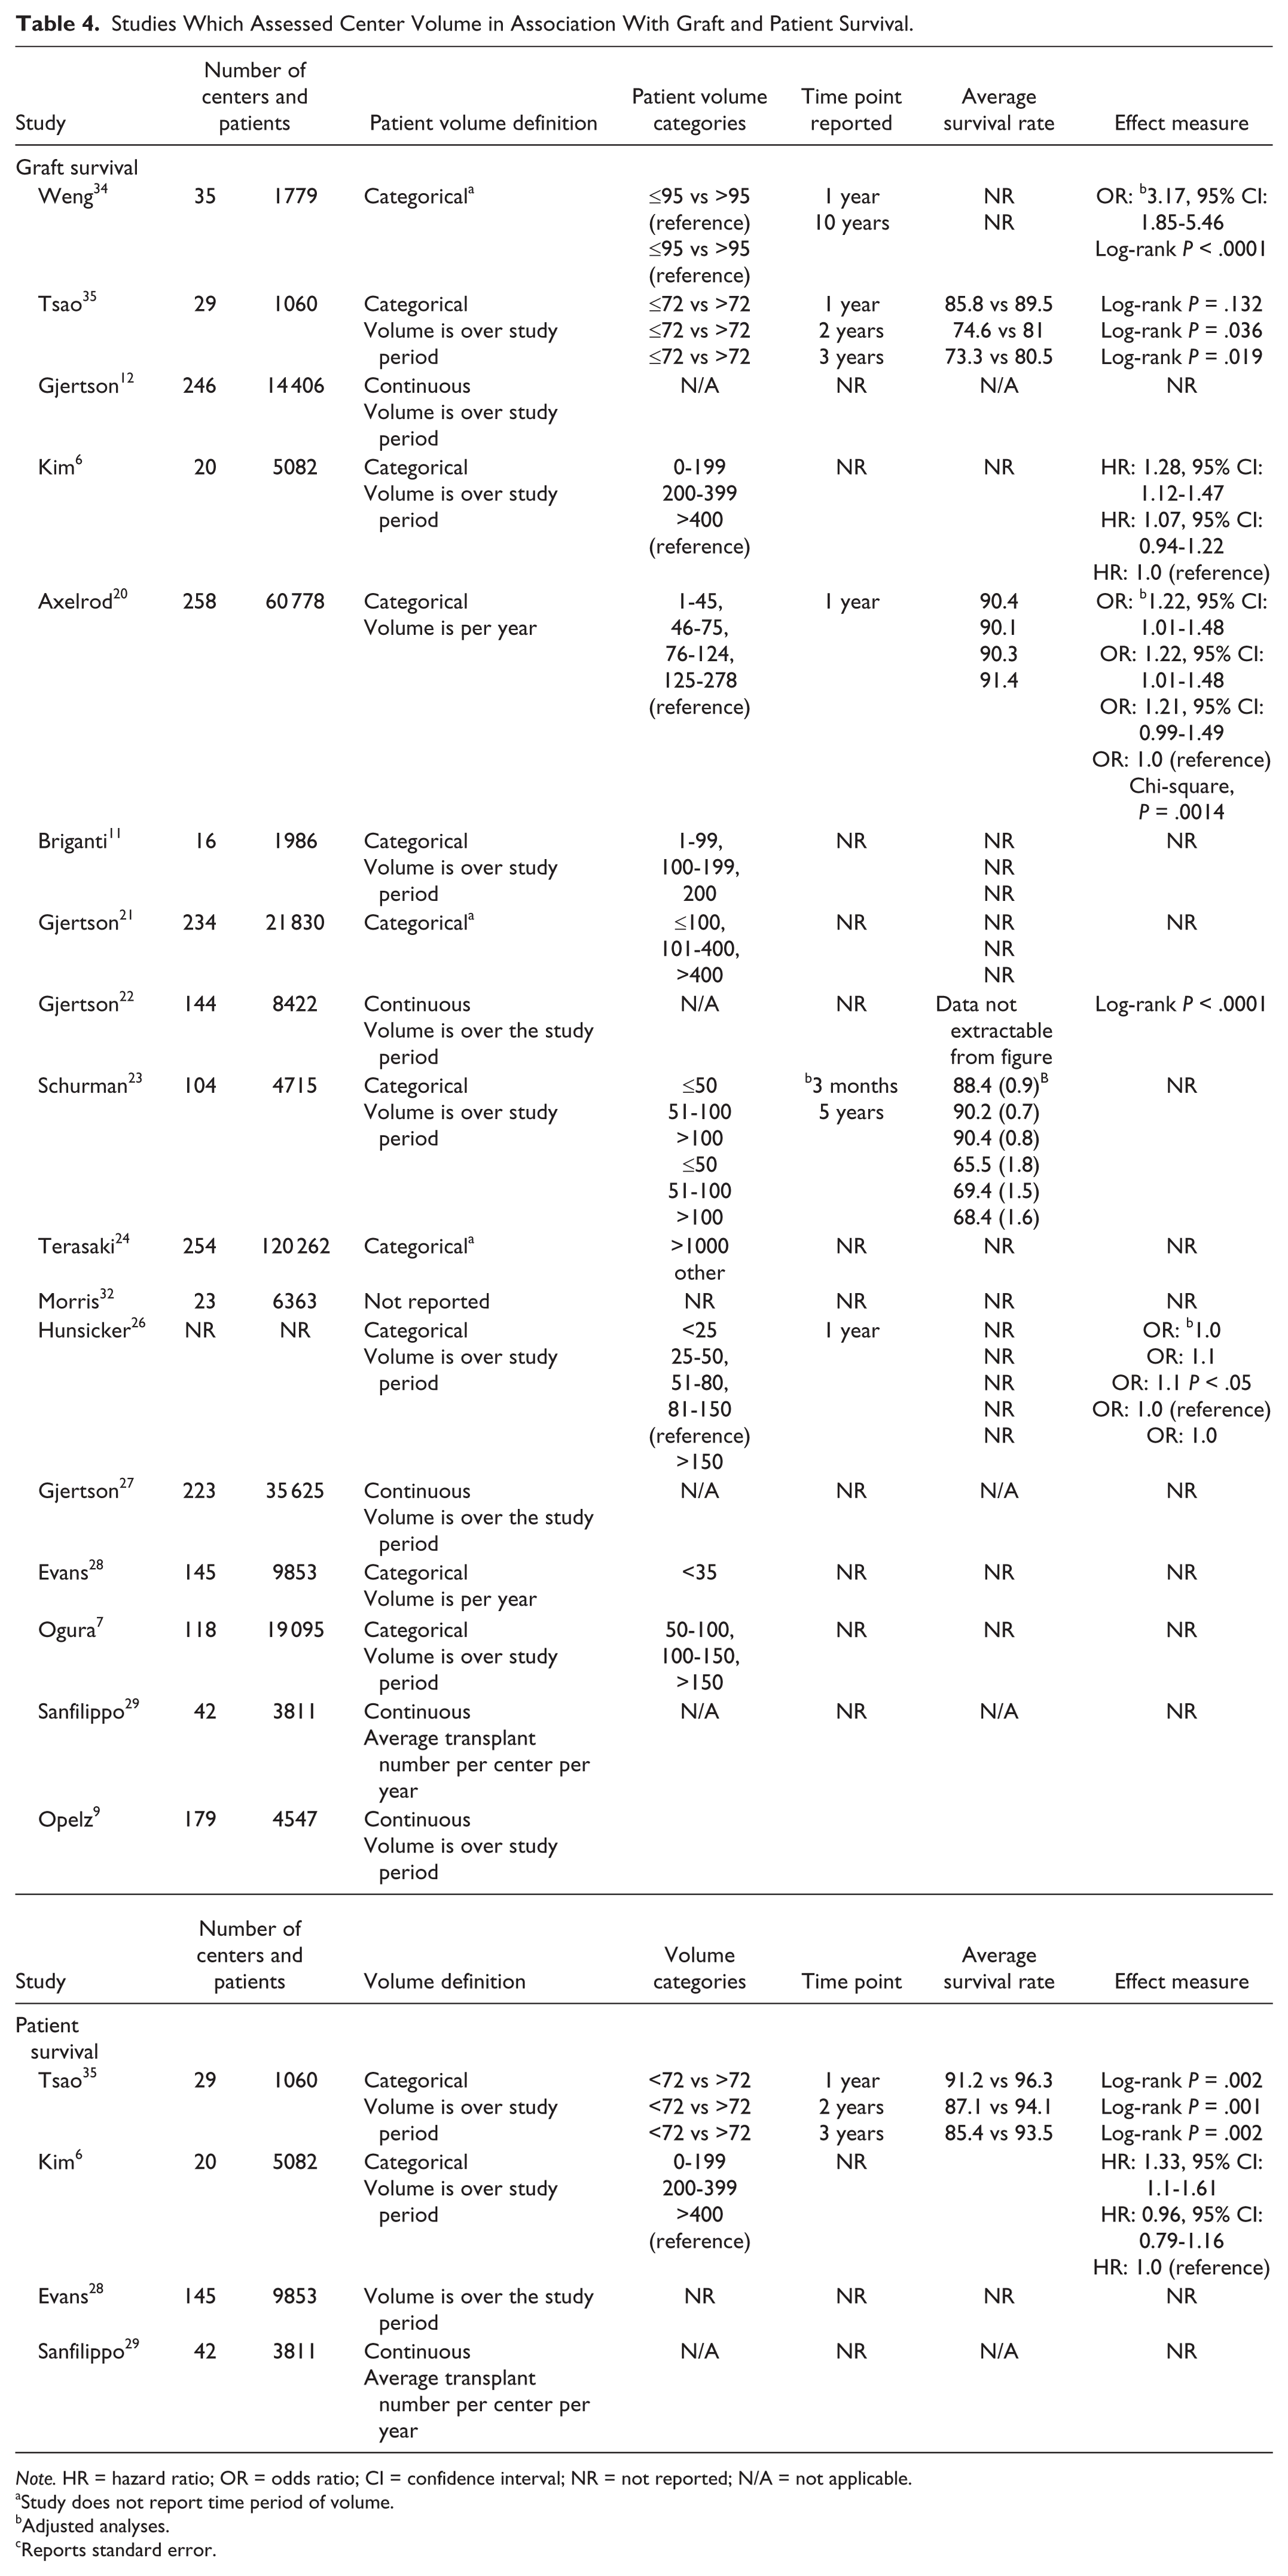
Note. HR = hazard ratio; OR = odds ratio; CI = confidence interval; NR = not reported; N/A = not applicable.
Study does not report time period of volume.
Adjusted analyses.
Reports standard error.
Patient survival
Four studies examined the relationship between center volume and patient survival6,28,29,35; 2 categorized volume data,6,35 1 treated volume as a continuous variable, 29 and 1 study described the relationship between volume and patient survival without providing any data. 28 Two of the 4 studies reported a significant association6,35 and 2 studies did not observe an association between volume and patient survival.28,29
Provider volume
Two of the above included studies also examined the association between provider volume and graft survival. Weng et al 34 found that graft failure (including death) within 1 year was 3.1 times greater (95% confidence interval, 1.80-5.33) for lower volume surgeons (≤33), defined as total patient volume over the study period, compared with higher volume surgeons. And 10-year survival rates were significantly lower in the lower volume physician groups (P < .001). Evans et al 28 examined average surgeon volume and observed no significant association with graft survival (P = .69). However, they did show that high surgeon volume (>500 procedures) was associated with a significant reduction in patient death (odds ratio: 0.79; P = .016).
Additional factors assessed
Additional factors assessed in association with transplant outcomes included provider experience, 28 type of center defined as for-profit or teaching hospitals in 1 study 28 and defined by percentage of pediatric cases performed in the other, 22 location of posttransplantation follow-up after being discharged from one transplant center 36 and crossmatch policy (ie, use of historical compared with only using current era) 31 (see Supplementary Table 1).
Discussion
Our systematic review synthesized data from 24 studies to assess the magnitude of variation and impact of center characteristics in kidney transplant patient outcomes. Of the variables investigated, center volume was most commonly studied with inconsistent results. Overall, the data were inconclusive and challenging to analyze as studies used different methodology and did not always report the statistical significance of their findings. However, most of the studies reported variation among centers in graft survival rates and just over half described center variation in patient survival rates. None of the studies investigated quality of life or functional status.
To our knowledge, this is the first systematic review to assess the presence of center variation in kidney transplantation. Understanding differences in transplant center performance and improving quality of care has become a priority in the United States with program specific reports now widely available to the public.38,39 These reports provide survival data and compare each center to national standards. They do not, however, explore which center or provider factors (including which potentially modifiable factors) may be responsible for variability across centers. We identified 2 studies that assessed provider experience (using provider volume and years in practice) in association with graft survival and patient survival 28 and only 1 study that examined location of follow-up care (center compared with rural), in association with graft survival. 36 This study did not find a significant difference in outcomes between location of follow-up; however, the study was retrospective and the sample size was small. We identified 1 study by Israni et al 40 that characterized the frequency of follow-up visits post transplantation in the United States. They found that the frequency of visits at various time intervals post transplantation differed by region as did the number of visits to the transplant center. Centers with “medium” volumes were more likely to follow their patients than centers with lower or greater volumes. This study was not included in our review as it failed to link follow-up pattern with an outcome; however it does highlight the variation in patterns of care which may impact on patient outcome. Future, larger prospective studies comparing frequency and location of follow-up care post transplant are needed to help determine if they may improve graft and patient survival as well as quality of life.
The volume-outcome association has been well studied and summarized in other surgical areas, especially cardiac surgery where a definite association between volume and mortality is clear and defining a volume threshold may be possible.41,42 For example, the review by Pettit et al 42 suggested that centers conducting less than 10 to 12 heart transplants per year may correspond with higher mortality rates. Within the field of nephrology, the volume-outcome relationship was recently reviewed in dialysis. 43 For peritoneal dialysis, all included studies showed higher volume facilities significantly favored technique survival; however, there was no significant association found for greater volume and patient survival. There was only 1 study looking at hemodialysis patients which found a positive and significant association between volume and patient survival.
The volume-outcome association has not been studied for kidney transplant outcomes. In our review, less than half of the studies assessing center volume and graft survival found that greater center volume had a higher survival rate. Two of these studies included only pediatric patients22,23 and both reported a significant association between graft survival and center volume. These results suggest that the effects of center volume and other provider-level factors may differ between adult and pediatric populations. The remaining studies found no association or were inconclusive in both the direction and significance, although 90% (8/9) of these studies did not report an effect size or P value. None of the studies in our review used the same threshold to define volume categories and 5 studies included volume as a continuous variable. When we analyzed the 4 studies with lower risk of bias separately, the findings were similar with only 50% showing a positive and significant association. Overall, it remains unclear whether a volume-outcome association is present in kidney transplantation. Future large observational studies using appropriate statistical methodology adjusting for case mix and assessing transplant volume as a continuous variable are required to assess this relationship.
Based on our findings, it appears that there is variation in graft survival rates across centers which is not explained by patient factors only. One hypothesis is that it may be partially explained by the calendar year in which the transplants were conducted as several studies6,10,11,22,25,27,30,32 found a significant improvement in graft survival with later calendar year. Furthermore, the study by Gjertson 25 reported variation in 1-year graft survival rates attributable to the transplant center decreased with calendar year. For example, in 1989 intraclass correlation coefficient was 32%, in 1990 it was 27%, and by 1996 it was 17%. The type of statistical model used may also impact the findings with respect to the presence of variability across centers. For example, when Briganti et al 11 used multivariate hierarchical modeling compared with unadjusted models and fixed-effects models, there was no longer a discrepancy in graft survival rates across centers included. This highlights the importance of choosing an appropriate statistical model and adjusting for relevant factors.
Quality of life and functional status are often overlooked but very important patient outcomes. Health-related quality of life has been reported as being more important to patients with ESRD as it may reflect how the patient feels compared with other measures. 44 Greater physical health–related quality of life is associated with decreased mortality and improved graft survival even after adjusting for clinical variables in kidney transplant recipients.45,46 We did not identify any studies which compared center or provider differences in association with quality of life or functional status.
Strengths and Limitations
The strengths of our review include its comprehensiveness and the variety of studies assessed. There was a wide range of countries represented, and data registries were not only US based but also included Canada, Europe, South Africa, and Asia. The studies we included spanned over 4 decades of time (1975-2014). Of the one-third of studies (8 of 24) that included patients transplanted during or after the year 2000, all 8 also included patients transplanted prior to 2000. This precluded the ability to comment on center variation in the era of newer immunosuppressive regimens. While this certainly limited our analysis, it points toward the need for more updated studies evaluating center effect in patients exclusively transplanted after the year 2000.
Unfortunately, we were unable to pool data across studies due to significant clinical, methodological, and analytical heterogeneity. Explanatory variables differed in their definition across studies and not all studies adjusted for case mix or adjusted for different patient and recipient factors. Furthermore, the length of follow-up time and outcome end points varied across studies, and we were unable to assess center variation in longer term graft and patient survival rates. We recognize this to be an additional limitation of our review. The vast majority of the studies included in our systematic review relied on registry databases which may not have contained information on important factors such as socioeconomic status, medical insurance, or transportation which have been shown to impact graft survival in kidney transplantation.47,48 Eight of the included studies used the United Network for Organ Sharing (UNOS) registry and some of these studies overlapped in their time frame and thus the same patients may have contributed to more than 1 study. Last, we were unable to assess for publication bias. It is possible that by excluding unpublished studies and published abstracts, we missed additional factors influencing center variation.
Conclusion
In summary, our systematic review identified center variation in kidney transplantation in some of the included studies; however, due to the substantial heterogeneity in the analytical methodology used and specific center and provider factors identified, there was no conclusive evidence that any specific variable, such as center volume, was associated with outcomes. Our results are important as they demonstrate inconsistencies within studies investigating center effect and kidney transplant outcomes and the need for future prospective studies with more detailed clinical information. Moreover, there is a paucity of literature assessing other potentially influential center characteristics as well as important outcomes such as quality of life. Further research, with appropriate statistical methodology (hierarchical modeling) adjusting for all known confounders and longer follow-up time, is needed to better characterize factors contributing to center variation in patient-important outcomes such as graft survival and quality of life.
Footnotes
Appendix A
--------------------------------------------------------------------------------
Search Strategy:
--------------------------------------------------------------------------------
Database: Embase Classic+Embase <1947 to 2016 June 24>, Epub Ahead of Print, In-Process & Other Non-Indexed Citations, Ovid MEDLINE(R) Daily and Ovid MEDLINE(R) <1946 to Present>
Search Strategy:
--------------------------------------------------------------------------------
Search Strategy:
--------------------------------------------------------------------------------
Appendix B
Acknowledgements
We would like to thank Risa Shorr for her help with the search strategy.
List of Abbreviations
USA, United States of America; SD, standard deviation; PRA, panel reactive antibody; ESRD, end-stage renal disease; UNOS, United Network for Organ Sharing.
Ethics Approval and Consent to Participate
Not applicable.
Consent for Publication
Not applicable.
Availability of Data and Materials
Not applicable.
Author Contributions
AT was responsible for the conception and design of the study, analysis and interpretation of data, and drafting and finalizing the manuscript. GK was responsible for conception and design, analysis and interpreting the data, and drafting and approval of final manuscript. NF was responsible for data abstraction and interpretation, and drafting and final approval of the manuscript. AB was responsible for data abstraction and interpretation, and drafting and final approval of the manuscript. MT was responsible for conception, design, analysis and interpreting the data, and drafting and approval of final manuscript. DF was responsible in the conception and design of the work, analysis and interpretation of data, and drafting and final approval of the manuscript.
Declaration of Conflicting Interests
The author(s) declared no potential conflicts of interest with respect to the research, authorship, and/or publication of this article.
Funding
The author(s) disclosed receipt of the following financial support for the research, authorship, and/or publication of this article: There was no funding provided for this study nor any study sponsors. Greg A. Knoll is supported by the University of Ottawa Chair in Clinical Transplantation Research. Anne Tsampalieros was supported by the Kidney Research Scientist Core Education and National Training Program.
References
Supplementary Material
Please find the following supplemental material available below.
For Open Access articles published under a Creative Commons License, all supplemental material carries the same license as the article it is associated with.
For non-Open Access articles published, all supplemental material carries a non-exclusive license, and permission requests for re-use of supplemental material or any part of supplemental material shall be sent directly to the copyright owner as specified in the copyright notice associated with the article.