
Abstract
Background:
Significant variation in both patient case mix and the structure of care in kidney transplantation has been previously described in the United States.
Objective:
The objective of our study was to characterize patient case mix, patterns of care, and inpatient outcomes across 5 kidney transplant centers in the province of Ontario, Canada.
Design:
This was a retrospective population-based cohort study using health care administrative databases.
Setting:
The setting is Ontario, Canada.
Patients:
We included adult (≥18 years) transplant recipients who received a primary, solitary kidney between January 1, 2000, and December 31, 2013 (N = 5037).
Methods:
Using linked administrative health care databases, we characterized kidney transplant recipient and donor factors, center characteristics, provider characteristics, and inpatient outcomes across transplant centers in Ontario. To compare case mix–adjusted differences in length of stay across centers, multivariable Cox proportional hazards regression was used to obtain hazard ratios (HRs) for each center relative to the average across all centers. Center volume and provider characteristics were added to the models to examine whether these factors explain differences in length of stay across centers.
Results:
We noted significant differences across transplant centers in patient race, cause of end-stage renal disease, body mass index, comorbidities, time on dialysis, and donor type. Mean annual transplant center volumes during the study period ranged between 51.5 (9.3) and 101.7 (23.9) transplants/year across centers (P < .0001). Physician specialty most responsible for in-hospital transplant care varied significantly across centers with the most common combination being nephrologist and urologist. Less than 31 deaths occurred in hospital during the index transplant admission but mortality risk did not differ significantly between centers. Overall, 25.1% of recipients required dialysis in hospital post transplantation (range across centers 18.3%-33.5%, P < .0001) and 24.7% of recipients spent time in the intensive care unit (ICU; range across centers: 5.7%-58.0%, P < .0001). The proportion of participants requiring dialysis did not change with time (P = .12), whereas the proportion staying in the ICU increased steadily over time (P < .0001). The median length of stay in hospital after transplantation ranged from 7 to 9 days across centers (P < .0001) and decreased significantly over time. After adjusting for patient case mix as well as center and provider factors, HRs for length of stay censored at the time of death ranged between 0.75 (95% confidence interval [CI]: 0.69-0.82) and 1.29 (95% CI: 1.20-1.38) across centers. Center volume and provider experience were not independently associated with length of hospital stay.
Limitations:
Data were missing (0.8%-18.4%) for certain covariates of interest.
Conclusions:
This study found significant heterogeneity across kidney transplant centers in case mix, practice patterns, and inpatient outcomes. Future studies are needed to examine the influence of length of stay and practice patterns on long-term outcomes such as patient/graft survival and quality of life.
What was known before
Studies from the United States have characterized differences in kidney transplant recipients across transplant centers. Variation in patterns of care and provider characteristics among Ontario kidney transplant centers has not been described.
What this adds
This large population-based study is the first to characterize differences in center- and provider-level care during kidney transplantation in Ontario. We found significant differences in patient factors, practice patterns, and provider characteristics.
Introduction
There is an increasing number of Canadians living with end-stage renal disease (ESRD).1-3 In 2014, there were 35 281 Canadians with ESRD, which increased by 38% from 2005. Kidney transplantation is associated with improved survival, better quality of life, and decreased long-term health care costs compared with dialysis.4,5 Little is known regarding the structure of inpatient care after kidney transplantation and its impact on patient outcomes. In an American survey, 6 significant variation in the structure and processes of care (including provider type) at kidney transplant centers was demonstrated.
Length of hospital stay post kidney transplantation is important, as it has been shown to be associated with increased hospital expenses,7,8 increased risk of readmission after discharge, 9 decreased graft survival, 10 and increased patient mortality.10,11 The following risk factors have been found to be associated with an increased length of stay in hospital after kidney transplantation: African American race, obesity, deceased donor type, time on dialysis before transplantation, higher Charlson comorbidity index, and the presence of comorbid conditions such as cardiac disease, respiratory disease, and cancer.8,12 To our knowledge, length of hospital stay after kidney transplantation has not been evaluated in Canada, and while center volume has been studied in association with length of hospital stay in 2 preliminary studies,13,14 provider-level factors such as provider type and experience have not been.
The objectives of the present study are therefore to (1) describe baseline patient-level characteristics (donor and recipient) at 5 adult kidney transplant centers in Ontario; (2) characterize the type of provider caring for recipients at the time of transplant; (3) compare provider characteristics (age, years in practice, gender, country of medical training) between the sites; (4) describe in-hospital outcomes during the transplant admission including duration of stay, mortality, posttransplant dialysis, and need for intensive care unit (ICU) admission; and (5) determine whether patient characteristics, center volume, and/or provider characteristics such as type of provider and provider experience are associated with length of stay and contribute to its variation across centers.
Methods
Study Design and Setting
This was a population-based retrospective cohort study using health care databases at the Institute for Clinical Evaluative Sciences (ICES) in Ontario, Canada. Ontario has a population of approximately 13.6 million residents who have universal access to health care services. This study was approved by the institutional review board at Sunnybrook Health Sciences Centre (Toronto, Canada). The reporting of this study followed guidelines described for observational studies.15,16 The full dataset creation plan is available from the authors upon request.
Data Sources
We used several linked datasets to create the cohort and to obtain patient, center, and provider characteristics and outcome data. These datasets were linked using unique encrypted patient-specific identifiers and analyzed at ICES. Kidney transplant recipients were identified using the Canadian Organ Replacement Register (CORR). CORR captures information on all kidney transplant recipients in Ontario. Its sensitivity to correctly identify kidney transplant recipients is 96% and positive predictive value is 98%. 17 Demographic and vital status information was ascertained from the Ontario Registered Persons Database (RPDB). RPDB provides basic demographic information on anyone with a valid Ontario health card number. Renal recipient comorbidities were captured using the Canadian Institute for Health Information Discharge Abstract Database (CIHI-DAD) and Ontario Health Insurance Plan (OHIP) Claims Database. CIHI-DAD captures information on all hospitalizations and same-day surgeries in Ontario, and OHIP provided information on Ontario physician billing claims for approximately 95% of physician services conducted in Ontario. We used similar codes to those used in prior kidney transplant studies from ICES.17-19 We obtained provider information using the ICES Physician Database (IPDB). IPDB contains information on physician demographics, and training and practice setting from the Corporate Provider Database, the Ontario Physician Human Resources Data Centre database, and the OHIP database of physician billings.
Study Cohort
We included all adults (≥18 years) who received a first-time solitary kidney transplant in Ontario, Canada, between January 1, 2000, and December 31, 2013, using CORR. We excluded individuals with an invalid ICES key number (IKN; a confidential ICES patient number; n = 353), who received a multiorgan transplant as this is a rare event (n = 313), were not from Ontario, had a death date prior to transplant date and therefore were invalid, had unknown age or sex (n = 14), were younger than age 18 or transplanted at a children’s hospital (n = 223), and whose OHIP transplant billing or hospitalization dates did not align with transplant date (n = 117). We also excluded patients who were transplanted at one center given the small volume of transplants performed during this time period (n = 55).
Identification of Patient, Center, and Provider Characteristics
Transplant recipients were classified by the center at which their transplant occurred using the CORR facility code number. Information on the transplant center was obtained using CORR, OHIP, and IPDB. We identified physicians who provided care to transplant recipients during their admission by linking the patient IKN with an encrypted physician number using the OHIP database. We identified the most responsible surgeon and most responsible physician by using the following OHIP transplant-related billing codes: S435 (surgical transplant fee) and G412 (nephrology component of renal transplant) which is specific for the day of the transplant. The surgical transplant fee code has been validated for identifying kidney transplant recipients. 17 Provider characteristics including specialty type, age, years since graduation, sex, and country of graduation were obtained from IPDB.
Outcomes
Outcomes of interest, defined at the individual recipient level, included length of transplant hospital admission, admission to the ICU and step-down unit during the transplant hospital admission using CIHI-DAD billing codes limited to those transplanted after March 30 2002, death during the initial transplant admission, and need for dialysis in hospital post transplant (dialysis start at least 2 days post transplant).
Statistical Analysis
All statistical analyses were performed using SAS (Statistical Analysis Software) version 9.4 (SAS Institute, Cary, North Carolina). We used descriptive statistics to summarize characteristics of patients at the time of transplant by center. Continuous variables were described using mean and standard deviation (SD) when the data followed a normal distribution or median and interquartile range (IQR) if not normally distributed. Frequencies and percentages were used for categorical data. The statistical significance of differences across transplant centers was examined using analysis of variance (ANOVA) or Kruskal-Wallis tests for continuous variables and chi-square tests or Fisher exact test for categorical variables. Center volume was calculated as average annual volume (the total number of primary solitary kidney transplants performed at a given center over the number of years performing transplants during this study period) as well as total number of transplants per year for each center. We categorized the study period into 3 time periods: January 1, 2000, to December 31, 2004; January 1, 2005, to June 30, 2009; and July 1, 2009 to December 31, 2013. For each center, we calculated the proportion of transplant patients seen by each type of provider. This was calculated as the number of patients who saw the provider type divided by the total number of transplants at that center with a transplant billing code. For each type of provider, the provider mean age and years since graduation were calculated. We also calculated the proportions of encounters with Canadian trained providers and with male providers. For each type of provider, we calculated the years of experience as years since graduation. For each patient, we calculated the average provider experience of the care team as the average years since graduation of the providers linked to a given patient.
We assessed change in length of stay over time using the Kruskal-Wallis test and the chi-square trend test for proportion of patients requiring dialysis and requiring the ICU. We were unable to analyze and report the change in number of deaths with time due to the small number of events. We did not present variables that were missing more than 20% data including distance from hospital, class 2 panel reactive antibody (PRA) peak, PRA method, and cold ischemia time.
To account for differences in patient case mix across transplant centers, we used fixed effects multivariable Cox proportional hazards regression with the event of interest defined as hospital discharge censored at the time of in-hospital death. Adjusted hazard ratios (HRs) with 95% confidence intervals (CIs) were calculated for each transplant center, relative to the average across all centers. Our models adjusted for the following patient characteristics: recipient age, sex, race, cause of ESRD, BMI, Charlson comorbidity index, pretransplant dialysis modality (none vs hemodialysis or peritoneal dialysis), time on dialysis before transplantation, time era of transplant (as defined above), donor source, and donor age. A center with an HR and both limits of its 95% confidence interval below 1 implies that the center has a significantly longer length of stay than the average after accounting for patient case mix, while a center with an HR and both limits of its 95% confidence interval above 1 implies that the center has a significantly shorter length of stay compared with the average. On the contrary, a center with a confidence interval including 1 implies the length of stay is not significantly different than the average after accounting for patient case mix, center volume, and provider characteristics.
Data were missing for the following variables: recipient race (10.0%), cause of ESRD (7.9%), Charlson comorbidity index (5.5%), BMI (16.9%), donor type (0.75%), and donor age (0.79%). Prior to performing our analyses, we performed multiple imputation using the fully conditional specification (FCS) method which does not assume a joint distribution but instead applies a separate conditional distribution for each of the imputed variables. 20 For categorical values, we used the discriminant method, and for continuous variables, linear regression was applied. We conducted 10 imputations using 100 burn-in iterations. Multivariable analyses were conducted for each imputation dataset and combined across datasets using Rubin’s rules. 21
Results
Patient Case Mix
The final cohort included 5037 kidney transplant recipients (Figure 1). The mean (SD) age of the overall cohort was 50.9 (13.5) years, 63.1% were male, and 63.4% were Caucasian. The most common cause of ESRD was glomerulonephritis (33.4%). Just less than half (42.0%) received a living donor kidney. Variation in recipient and donor characteristics across centers is described in Table 1. The majority of recipient and donor factors varied significantly across the centers including important known prognostic variables such as race, cause of ESRD, time on dialysis, and presence of diabetes. The proportion of missing data in recipient and donor variables ranged between 0.75% and 18.4% with PRA having the most missing values.

Study cohort creation.
Characteristics of Kidney Transplant Recipients and Donors Across Centers at the Time of Transplant.

Note. “≤5” implies n is smaller than or equal to 5 and thus cannot be reported due to privacy concerns. NR = not reported to prevent unblinding of small cell numbers in other columns. ESRD = end-stage renal disease; BMI = body mass index; IQR = interquartile range; COPD = chronic obstructive pulmonary disease; PVD = peripheral vascular disease; TIA = transient ischemic attack; PRA = panel reactive antibody; CNS = central nervous system.
Chi-square test for categorical variables, ANOVA for normally distributed continuous variables (age, BMI, Charlson comorbidity index, deceased, and living age), and Kruskal-Wallis test for nonnormal (time on dialysis and PRA).
This time includes those who did not spend time on dialysis as well.
Rural is defined as living in an area with <10 000 people.
The total under deceased also includes those with missing status.
CNS related includes cerebrovascular, CNS tumor, ruptured cerebral aneurysm, spontaneous intracranial hemorrhage, intracranial event, CNS infection, and cerebral edema.
Trauma includes trauma not from motor vehicle, trauma from motor vehicle and gunshot.
Practice Patterns
Average annual kidney transplant volume ranged between 51.5 (9.3) and 101.7 (23.9) across the 5 centers (P < .0001). There was significant variation in transplant volume by center (Figure 2). The proportion of patients seen by a provider type varied significantly across centers (Table 2). The majority of patients (85.3%) saw a nephrologist, and this proportion ranged between 82.5% and 94.7% across centers (P < .0001). The type of surgeon also varied across centers. Urologists performed all transplant in 3 centers, while in the other 2, there was a mixture of urologists and general surgeons. The proportion of patients who had a urologist perform their transplant ranged between 43.5% and 94.8%, and the proportion who had a general surgeon ranged between 0% and 51.3% across centers (both P < .0001). A total 63.5% of patients had a combination of nephrologist and urologist as their care providers; this proportion ranged between 37.5% and 78.5% and varied significantly across centers (P < .0001). Nephrologist and urologist was the most common combination of care providers (Table 2).
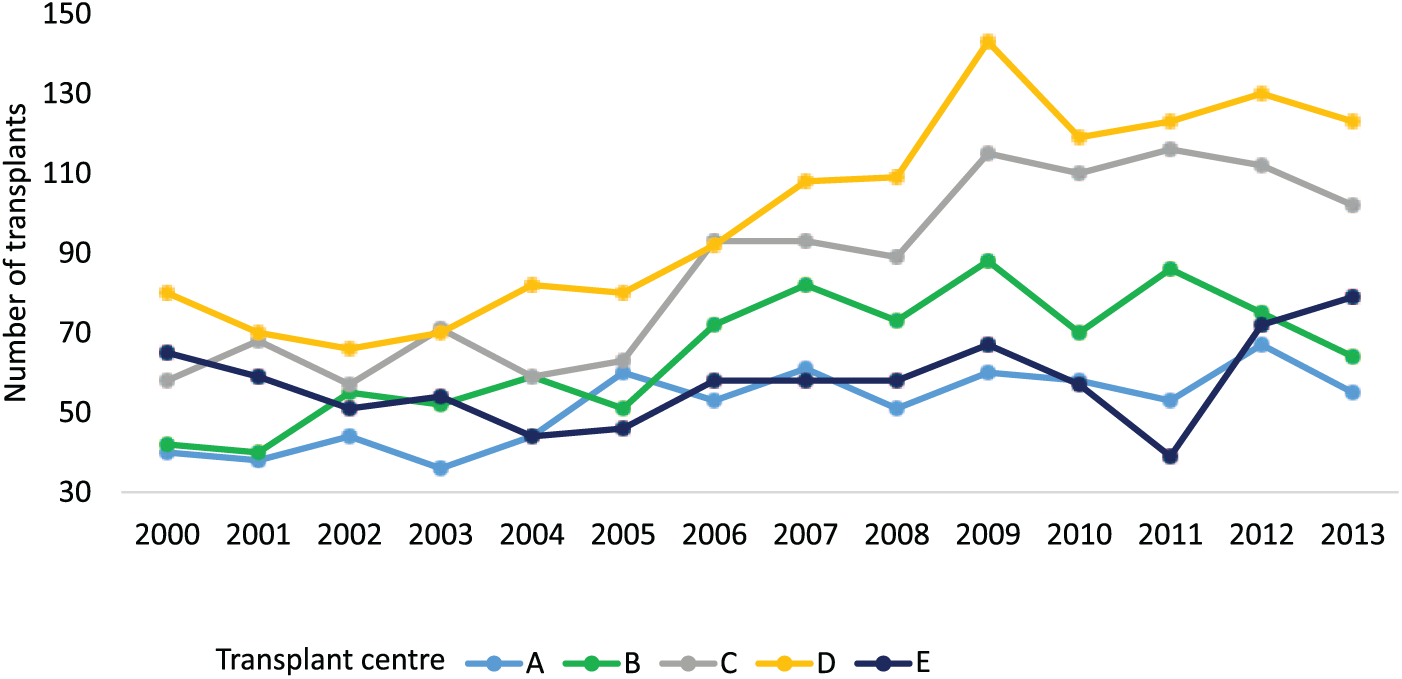
Kidney transplant volume performed per year over the study period at individual transplant center.
Percentage of Patients Overall and Across Each Center Who Saw the Listed Provider Type.
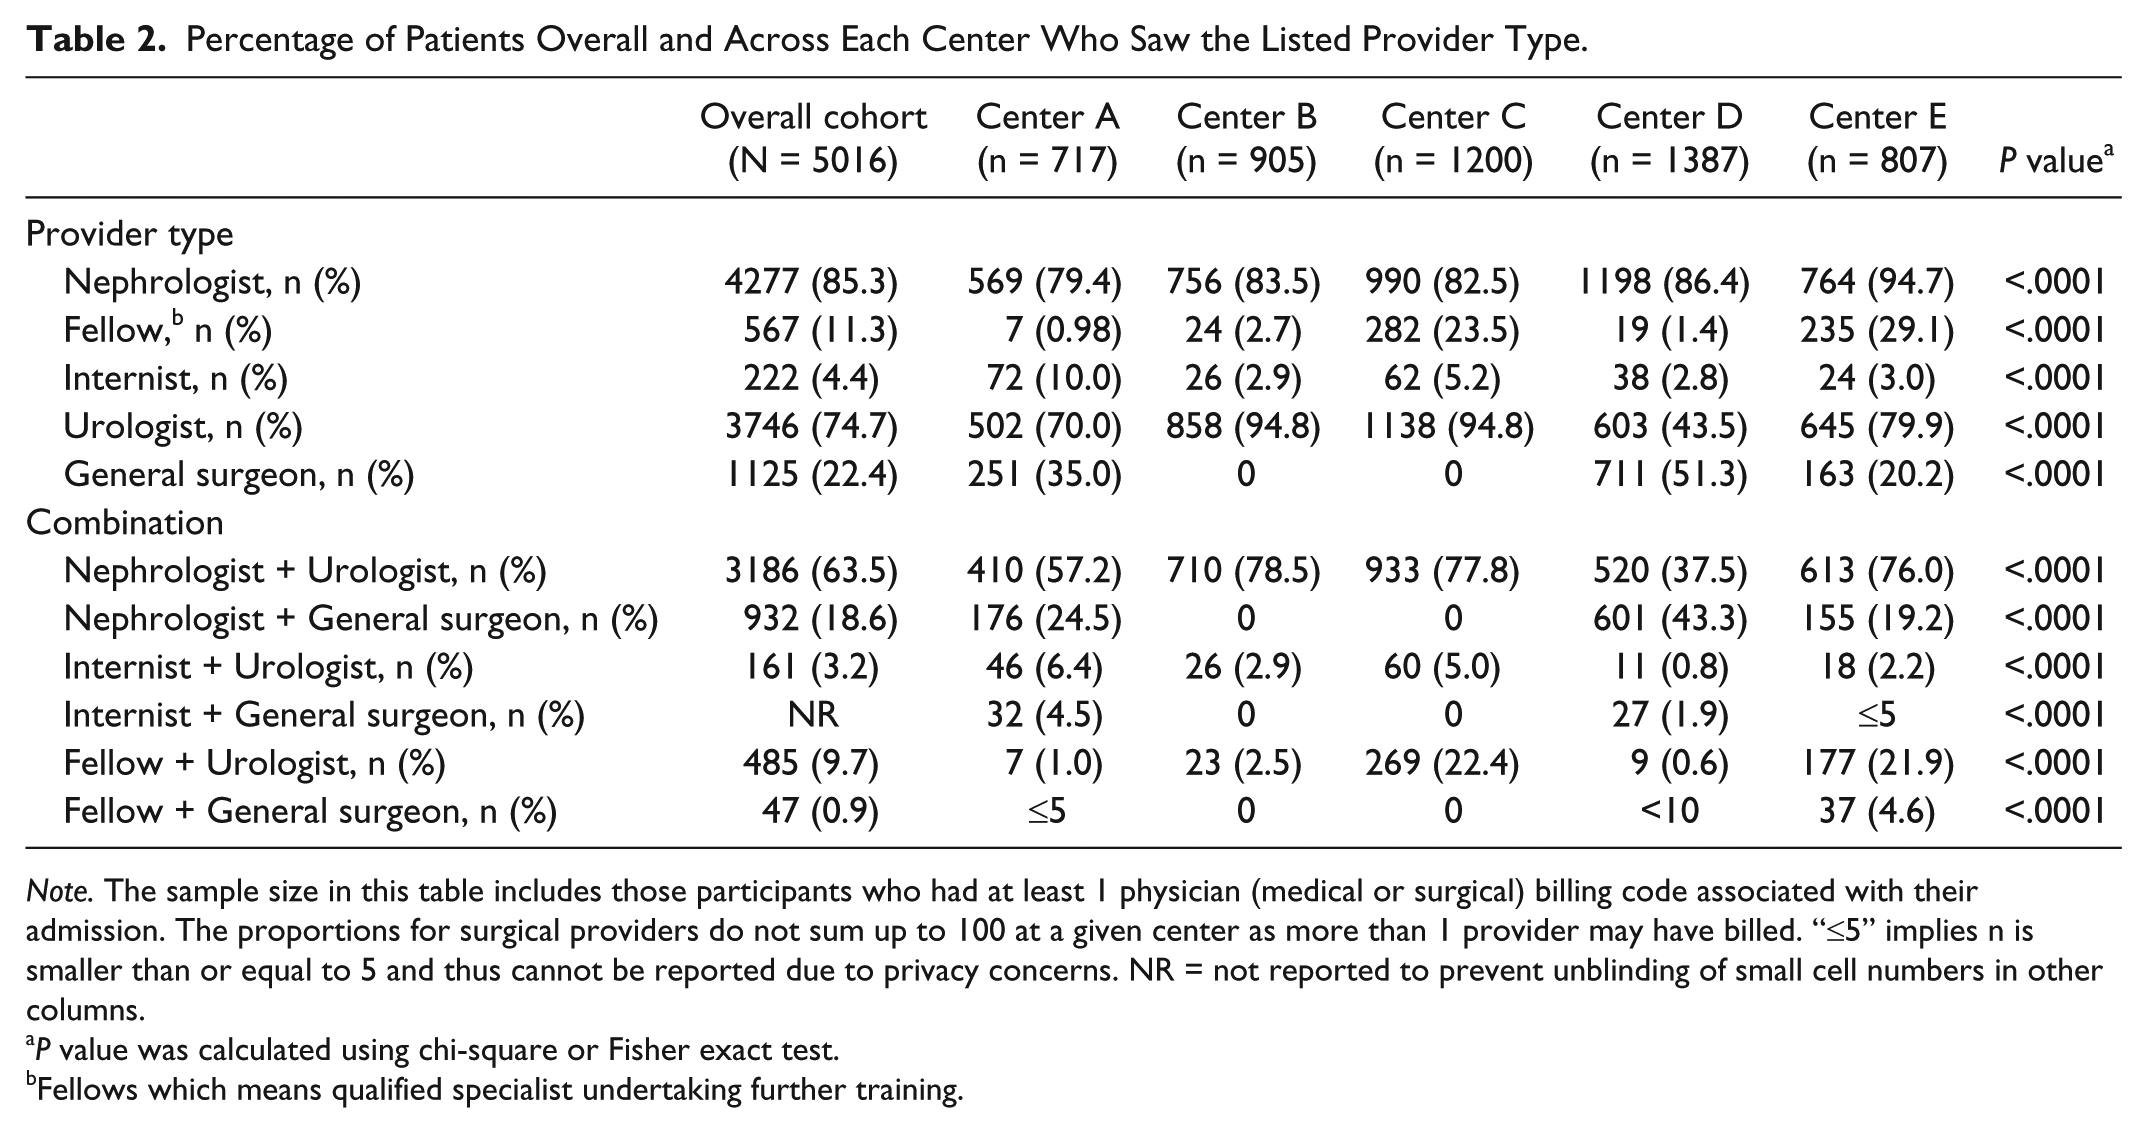
Note. The sample size in this table includes those participants who had at least 1 physician (medical or surgical) billing code associated with their admission. The proportions for surgical providers do not sum up to 100 at a given center as more than 1 provider may have billed. “≤5” implies n is smaller than or equal to 5 and thus cannot be reported due to privacy concerns. NR = not reported to prevent unblinding of small cell numbers in other columns.
P value was calculated using chi-square or Fisher exact test.
Fellows which means qualified specialist undertaking further training.
Provider Characteristics
There were 185 physicians across 5 centers providing the initial care during the transplant admissions from 2000 to 2013. This included nephrologists (n = 66), surgeons (n = 67; urologists and general surgeons) and fellows (specialist undertaking further training; n = 32), and internists and family physicians (n = 20). The characteristics of these physicians are summarized in Table 3. Overall, the majority of encounters were with male providers, and this varied between 71.8% and 100% depending on the specialty. The proportion of encounters with male providers varied significantly by center for nephrologists, urologists, and fellows. Overall, the proportion of encounters with providers who were Canadian graduates ranged between 61.0% and 97.8% depending on the specialty and varied significantly by center for nephrologists, urologists, general surgeons, and fellows. There were significant differences across centers in the provider age and years since graduation for all provider types (all P < .0001).
Characteristics of Physicians Providing Care to the Included Kidney Transplant Recipients Across Centers.

Note. NA = not applicable as there are no providers of that type at the given center. “≤5” implies n is smaller than or equal to 5 and thus cannot be reported due to privacy concerns.
Chi-square test or Fisher’s exact test for categorical variables and ANOVA for continuous variables (age and years since graduation).
For some provider types, the physician characteristic was missing and, therefore, the denominator used is different than total encounters. For example, the denominator used for urologists was 4250 as this was the sample size who had information.
Fellows which means qualified specialist undertaking further training.
Patient Outcomes
Table 4 describes between-center variation in patient outcomes that occurred during the initial transplant hospitalization. The overall median (IQR) length of the initial transplant admission was 8 (7-12) days and the median time varied significantly across centers from 7 to 9 (P < .0001). The overall length of stay decreased significantly with time: 9 (7-14) in 2000-2004, 8 (7-11) in 2005-2009, and 7 (6-10) in 2009-2013 (P < .0001). There were less than 31 in-hospital deaths, and the proportion of deaths did not vary significantly across centers (P = .3). There were 25.1% of recipients who required posttransplant dialysis in hospital; the percentage ranged significantly between centers from 18.3% to 34.5% (P < .0001). The majority of patients who required dialysis were those who had received a deceased donor graft (71.8% [909 of 1266]). The proportion of patients requiring dialysis in hospital fluctuated with time: 26.0% in 2000-2004, 25.9% in 2005-2009, and 23.8% in 2009-2013 (P = .12). Overall, 24.6% of recipients transplanted after March 30, 2002, required admission to intensive care including the step-down unit; this percentage ranged between 5.7 and 58.0 across centers (P < .0001). The proportion requiring admission to the ICU increased significantly with time: 8.4% in 2002-2004, 25.3% in 2005-2009, and 30.6% in 2009-2013 (P < .0001).
Description of In-Hospital Patient Outcomes Among Kidney Transplant Recipients During Their Transplant Admission 2000-2013 Across Centers.

Note. “≤5” implies n is smaller than or equal to 5 and thus cannot be reported due to privacy concerns. IQR = interquartile range; ICU = intensive care unit.
Chi-square test for categorical variables and Kruskal-Wallis test for continuous variables (length of admission, length of stay in ICU, time to dialysis, and time to death).
This was determined based on billing codes and only among those transplanted after April 1, 2002 (n = 4405) and includes the step-down unit (see Appendix).
Adjusted HRs—Length of Stay Censoring at Time of Death
Center-specific HRs for length of stay censored at the time of death obtained from Cox proportional hazards regression models revealed statistically significant differences across centers, after accounting for patient case mix only (P < .0001), adding center volume (P < 0.0001) and provider characteristics (P < .0001). Center-specific HRs ranged between 0.75 (95% CI: 0.69-0.82) and 1.29 (95% CI: 1.20-1.38) in the full models. Patient characteristics found to be statistically significantly associated with this outcome included recipient sex, age, BMI, Charlson comorbidity index, time on dialysis, donor type, donor age, and time era. Center volume, provider experience, and all provider types were not significantly associated with the outcome with the exception of fellow (Table 5).
Center-Specific Hazard Ratios From Multivariable Cox Proportional Hazards Regression Analysis of Hospital Discharge, Censoring for Death.

Note. HR = hazard ratio; CI = confidence interval; ESRD = end-stage renal disease; GN = glomerulonephritis; RVD = renal vascular disease; BMI = body mass index.
Includes Aboriginal, Indian subcontinent, Pacific Islander, Multiracial.
Includes both peritoneal dialysis and hemodialysis.
The reference is the average across all centers.
Discussion
To our knowledge, this is the first Canadian study to assess variation in inpatient outcomes, practice patterns, and provider characteristics in kidney transplantation. In this population-based retrospective cohort study, we found substantial heterogeneity in not only patient factors but also patterns of care defined by provider characteristics in a single Canadian province. Furthermore, the length of hospital admission post kidney transplantation varied significantly across Ontario transplant centers, and this variation was not explained by patient factors, center volume, or provider experience.
Our study found significant between-center differences in patient-level factors. For example, the prevalence of medical comorbidities, such as diabetes, hypertension, and peripheral vascular disease varied substantially across centers, as did average Charlson comorbidity index. Our findings are similar to an earlier Canadian study by Kim et al in which the range in the proportion of transplant recipients over the age of 65 varied across centers (between 1.1% and 13.8%), as did the proportion of recipients with diabetes mellitus as the primary cause of ESRD (between 5.5% and 23.9%) and those receiving a graft from a living donor (between 1.3% and 32.2%). 22 It is well known that kidney transplant recipients commonly have at least 1, if not multiple comorbid conditions at the time of transplant and that these comorbidities are associated with an increased length in hospital stay post transplantation.8,12 In our study, the HR for Charlson comorbidity index was 0.92 (95% CI: 0.90-0.94), implying that each 1-unit increase in the score was associated with a 9% decreased risk of being discharged from the hospital and therefore increased length of stay.
Our study observed substantial variation in kidney transplant volume and the type of physician providing care during the posttransplant admission at the center level. Center volume was not independently associated with length of stay post kidney transplantation. This is similar to what has been found in prior studies. Weng et al did not find a significant association between center volume (using a categorical threshold of 95 patients) and length of hospital stay. 14 Neither did the study by Tsao et al which used a categorical threshold of 72 transplants. 13 In contrast to our study, which used multivariable modeling, neither of these studies adjusted for patient factors when testing for significance.
The majority of the studies published to date, within the field of kidney transplantation, assessing center-level variables have included center volume (generally defined as the number of transplants over a given time period or a categorical threshold) and proportion of recipient and donor types transplanted at a center.9,22,23 For example, the US-based study by Orandi et al which aimed to determine center-level variables associated with the incidence of delayed graft function (DGF) found significant heterogeneity even after adjusting for patient- and center-level characteristics. 23 Center-level variables found to impact DGF incidence included a center’s proportion of donation after cardiac death, of imported kidneys, of preemptive transplants and kidneys with cold ischemia time greater than 30 hours. Interestingly, center volume was not associated with DGF incidence. The hypothesis by Orandi et al was that differences in these variables reflect a center’s experience managing the kidney transplant population; however, these variables may simply represent differences in case mix and do not necessarily reflect differences in patient care. 23
To our knowledge, only 1 study has evaluated differences in provider types across kidney transplant centers. Israni et al studied the structure and delivery of care in 208 adult kidney transplant centers in the United States using surveys. 6 Similar to our study, they found significant variation in the type of provider caring for kidney transplant recipients in hospital immediately after transplantation. For example, most of the centers surveyed in their study had nephrology subspecialty trainees (60.3%) and general surgery trainees (71.8%) providing inpatient care, whereas only 24.4% of centers had urology trainees. In their study, 60.2% of the nephrologists and 48.1% of the transplant surgeons surveyed had worked at the transplant center for more than 10 years. Provider experience and characteristics across the centers were not studied. Little is known about differences in provider experience (years in practice) and provider volume (physician caseload) in kidney transplantation in association with length of hospital stay. In our study, we found that both the type of surgeons (urologist vs general surgeon) patients had for their transplant and provider years of experience (defined as years since graduation) varied significantly across centers. Interestingly, the average provider experience was not associated with length of stay. Only 1 prior study assessed for a similar association. Weng et al found greater provider volume (defined as more than 33 transplants) was associated with a shorter length of hospital stay; this analysis did not adjust for patient case mix. 14
Our study is the first Canadian study to characterize differences in center- and provider-level care during kidney transplantation. The strengths of our study include the large sample size of transplant patients obtained from a validated kidney transplant registry 17 and our ability to describe provider characteristics across transplant centers in a large Canadian province with a universal health care system. There are several limitations to this study, the majority of which relate to the provider information. First, we did not incorporate all inpatient transplant-related provider encounters as we elected to include only the billing codes that were used on the day of transplant. The provider information was captured by using transplant-specific OHIP billings linked to IPDB which has not yet been validated in the transplant setting. Although a prior study 24 which used administrative databases also found the number of new and active nephrologists in Ontario was similar when defined using OHIP billings compared with IPDB listing thus supporting the use of IPDB for identifying providers. Second, we were unable to identify the type of specialty a fellow was part of and therefore do not have information on who is intimately involved in the day-to-day care. However, the overall objective was to provide a brief overview and not specific details which we admit is not possible with administrative data. Third, we included data from only 1 province and therefore cannot generalize our results to the rest of the country; however, Ontario has the greatest number of transplant centers and performs the highest volume in the country. For example, between 2005 and 2014, there were 5000 kidney transplants performed in Ontario alone representing 42% of Canada’s kidney transplant volume. 3 Finally, as we relied on the use of administrative data, and we were limited to the detail provided within the registry, there were missing data for some of the variables of interest including cold ischemia time, HLA mismatch, and ABO-incompatible status which precluded our ability to compare these factors. Furthermore, clinical information on immunosuppressive medications and biopsy results used in a given center are not available within this administrative dataset.
In summary, this study found significant variation in important patient outcomes such as length of hospital stay, following kidney transplantation. We also showed that there were differences at the patient-, center-, and provider-level among Ontario kidney transplant centers. The variation seen across centers in the length of stay was not explained by patient case mix, center volume, or provider characteristics alone which implies that additional unmeasured factors may be involved. The results of our study have important clinical implications as they confirm that Ontario transplant centers vary substantially in the type of patient deemed acceptable for transplantation and certain patient characteristics such as greater BMI, comorbidities, and older donor age are associated with an increased length of hospital stay. Future studies are needed to examine the influence of length of stay and practice patterns on long-term outcomes such as patient/graft survival and quality of life.
Footnotes
Appendix
Coding Definitions for Renal Recipient Outcomes.

| Outcomes | Database | Codes used |
|---|---|---|
| Death | RPDB | |
| Length of stay | CIHI-DAD | DCSDATE-ADMDATE |
| Intensive care unit | CIHI-DAD a | SCU: 10, 20, 30, 40, 45, 60, 90, 93, 95, 99 |
| Dialysis post transplant | CIHI-DAD/OHIP | CCP: 5195, 6698 |
Note. All comorbidities had a 5-year lookback window with the exception of diabetes. RPDB = registered person’s database; CIHI = Canadian Institute for Health Information Discharge Abstract Database; SCU = special care unit; CCP = Canadian Classification of Diagnostic Therapeutic and Surgical Procedures; CCI = Canadian Classification of Interventions; OHIP = Ontario Health Insurance Plan.
Prior to March 30 2002, SCU codes were hospital-specific and varied across institutions and cannot be relied upon. Therefore, our analyses for that variable are limited to those recipients who were transplanted after March 30, 2002.
List of Abbreviations
ESRD, end-stage renal disease; ICU, intensive care unit; ICES, Institute for Clinical Evaluative Sciences; CORR, Canadian Organ Replacement Register; ORPB, Ontario Registered Persons Database; CIHI-DAD, Canadian Institute for Health Information Discharge Abstract Database; OHIP, Ontario Health Insurance Plan; IPDB, ICES Physician Database; SD, standard deviation; IQR, interquartile range.
Ethics Approval and Consent to Participate
This study was approved by the institutional review board at Sunnybrook Health Sciences Centre (Toronto, Canada).
Consent for Publication
Not applicable
Availability of Data and Materials
The full data set creation plan is available from the authors upon request however the data sets supporting this article cannot be made available due to privacy restrictions of the Institute for Clinical Evaluative Sciences.
Author Contributions
AT helped conceive the idea and design of the study, performed all statistical analyses, interpreted the results, and drafted the manuscript. SD participated in the study design, data cleaning, statistical analyses, and interpretation of results. MT participated in the design of the study, statistical analyses and interpretation of results, and drafting of the manuscript. CVW participated in the statistical analysis and interpretation of results. SE and DM participated in the study design and interpretation of results. GK and DF helped conceive the idea and design of the study, interpreted the results, and helped to draft the manuscript. All authors read and approved the final manuscript.
Declaration of Conflicting Interests
The author(s) declared no potential conflicts of interest with respect to the research, authorship, and/or publication of this article.
Funding
The author(s) disclosed receipt of the following financial support for the research, authorship, and/or publication of this article: This study was supported by the Institute for Clinical Evaluative Sciences (ICES). ICES is funded by an annual grant from the Ontario Ministry of Health and Long-term Care (MOHLTC). The opinions, results, and conclusions reported in this article are those of the authors and are independent from the funding sources. Parts of this material are based on data and information compiled and provided by the Canadian Institute for Health Information (CIHI). However, the analyses, conclusions, opinions, and statements expressed herein are those of the author, and not necessarily CIHI. No endorsement by ICES or the Ontario MOHLTC is intended or should be inferred. The research was conducted partly by members of the ICES Kidney, Dialysis and Transplantation team at the ICES Western facility who are supported by a grant from the Canadian Institute of Health Research (CIHR). Greg A. Knoll is supported by the University of Ottawa Chair in Clinical Transplantation Research. Anne Tsampalieros was supported by the Kidney Research Scientist Core Education and National Training Program.